Isolation of the Chromocenter Fraction from Mouse Liver Nuclei
A. N. Prusov1* and O. V. Zatsepina1,2
1Belozersky Institute of Physico-Chemical Biology, Lomonosov Moscow State University, Moscow, 119992 Russia; fax: (095) 939-3181; E-mail: prusov@genebee.msu.su2Shemyakin and Ovchinnikov Institute of Bioorganic Chemistry, Russian Academy of Sciences, ul. Miklukho-Maklaya 16/10, Moscow, 117997 Russia
* To whom correspondence should be addressed.
Received June 8, 2001; Revision received December 13, 2001
A new method for isolation of the constitutive heterochromatin (chromocenters) from interphase nuclei of mouse liver has been developed. This method allows separation of chromocenters of different size. Chromocenter fractions are essentially free of nucleoli and other contaminants. In contrast to nuclei and nucleoli, the chromocenter fraction is characterized by simpler protein composition, this fraction having a reduced number of proteins (especially high molecular weight proteins). Chromocenters contain all histone fractions; however, the relative proportion of histone H1 is lower and histone H3 is higher than in the total nuclear chromatin. The amount of non-histone proteins of 51, 63, 73, and 180 kD is higher in the chromocenter fraction than in nuclei and nucleoli. The use of immunocytochemistry and immunoblotting methods revealed the presence of the specific kinetochore component, CENP A protein. This suggests tight association of some molecular kinetochore components with chromocenters in the interphase.
KEY WORDS: isolation, heterochromatin, chromocenter, kinetochore, CENP A
The interphase nucleus is a highly organized structure that consists of numerous compartments, including nucleoli, heterochromatin, euchromatin, clusters of interchromatin granules, etc. These compartments are responsible for coordinated functioning of various regions of the chromosomes at interphase [1]. It is thought that about 90% of chromosomal genetic material exists in a transcriptionally inactive state. In some mammalian cells a significant proportion of inactive chromatin exists as constitutive heterochromatin. In contrast to facultative heterochromatin, the latter is characterized by a higher package density in interphase, later replication in S-phase, and by lesser proportion of structural genes. Chromocenters are the regions of constitutive heterochromatin, which include centromere sites of chromosomes and which are typical for some species including mouse [2]. In mouse cells, chromocenters contain satellite DNA of the centromere region of chromosomes [3]. Several special proteins, so-called CEN-Proteins, have been recognized only in the centromere region of chromosomes during mitosis and interphase [4, 5]. Some other proteins are also co-localized with the centromere region of chromosomes [6-16]. However, several important questions still remain unanswered: do these proteins represent direct constituents of chromocenters, how tightly are they bound to chromocenters, and what structural or functional role do they play? These questions remain partly from the lack of pure chromocenter fraction availability. In the present study we have isolated chromocenter fraction suitable for analysis of its protein composition and subsequent preparation of antibodies against chromocenter-bound proteins.
MATERIALS AND METHODS
Isolation of nuclei. All procedures were carried out at 5°C. Mouse liver was homogenized in 8% sucrose in buffer A containing 20 mM triethanolamine-HCl (TEA), pH 7.6, 30 mM KCl, 5 mM MgCl2, 0.1 mM PMSF (phenylmethylsulfonyl fluoride), and 1 mM DTT (dithiothreitol). The homogenate was centrifuged at 1000g for 10 min. Concentrated sucrose solution in buffer A was then added to the pellet up to 2.1 M and the sample was centrifuged at 50,000gav for 40 min. The pellet was resuspended in 8% sucrose in buffer A and centrifuged at 1000g for 10 min.
Isolation of chromocenter fraction. The isolated nuclei suspended in 50 mM TEA containing 5 mM MgCl2 and 0.2% Triton X-100 were incubated for 5 min and centrifuged at 1000g for 10 min. The pellet was resuspended in 2 mM TEA containing 0.5 mM MgCl2 and centrifuged at 1000g for 10 min. The pellet resuspended in buffer B containing 2 mM TEA and 0.2 mM MgCl2 (DNA concentration was about 500 µg/ml) was sonicated using an ultrasound disintegrator (MSE) at the amplitude 16 µ for 15-20 sec. Nuclei disintegration was monitored using a phase-contrast light microscope at 50-fold enlargement. The nuclear homogenate was layered onto 15% sucrose in buffer B and centrifuged at 200g for 10 min to remove unbroken nuclei and other large particles. The pellet was discarded, and the supernatant was layered onto 30% sucrose in buffer B and centrifuged at 2500g for 20 min to remove nucleoli. The supernatant was layered again onto 30% sucrose in buffer B and centrifuged at 27,000gav for 20 min using an SW 28 rotor of a Beckman centrifuge (USA). The resulting pellet containing chromocenters was resuspended in 2 mM TEA containing 0.05 mM MgCl2 (buffer C), sonicated as indicated above for 3 sec, layered onto a stepwise gradient sucrose solution of 30, 40, and 50% in buffer C, and centrifuged using the same rotor at 32,000gav for 25 min. The layer between 30 and 40% sucrose contained small chromocenters (chromocenters-1) of 0.1-0.3 µm in diameter and the layer between 40 and 50% sucrose contained larger chromocenters (chromocenters-2) of 0.3-0.5 µm in diameter.
Protein content was determined by the method of Schaffner and Weismann [17].
DNA content was determined spectrophotometrically as described by Spirin [18].
Protein electrophoresis was carried out in a gradient 10-18% polyacrylamide gel using a modification of Laemmli's method [19].
Immunoblotting. Proteins were transferred from gel to nitrocellulose membrane (Sigma, USA) using a standard method. Nonspecific sorption on the nitrocellulose membrane was blocked by 4% nonfat dry milk in buffer D containing 10 mM TEA, 300 mM NaCl, 0.5 mM EDTA (pH 8.0). Autoimmune serum M81 (dilution 1 : 1000) of a patient with rheumatoid arthritis that contained antibodies against CENP-A was used as primary antibodies. Secondary antibodies conjugated with peroxidase (Sigma) were used in dilution 1 : 20,000. The incubation with primary and secondary antibodies was carried out in buffer D containing 1% BSA and 0.2% Tween-20. 3,3´-Diaminobenzidine was used as the substrate for peroxidase.
Immunocytochemistry. Mouse cell culture L929 was cultivated as described earlier [20]. Cells were fixed with 3% formaldehyde (Serva, Germany) in 0.1 M PBS for 10 min at room temperature and lysed by 0.1% Triton X-100 (Fluka, Switzerland) (prepared using the same buffer) during 10 min. Autoimmune serum M81 containing antibodies against the centromere protein CENP-A were used as primary antibodies. Cells were incubated with antiserum (dilution 1 : 100) at 37°C for 40 min. FITC-conjugated antibodies against human immunoglobulins (Sigma) were used as secondary antibodies (dilution 1 : 50). Chromosomes were stained with the DNA-binding fluorochrome DAPI (Sigma, 0.1 µg/ml) for 10 min. Preparations embedded into Mowiol (Calbiochem, USA) were investigated using an Opton epifluorescent microscope (Carl Zeiss, Germany) with Neofluar ×100 lens and ×10 ocular.
Electron microscopy. Fractions fixed with 1% glutaraldehyde (neutralized with NaOH to pH 7.0), and then with 1% OsO4 were dehydrated and embedded into Epon using a standard method. Ultrathin sections obtained by using LKB-III ultratome were contrasted with lead citrate and examined in a Hitachi-11B electron microscope at 75 kV.
RESULTS
Chromocenter isolation. Figure 1 shows a scheme of chromocenter isolation. To maintain native nuclear chromocenters, livers were homogenized at high concentration of magnesium ions (5 mM) and relatively low ionic strength of the isolation medium. These conditions maintained the compact state of chromocenters typical for cells in situ.
The isolated nuclei treated with nonionic detergent Triton X-100 to remove membrane proteins were transferred into solution with very low ionic strength and low concentration of magnesium ions. This resulted in untwisting of the main part of chromatin to thin DNP fibers. Under these conditions chromocenters maintained condensed state and they were separable from dispersed fragments of soluble chromatin by subsequent centrifugations.Fig. 1. Scheme of chromocenter isolation.
Nuclei were sonicated for the minimal short time to maintain chromocenters and nucleoli during disruption of nuclei and fibrillar chromatin dispersion. (Otherwise nucleoli fragments comparable to chromocenters can be co-sedimented together with them.) Since nucleoli and chromocenters differ in size they can be separated by means of differential centrifugation and in various zones of sucrose gradient. After primary separation of chromocenters and nucleoli by differential centrifugation, chromocenters were solubilized into solution containing 2 mM TEA and 0.05 mM MgCl2. Under these conditions chromocenters maintained condensed state whereas non-chromocenter chromatin and nucleoli or their fragments were greatly dispersed. The use of a stepwise sucrose gradient resulted in separation of compact chromocenters from small fragments of dispersed chromatin, nuclear membrane, nucleoli, chromocenter aggregates, and other large particles. Fractions collected at interfaces of sucrose solutions were rather homogenous in size and consisted mainly of chromocenters. Repeated centrifugation in the same sucrose gradient did not improve purification of chromocenter fractions. All steps of chromocenter isolation were carried out under light and electron microscopy control (Fig. 2).
Each fraction of chromocenters (chromocenter-1 and chromocenter-2) contained about 2% of total nuclear DNA (together about 4%).Fig. 2. Ultrathin slices of preparations of isolated nuclei (a), nucleoli containing pellets (after ultrasonic treatment) (b), and chromocenters (the fraction obtained at the interface layer between 40 and 50% sucrose) (c).
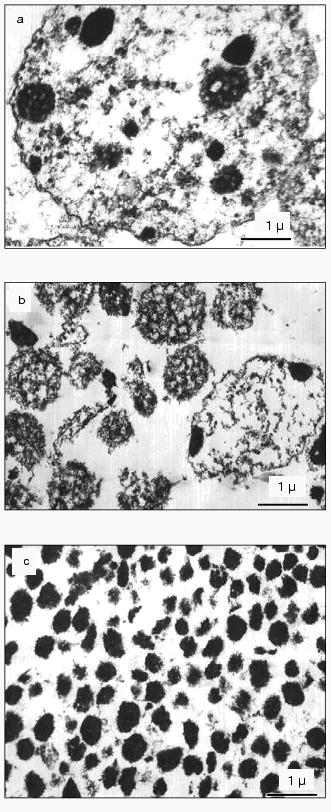
Electron microscopy. Figure 2a shows mouse liver nuclei in 2 mM TEA and 0.2 mM MgCl2. Chromocenters are seen as roundish bodies (200-400 nm in diameter) that consist of electron-dense condensed chromatin. Chromocenters and nucleoli differ from chromatin and other nuclear elements by electron density. Chromatin is seen as fibrillar structures (of 10-30 nm diameter) distributed over the whole volume of the nucleus. In this solution peripheral chromatin and also perinucleolar chromatin (condensed in situ) are dispersed and are not tightly adjoined to the nuclear envelope or nucleolus. Under these ionic conditions nucleoli (in the pellet that consists of nucleoli and unbroken nuclei, Fig. 2b) are characterized by friable granular-fibrillar structure distinct from the dense chromocenters.
Figure 2c shows an electron micrograph of the chromocenter fraction obtained at the interface of between 40 and 50% of sucrose gradient. This fraction consists of roundish particles of 300-400 nm in diameter that are characterized by dense condensed structure. Small quantities of fibrillar and circular structures can be attributed to contaminants of other nuclear elements.
Thus, our method provides the fraction of mouse constitutive heterochromatin (chromocenters) that is essentially free of contaminants representing other cellular structures. The isolated fraction was used for comparative analysis of proteins of constitutive heterochromatin, total nuclear, and nucleolar chromatin.
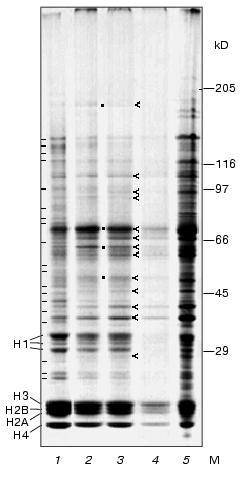
Protein electrophoresis. Figure 3 shows electrophoregrams of total nuclear proteins, proteins obtained from different zones of stepwise sucrose gradient, and proteins of nucleolar fraction isolated after ultrasonic treatment of nuclei. Electrophoregrams of nuclear proteins (lane 1) and chromocenter fractions (lanes 2 and 3) are characterized by different protein content in many bands; in chromocenters many bands (distributed over the whole length of the lane) are weaker than in nuclei. The apparent molecular masses of protein in these bands are as follows: 23, 24, 27, 36, 39, 43, 45, 48, 53, 56, 65, 77, 80, 85, 99, 120, 127, 135, and 143 kD (marked with hyphens). Scanning of the gels revealed that chromocenter fractions are characterized by lower histone H1/core histones ratio compared to the nuclear fraction. In other zones protein content of chromocenter fraction was the same or even higher than in nuclei. Besides histones, chromocenter fractions contain major protein bands with apparent molecular masses of 37, 41, 63, 67, and 73 kD (marked with ticks). The intensity of staining of these bands was higher in chromocenter fraction than in nuclei. Besides these bands, the intensity of staining in bands corresponding to apparent molecular masses of 28, 46, 51, 95, and 180 kD was higher in chromocenter fractions, whereas in bands corresponding to 59, 92, and 105 kD the intensity of staining was the same as in nuclei (marked with ticks).
The most difficult problem during chromocenter isolation consists in the separation of chromocenters from nuclei, because sedimentation characteristics of small nuclei (under friable state) may be similar to large chromocenters. For analysis of purity of isolated chromocenters we have analyzed nucleoli enriched fraction which was pelleted after ultrasonic treatment of nuclei (see scheme on Fig. 1). For evaluation of the content of non-histone proteins, we applied 1.5-fold higher amount of nucleolar proteins on lane 5 for equilibration of protein content in core histone protein zones of all fractions analyzed. In contrast to chromocenter fractions, which contain less non-histone proteins than nuclei, the nucleolar fraction is enriched with many non-histone proteins including high molecular mass ones. Some protein bands predominating in chromocenter fractions are also present in the nucleolar fraction. These include molecular masses about 28, 37, 41, 46, 59, 67, 92, and 105 kD. It is also possible that chromocenters and nucleoli contain different proteins in these bands. The presence of these protein bands in nucleoli may be partially explained by contamination of this fraction with large chromocenters and unbroken nuclei. However, besides these there are some bands that predominate in chromocenter fraction compared with nuclei and nucleoli; these include those at molecular masses of 51, 63, 73, and 180 kD (marked with dots; Fig. 3).
Using 8-fold less protein of chromocenter-2 applied onto lane 4 compared with lane 3 (Fig. 3) we were able to detect only major proteins of this fraction. The protein content of histone H3 zone was higher than in other histone zones.Fig. 3. Electrophoregrams of proteins obtained using gradient (10-18%) SDS-PAGE: 1) total protein of mouse liver nuclei (25 µg); 2) chromocenter fraction obtained at the interface layer between 30 and 40% sucrose (25 µg); 3) chromocenter fraction obtained at the interface layer between 40 and 50% sucrose (25 µg); 4) the same fraction obtained at the interface layer between 30 and 40% sucrose (3.5 µg); 5) fraction of nucleolar pellet (after ultrasonic treatment of nuclei) (36 µg). M, molecular mass (kD); H1, histone H1; H3, H2B, H2A, and H4, histones of the nucleosome core-particle; hyphens (-) show protein bands predominating in nuclei than in chromocenters; ticks (<) indicate protein zones predominating in chromocenters rather than in nuclei; dots (*) show fractions predominating in chromocenters rather than in nuclei and nucleoli.
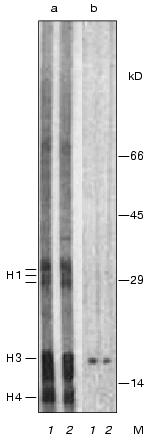
Immunoblotting. To evaluate the possible presence of kinetochore proteins in the isolated chromocenters, we have employed immunoblotting and antiserum M81 against kinetochore protein CENP A obtained from a patient with rheumatoid arthritis. Figure 4 shows immunoblot analysis of nuclear proteins and chromocenter fraction separated by SDS electrophoresis, transferred onto nitrocellulose membrane and stained with amido black (Fig. 4a) or treated with M81 antiserum reacting with CENP A and with peroxidase-conjugated secondary antibodies (Fig. 5b). In nuclear and chromocenter preparations the antibodies stained only one protein band localized within histone H3 zone.
Fig. 4. Immunoblotting of nuclear (1) and chromocenter preparation (2): a) electrophoregram staining on nitrocellulose membranes with amido black; b) immune staining on nitrocellulose membranes with M81 antiserum. M, molecular mass ( kD); H1, H3, and H4, histones H1, H3, and H4, respectively.
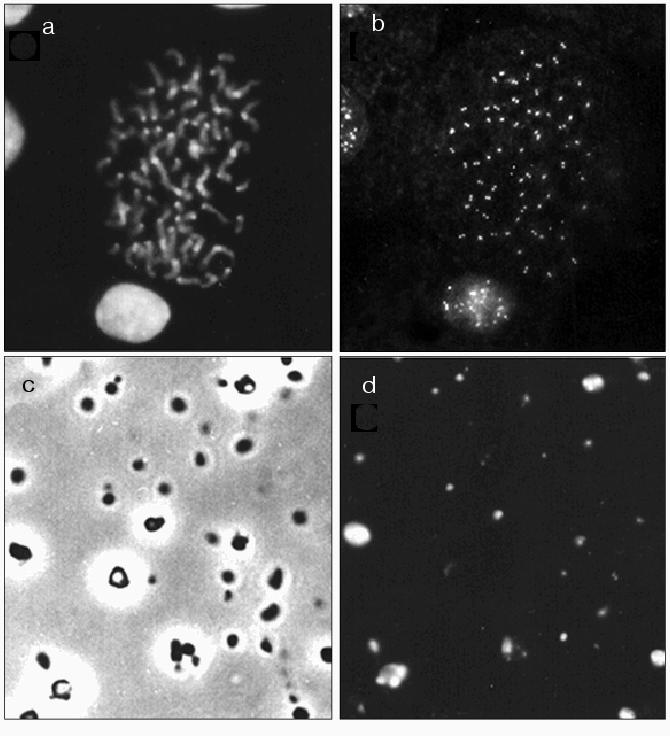
Immunocytochemistry. To evaluate whether kinetochore proteins are present in the isolated chromocenters, this fraction was stained with antiserum (M81) against CENP A. Figure 5 shows that antiserum M81 caused dotted staining of chromosomes and interphase nuclei of mouse L929 cells; paired dots are clearly distinguished within the centromere region (Fig. 5, a and b). Figure 5 (c and d) shows total preparations of the isolated chromocenter fraction using phase contrast and antiserum M81 staining. The major part of particles of this preparation was stained by antiserum M81.Fig. 5. Light microscopy. a, b) Chromosomes and nuclei of HeLa cell culture stained with DAPI (a) and antiserum M81 (b); c, d) fraction of mouse liver chromocenters: c) phase contrast; d) M81 antiserum staining.
DISCUSSION
The nucleus is a complex subcellular organelle. All nuclear substructures are involved in the organization and functioning of chromatin. In contrast to cytoplasm, where each organelle exists as a separate structure or has clear compartmentalization border, the nucleus is a territory where each nuclear unit is involved in the interaction with chromatin fibers or DNA. This explains evident difficulties which accompany isolation of pure nuclear substructures. This also explains why nuclear substructures are less studied than the cytoplasmic ones. However, the isolation of organelles may provide decisive evidence for the localization of protein, nuclear, and other cell components; this also allows analysis of the structural basis of such organelles. The intactness of the isolated structure is another preconditions for correct structure-functional analysis; it is strongly influenced by mode(s) and strength of treatments used for organelle isolation.
Among methods used to isolate nuclear compartments, methods for isolation of nuclear envelope (and its components) and nucleoli are the best developed [21-24]. However, removal of chromatin tightly associated with nuclear envelope or nucleoli is nearly impossible under native conditions. So concentrated salt solutions are often used in purification procedures. Such treatment affects the native properties of the resulting preparation. Recently a method for isolation of clusters of interchromatin granules was developed; it also uses treatment with concentrated salt solution [25]. Concentrated salt solutions are also used during isolation of nuclear matrix [26].
Many approaches are used for isolation of native nucleosome and nucleomere chromatin particles [27, 28]. However, problems related to the isolation of higher organized compact structures of native chromatin remain to be overcome. These chromatin structures are preserved in the nucleus only at increased concentrations of bivalent cations. However, the use of such cations results in aggregation of the whole chromatin, and this seriously complicates the isolation of highly organized chromatin structures.
The centromere regions of chromosome containing satellite DNA are of great interest [29, 30]. Several methods for isolation of satellite chromatin as soluble fragments obtained by nuclease treatment of chromosomes or nuclei have been developed [31-35].
Earlier Stephanova et al. reported results of isolation of chromocenters, native structural complexes of interphase heterochromatin [3]. For separation of chromatin fractions they employed diffusion of the main part of nuclear chromatin in solutions of low ionic strength followed by sedimentation of large particles which were resistant to diffusion. This approach resulted in co-isolation of chromocenters together with nucleoli as evidenced by the photographs presented in [3].
In the present study we employed differential centrifugation for separation of chromocenters from nucleoli and purification and separation of chromocenters by sedimentation rate in a stepwise sucrose gradient (Fig. 1). Other characteristic features of our method include the use of buffer solutions containing magnesium ions as more physiological for the intranuclear environment. Chromocenter fraction was not treated with solutions of high ionic strength because it would lead to protein extraction. Earlier it was found that in contrast to the main chromatin, chromocenters in the nucleus maintain condensed structure at low concentration of bivalent cations (0.1-0.2 mM Ca2+ and 2 mM Mg2+) [36, 37]. In the present study we have found that after isolation of chromocenters from nuclei (by means of fragmentation under conditions of low ionic strength, 2 mM TEA) maintenance of the compact structure of chromocenters requires lower (0.05 mM) concentration of magnesium ions. Under these conditions nucleoli were very friable, and this was used to monitor the separation of nucleoli from chromocenters.
The important goal of this study was to isolate pure chromocenters with the highest yield. Each fraction of chromocenters (chromocenter-1 and chromocenter-2) contained about 2% of the total nuclear DNA (~4% in total). According to the literature satellite DNA represents about 7% of the mouse genome and the whole centromere region of mouse chromosomes represents up to 20% of total DNA [31]. Consequently, DNA content in chromocenters may be roughly evaluated as 10-20%. In this case the yield of chromocenters in the isolated fractions is about 30%.
The interphase chromocenters are domains or compartments that contain centromere regions of chromosomes; they probably represent a special compact form of chromatin [2]. Cytological study of chromocenters revealed that they contain not only centromere but also pericentromere regions of chromosomes. The amount of chromocenter in the nucleus is less than that of mitotic chromosomes [2, 20, 37]. Centromere regions can form one large chromocenter. It is possible that chromocenters may contain chromosomal sites adjacent to the primary constriction. In mouse chromosomes these include major satellite site [29] and telomere region of chromosomal shorter arm [38]. Kinetochores located at the primary constriction may also be included into interphase chromocenters [39]. Chromocenters may also share some components with other structures of the interphase nucleus (to which they are attached). Chromocenters are often bound to the nuclear envelope [40] and the nucleolus [41, 42]. Since the nuclear envelope and the nucleolus represent elements of nuclear matrix, chromocenters may also contain components which were initially identified as components of nuclear matrix. Since chromocenters contain transcriptionally inactive chromatin they may contain elements of chromosomal and chromatin “skeleton” (scaffold) rather than functional part on nuclear matrix (inner nucleoprotein part of nuclear matrix).
It is known that heterochromatin containing satellite DNA contains less non-histone proteins than the total chromatin [3, 32-35]. Our results confirm these observations: the chromocenter fractions are characterized by reduced content of many non-histone proteins. Histones represent the main proportion of proteins of the chromocenter fraction (Fig. 3). Slightly decreased content of histone H1 is consistent with results from other laboratories on decreased H1 content in bovine satellite chromatin [33] and in the African green monkey [35]. We also found relative increase of histone H3 content. This increase may be related to specific packaging of the centromere chromatin. Kinetochore protein CENP A (molecular mass 17 kD) is known to be a histone H3 homolog that can replace H3 in nucleosomes [43]. Other centromere bound H3-like proteins have also been recognized [44, 45]. In the present report we have demonstrated that CENP A is preserved in the isolated fraction of chromocenters. However, immunoblot staining (Fig. 4) suggests that chromocenters are not enriched with this protein. It is possible that kinetochore components are located on the surface of isolated chromocenters and are lost during the isolation procedure. It is also possible that protein enrichment of the H3 band involves other H3-like proteins.
Besides the main chromatin proteins, histones, many various proteins are cytologically co-localized with mitotic and interphase heterochromatin. These include CENP (centromere proteins) kinetochore proteins [5], and heterochromatin proteins involved into heterochromatin formation or gene repression such as proteins of the HP1 family: HP1, M31 (about 25 kD) [8, 9], etc. Other proteins interacting with either HP1 or satellite DNA (e.g., SUV39H1 (48 kD) [10], ATRX (280 kD) [15], INCENP (96 kD) [11], Ikaros (57 kD) [12] and related proteins such as Helios-70 kD [13]) may also be co-localized with heterochromatin. A small protein of the HMG family, HMG I/Y (11 kD) [6, 7], and also proteins interacting with methylated DNA (29-70 kD) [46] may be bound to the centromere region of chromosomes. Such known proteins interacting with SAR/MAR DNA of chromosomal scaffold, e.g., topoisomerase II (of 170 and 180 kD) [14], and also proteins of nuclear matrix specifically bound to major (SAF-A of 120 kD) [47] or minor (p70 of 70 kD) [16] of satellite DNA were also found in the centromere heterochromatin.
Proteins of 67-75 kD (the main band of 73 kD) represent a significant proportion in isolated chromocenters. It is possible that some of these proteins are specific for chromocenters. However, it is also possible that lamins represent part of these proteins as a significant proportion of chromocenters directly contacts with nuclear envelope [37, 40, 48]. In should also be noted that in this band of the electrophoregram there are other proteins which may be bound to chromocenters (e.g., nuclear matrix proteins [16]). A protein band of 63 kD is also present in the chromocenter fraction. In contrast to nuclei and nucleoli, chromocenters are enriched with these proteins. The content of 51 kD proteins is also higher in chromocenters than in nuclei and nucleoli. Protein bands of 46 and 92 kD may also be specific for chromocenters. However, additional experiments are required to clarify this point because similar bands have been found in the nucleolar fraction.
Thus, the analysis of protein composition of isolated chromocenters suggests that among major non-histone proteins chromocenter-specific proteins can be found bands of 180, 73, 63, 51, and possibly 46 kD. Using similarity in molecular masses of proteins localized in the centromere region of chromosomes a list of candidates for chromocenter-specific non-histone proteins includes topoisomerase II (180 kD) [14], methylated DNA binding proteins (MeCP2 of 52.4 kD, MBD4 of 62 kD, MBD1 of 70 kD) [46], matrix protein p70 [16], and SUV39H1 of 48 kD [10]. Chromocenters also contain a protein band of 120 kD (SAF-A of 120 kD) [47] which is somewhat is less intense than in nuclei and nucleoli. Molecular masses of some heterochromatin proteins are within the region of histone H1: HP1, M31 (about 25 kD) [8, 9], MBD2b (29 kD), MBD3 (32 kD) [46]. On electrophoregrams these proteins may be hidden among subfractions of this histone. However, identification of proteins in these bands requires special investigation.
The authors are grateful to O. Zharskaya for her help in immunocytochemical staining of preparations and to V. V. Kruglyakov for assistance in electron microscopy.
This work was supported by the Russian Foundation for Basic Research (grants 00-04-48350 for A.N.P. and 00-04-48294 for O.V.Z.).
REFERENCES
1.Cockell, M., and Gasser, S. M. (1999) Curr.
Opin. Genet. Dev., 9, 199-205.
2.Prokofieva-Belgovskaya, A. A. (1986)
Heterochromatin Regions of Chromosomes [in Russian], Nauka,
Moscow.
3.Stephanova, E., Russanova, V., Chentsov, Y., and
Pashev, I. (1988) Exp. Cell Res., 179, 545-553.
4.Earnshaw, W. C. (1994) Structure and Molecular
Biology of the Kinetochore. Microtubules, Wiley-Liss Inc., New
York.
5.Pluta, A. F., Mackay, A. M., Ainsztein, A. M.,
Golgberg, I. G., and Earnshaw, W. C. (1995) Science, 270,
1591-1594.
6.Strauss, F., and Varshavsky, A. (1984) Cell,
37, 889-901.
7.Slama-Schwok, A., Zakrzewska, K., Leger, G.,
Leroux, Y., Takahashi, M., Kas, E., and Debey, P. (2000) Biophys.
J., 78, 2543-2559.
8.Wang, G., Ma, A., Chow, C. M., Horsley, D., Brown,
N. R., Cowell, I. G., and Singh, P. B. (2000) Mol. Cell Biol.,
20, 6970-6983.
9.Hoyer-Fender, S., Singh, P. B., and Motzkus, D.
(2000) Exp. Cell Res., 254, 72-79.
10.Melcher, M., Schmid, M., Aagaard, L., Selenko,
P., Laible, G., and Jenuwein, T. (2000) Mol. Cell Biol.,
20, 3728-3741.
11.Ainsztein, A. M., Kandels-Lewis, S. E., Mackay,
A. M., and Earnshaw, W. C. (1998) J. Cell Biol., 143,
1763-1774.
12.Brown, K. E., Guest, S. S., Smale, S. T., Hahm,
K., Merkenschlager, M., and Fisher, A. G. (1997) Cell,
91, 845-854.
13.Hahm, K., Cobb, B. S., McCarty, A. S., Brown, K.
E., Klug, C. A., Lee, R., Akashi, K., Weissman, I. L., Fisher, A. G.,
and Smale, S. T. (1998) Genes Dev., 12, 782-796.
14.Rattner, J. B., Hendzel, M. J., Furbee, C. S.,
Muller, M. T., and Bazett-Jones, D. P. (1996) J. Cell Biol.,
34, 1097-1107.
15.McDowell, T. L., Gibbons, R. J., Sutherland, H.,
O'Rourke, D. M., Bickmore, W. A., Pombo, A., Turley, H., Gatter, K.,
Picketts, D. J., Buckle, V. J., Chapman, L., Rhodes, D., and Higgs, D.
R. (1999) Proc. Natl. Acad. Sci. USA, 96,
13983-13988.
16.Enukashvili, N. I., and Podgornaya, O. I. (2001)
Tsitologiya, 43, 52-60.
17.Schaffner, W., and Weismann, C. (1973) Analyt.
Biochem., 56, 502-514.
18.Spirin, A. S. (1958) Biokhimiya,23,
656-658.
19.Laemmli, U. K. (1970) Nature, 227,
680-685.
20.Kudryavtsev, I. S., and Zatsepina, O. V. (1993)
Tsitologiya,35, 30-35.
21.Prusov, A. N., Fais, D., and Polyakov, V. Yu.
(1989) Biokhimiya,54, 1838-1846.
22.Dwyer, N., and Blobel, G. (1976) J. Cell
Biol., 70, 581-591.
23.Miller, B. R., and Forbes, D. J. (2000)
Traffic, 1, 941-951.
24.Desjardins, R., Smetana, K., and Busch, H. (1965)
Exp. Cell Res., 40, 127-137.
25.Mintz, P. J., Patterson, S. D., Neuwald, A. F.,
Spahr, C. S., and Spector, D. L. (1999) EMBO J., 18,
4308-4320.
26.Berezney, R., and Coffey, D. S. (1977) J. Cell
Biol., 73, 616-637.
27.Kiryanov, G. I., Smirnova, T. A., and Polyakov,
V. Yu. (1982) Eur. J. Biochem., 124, 331-338.
28.Hozier, J., Renz, M., and Nehls, P. (1977)
Chromosoma, 62, 301-317.
29.Lobov, I. B., and Podgornaya, O. I. (1999)
Tsitologiya, 41, 562-573.
30.Van Hooser, A. A., Mancini, M. A., Allis, C. D.,
Sullivan, K. F., and Brinkley, B. R. (1999) FASEB J., 13,
216-220.
31.Rattner, J. B., Krystal, G., and Hamkalo, B. A.
(1978) Chromosoma, 66, 259-268.
32.Mazrimas, J. A., Balhorn, R., and Hatch, F. T.
(1979) Nucleic Acids Res., 7, 935-946.
33.Weber, J. L., and Cole, R. D. (1982) J. Biol.
Chem., 257, 11784-11790.
34.Zhang, X. Y., and Horz, W. (1982) Nucleic
Acids Res., 10, 1481-1494.
35.Jasinskas, A., and Hamkalo, B. A. (1999)
Chromosome Res., 7, 341-354.
36.Frolova, E. I., Zatsepina, O. V., Polyakov, V.
Yu., and Chentsov, Y. S. (1989) Tsitologiya, 31,
380-385.
37.Stephanova, E. V., and Chentsov, Yu. S. (1990)
Mol. Biol. (Moscow), 24, 506-514.
38.Cerda, M. C., Berrios, S., Fernandez-Donoso, R.,
Garagna, S., and Redi, C. (1999) Biol. Cell., 91,
55-65.
39.Pudenko, A. S., Kudryavtsev, I. S., Zatsepina, O.
V., and Chentsov, Y. S. (1997) Biol. Membr. (Moscow), 14,
365-374.
40.He, D., and Brinkley, B. R. (1996) J. Cell
Sci., 109, 2693-2704.
41.Manuelidis, L., and Borden, J. (1988)
Chromosoma, 96, 397-410.
42.Ochs, R. L., and Press, R. I. (1992) Exp. Cell
Res., 200, 339-350.
43.Yoda, K., Ando, S., Morishita, S., Houmura, K.,
Hashimoto, K., Takeyasu, K., and Okazaki, T. (2000) Proc. Natl.
Acad. Sci. USA, 97, 7266-7271.
44.Henikoff, S., Ahmad, K., Platero, J. S., and van
Steensel, B. (2000) Proc. Natl. Acad. Sci. USA, 97,
716-721.
45.Chen, Y., Baker, R. E., Keith, K. C., Harris, K.,
Stoler, S., and Fitzgerald-Hayes, M. (2000) Mol. Cell Biol.,
20, 7037-7048.
46.Hendrich, B., and Bird, A. (1998) Mol. Cell.
Biol., 18, 6538-6547.
47.Lobov, I. D., Tsutsui, R., Mitchell, A. R., and
Podgornaya, O. I. (2000) Eur. J. Cell Biol., 79,
1-11.
48.Burakov, V. V., Onishenko, G. E., and Chentsov,
Yu. S. (1976) Tsitologiya,18, 1428-1432.