Kinetics of Thermal Aggregation of Tobacco Mosaic Virus Coat Protein
B. I. Kurganov1*, E. R. Rafikova2, and E. N. Dobrov2
1Bach Institute of Biochemistry, Russian Academy of Sciences, Leninsky pr. 33, Moscow, 117071 Russia; fax: (095) 954-2732; E-mail: kurganov@gagarinclub.ru2Belozersky Institute of Physico-Chemical Biology, Lomonosov Moscow State University, Moscow, 119899 Russia; fax: (095) 939-3181; E-mail: dobrov@belozersky.msu.ru
* To whom correspondence should be addressed.
Received September 19, 2001
The kinetics of thermal aggregation of coat protein (CP) of tobacco mosaic virus (TMV) have been studied at 42 and 52°C in a wide range of protein concentrations, [P]0. The kinetics of aggregation were followed by monitoring the increase in the apparent absorbance (A) at 320 nm. At 52°C the kinetic curves may be approximated by the exponential law in the range of TMV CP concentrations from 0.02 to 0.30 mg/ml, the first order rate constant being linearly proportional to [P]0 (50 mM phosphate buffer, pH 8.0). The analogous picture was observed at 42°C in the range of TMV CP concentrations from 0.01 to 0.04 mg/ml (100 mM phosphate buffer, pH 8.0). At higher TMV CP concentrations the time of half-conversion approaches a limiting value with increasing [P]0 and at sufficiently high protein concentrations the kinetic curves fall on a common curve in the coordinates {A/Alim; t} (t is time and Alim is the limiting value of A at t --> infinity). According to a mechanism of aggregation of TMV CP proposed by the authors at rather low protein concentrations the rate of aggregation is limited by the stage of growth of aggregate, which proceeds as a reaction of the pseudo-first order, whereas at rather high protein concentrations the rate-limiting stage is the stage of protein molecule unfolding.
KEY WORDS: tobacco mosaic virus, coat protein, thermal aggregation, kinetics
Abbreviations: CP) coat protein; DSC) differential scanning calorimetry; TMV) tobacco mosaic virus.
Over many years coat protein (CP) of tobacco mosaic virus (TMV) has been
the subject of investigation of protein polymerization [1]. At the present time it is clear that TMV CP is
also a suitable model for the study of “nonspecific”
aggregation [2]. The rate of thermal aggregation of
TMV CP depends highly on the ionic strength of the medium. Thus, change
in ionic strength may provide a rate of aggregation suitable for
measurement at different temperatures and protein concentrations.
Previously [3] we analyzed the shape of the kinetic curves of protein aggregation at elevated temperatures. The results of analysis showed that the terminal phase of aggregation follows the first order kinetics (the exponential law). This means that the rate of aggregation expressed as the rate of diminishing the concentration of the non-aggregated protein is proportional to the first power of the non-aggregated protein concentration. In some cases the rate constant of the first order calculated from the kinetic curve of aggregation coincides with the rate constant of protein denaturation. Such a situation suggests that the rate of aggregation is limited by the rate of unfolding of the protein molecule. Aggregation refers to interaction of several molecules of denatured protein. Thus, aggregation is a bi(multi)molecular reaction. One can expect that at relatively low protein concentrations the rate-limiting stage of aggregation will be the stage of growth of protein aggregate. From such considerations, the idea was put forward that the investigation of the kinetics of aggregation in a wide range of the protein concentrations provided the basis for the elucidation of the mechanism of thermal aggregation [3].
The goal of the present work was to study the kinetics of thermal aggregation of TMV CP at various concentrations of the protein. The investigations were carried out at 42 and 52°C.
MATERIALS AND METHODS
The preparations of TMV and TMV CP were isolated by standard methods [4, 5]. The protein concentration was determined by UV spectroscopy using absorption coefficient A1%1cm,280 equal to 13.0 [6].
The kinetics of aggregation was registered by the increase in absorbance of the protein solution at 320 nm (42 or 52°C). Measurements of absorbance were performed in 1-cm cells using a SLM Aminco DW-2000 spectrophotometer (USA). The volume of the sample was 2.0 ml. The phosphate buffer was incubated for 10 min at a certain temperature. Then a small volume of the solution of TMV CP (~5 mg/ml) in 5 mM phosphate buffer, pH 8.0, preheated to 35°C was added. The final concentration of buffer was 100 mM (42°C) or 50 mM (52°C). The dead time was 10 sec.
Denaturation of TMV CP was studied by differential scanning calorimetry (DSC) using a differential scanning calorimeter DASM-4 (Biopribor, Russian Academy of Sciences, Pushchino). The scanning rate was 1°C/min. When calculating the heat capacity, we set the molecular mass of TMV CP equal to 17.5 kD.
Programs Origin 5.0 (MicroCal Software, Inc., USA) and Scientist (MicroMath, USA) were used for the mathematical calculations.
RESULTS
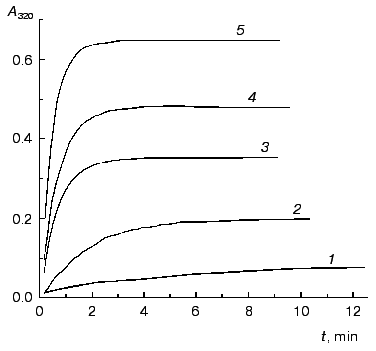
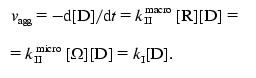
The kinetics of aggregation of TMV CP at 52°C. Protein aggregates possess an enhanced ability to scatter the incident light. Therefore the kinetics of aggregation may be easily registered by the increase in the apparent absorbance in the visible region where inherent protein absorbance is lacking. Aggregation of TMV CP was studied at 52°C in the range of the protein concentrations from 0.02 to 0.30 mg/ml (50 mM phosphate buffer, pH 8.0). Figure 1 shows the typical kinetic curves of aggregation registered by the increase in the absorbance at 320 nm (A320).
Analysis of the kinetics of aggregation was based on the assumption that absorbance is proportional to the amount of the aggregated protein (this assumption was used by us earlier in [3]). If aggregation follows the first order kinetics, the following equations may be used for quantitative description of the kinetic curves [3, 7]:Fig. 1. The kinetics of aggregation of TMV CP at 52°C. Aggregation was registered by the increase in absorbance at 320 nm (A320). Conditions: 50 mM phosphate buffer, pH 8.0. The protein concentration: 0.05 (1), 0.1 (2), 0.15 (3), 0.2 (4), and 0.3 mg/ml (5).
where t is time, Alim is the limiting value of A at t --> infinity, kI is the rate constant of the first order, and t0 is the value of t at which A = 0.
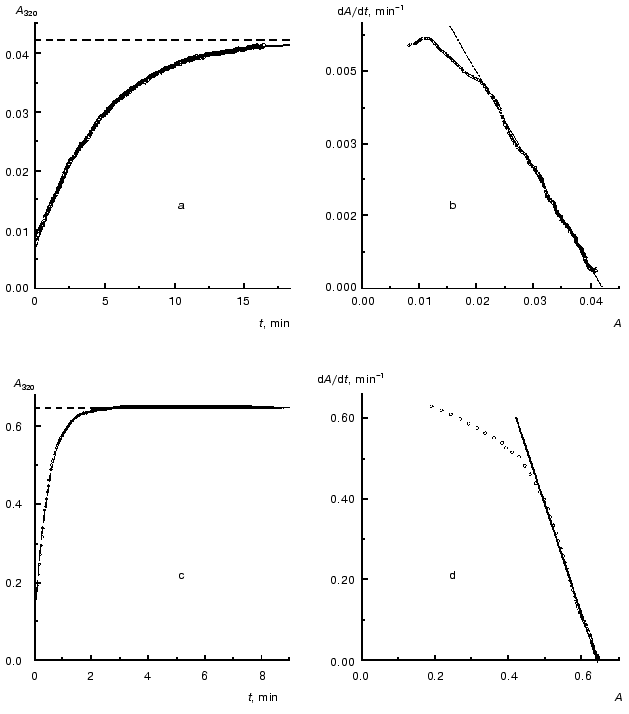
As an example, in Fig. 2 the kinetic curves obtained at concentrations of TMV CP equal to 0.02 and 0.30 mg/ml are analyzed. As can be seen from the figure, the dependences of A on t are satisfactorily described by Eq. (1). When the concentration of TMV CP is equal to 0.02 mg/ml, the application of Eq. (1) gives the following values of parameters: Alim = 0.0421 ± 0.0001, kI = 0.212 ± 0.001 min-1, and t0 = -0.77 ± 0.01 min (Fig. 2a). At [CP] = 0.30 mg/ml, the following values of parameters are obtained: Alim = 0.6458 ± 0.0002, kI = 2.10 ± 0.01 min-1, and t0 = -0.078 ± 0.005 min (Fig. 2c).
After differentiation of the dependences of A on t with the use of program Origin 5.0 we constructed the dA/dt versus A plots (Fig. 2, b and d). The linear character of the dependences of dA/dt on A corresponding to [CP] = 0.02 and 0.30 mg/ml at the A values higher that 0.02 and 0.5, respectively, lends support for the first order of aggregation with respect to protein.Fig. 2. Analysis of the kinetics of aggregation of TMV CP at the protein concentrations equal to 0.02 (a, b) and 0.30 mg/ml (c, d). Conditions: 52°C, 50 mM phosphate buffer, pH 8.0. a, c) The kinetic curves in coordinates {A; t}. Points are the experimental data. The solid curves are calculated from Eq. (1). The horizontal dotted lines correspond to the Alim values. b, d) The kinetic curves in coordinates {dA/dt; A}.
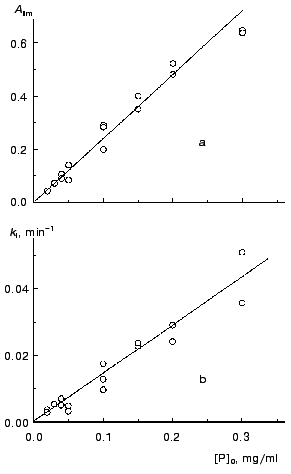
We calculated parameters Alim and kI for all the kinetic curves obtained at various concentrations of TMV CP (52°C) and then constructed the dependences of these parameters on the protein concentration (Fig. 3). The linear character of the dependence of Alim on the concentration of TMV CP (designated as [P]0; Fig. 3a) is consistent with the assumption about the proportionality between absorbance and the amount of the aggregated protein.
As can be seen from Fig. 3b, the kI value is a linear function of the concentration of TMV CP. Thus, the constant kI should be considered as a rate constant of pseudo-first order.Fig. 3. The dependences of parameters Alim (a) and kI (b) on the protein concentration, [P]0, for aggregation of TMV CP at 52°C (50 mM phosphate buffer, pH 8.0).
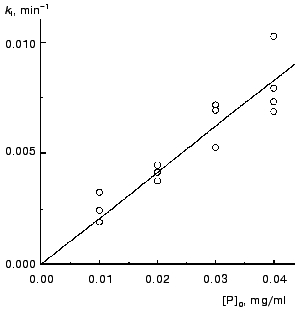
The kinetics of aggregation of TMV CP at 42°C. Aggregation of TMV CP at 42°C was studied in the range of the protein concentrations from 0.01 to 0.40 mg/ml (100 mM phosphate buffer, pH 8.0). Figure 4a shows the typical kinetic curves in coordinates {A/Alim; t}. Analysis of the shape of the kinetic curves obtained in the range of the MTV CP concentrations from 0.01 to 0.04 mg/ml testifies to the applicability of Eq. (1). As an example, Fig. 5 shows approximation of the kinetic curves obtained at the TMV CP concentrations equal to 0.01, 0.02, and 0.03 mg/ml by Eq. (1). At [P]0 = 0.01 mg/ml, the application of Eq. (1) for description of the dependence of A on t gives the following values of parameters: Alim = 0.02142 ± 0.00004, kI = 0.135 ± 0.001 min-1, and t0 = -0.68 ± 0.01 min. At [P]0 = 0.02 mg/ml, the following values of parameters are obtained: Alim = 0.05145 ± 0.00005, kI = 0.266 ± 0.001 min-1, and t0 = 0.128 ± 0.005 min. When the TMV CP concentration is equal to 0.03 mg/ml, the kinetic curve was described at the following values of parameters: Alim = 0.0813 ± 0.0001, kI = 0.314 ± 0.002 min-1, and t0 = 0.128 ± 0.007 min. The kI value is linear with the TMV CP concentration in the range of [P]0 from 0.01 to 0.04 mg/ml (Fig. 6). If the kinetic curves adhere to Eq. (1), the time of half-conversion (t1/2) may be calculated from the formula: t1/2 = ln2/kI. As TMV CP concentration increases in the range from 0.01 to 0.03 mg/ml, the t1/2 value decreases from 5.13 to 2.21 min.
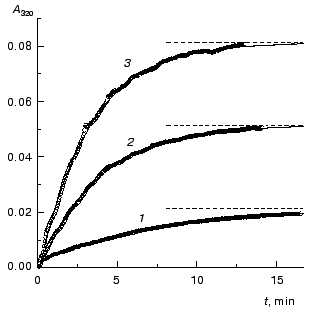
Fig. 4. The kinetics of aggregation of TMV CP at 42°C (100 mM phosphate buffer, pH 8.0). a) The kinetic curves in coordinates {A/Alim; t}. The protein concentration: 0.02 (1), 0.05 (2), 0.10 (3), 0.15 (4), 0.20 (5), 0.30 (6), and 0.40 mg/ml (7). b) The dependence of the time of half-conversion t1/2 on the protein concentration.
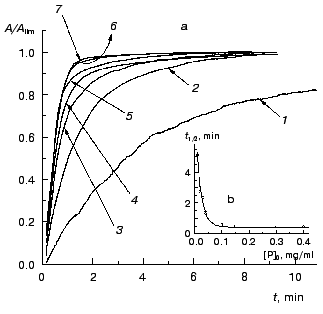
Fig. 5. Analysis of the kinetics of aggregation of TMV CP at 42°C (100 mM phosphate buffer, pH 8.0) in the region of low protein concentrations: 0.01 (1), 0.02 (2), and 0.03 mg/ml (3). Points are the experimental data. The solid curves are calculated from Eq. (1). The horizontal dotted lines correspond to the Alim values.
Thus, at rather low concentrations of TMV CP the rate of aggregation depends essentially on the protein concentration and goes down with decreasing the [P]0 value. It is worthy of note that the time of half-conversion approaches a limiting value as the TMV CP concentration increases (t1/2 = 0.44 min; Fig. 4b) and at sufficiently high values of [P]0 (in the region of 0.3-0.4 mg/ml) the kinetic curves fall on a common curve in coordinates {A/Alim; t}.Fig. 6. The dependence of the rate constant of the first order kI on the TMV CP concentration, [P]0, at 42°C.
Calorimetric investigations of denaturation of TMV CP. Denaturation of TMV CP was studied using differential scanning calorimetry. Figure 7 shows the excess heat capacity Cpex versus temperature profiles obtained for TMV CP in 50 and 100 mM phosphate buffer, pH 8.0. These profiles were analyzed using the mathematical approaches elaborated by us previously [8-10]. We have drawn a conclusion that for both concentrations of buffer protein denaturation is not described by a simple one-step scheme N --> D (N and D are the native and denatured states of the protein molecule). However, based on data obtained, we can make qualitative estimates of the rates of denaturation. In the case of 50 mM phosphate buffer Cpex reaches a maximum value at temperature equal to 40.9°C. “High-temperature” region of the dependence of Cpex on temperature corresponds to the slowest stages of unfolding of the protein molecule or denaturation of the most stable fraction of the protein preparation. Assume that denaturation in this temperature region proceeds as a monomolecular reaction P --> U, which is characterized by the rate constant of the first order k (P is the initial or partially unfolded state of the protein and U is the completely unfolded state of the protein). Temperature dependence of the rate constant k is assumed to obey the Arrhenius equation:
where Ea is the activation energy, T is absolute temperature, and T* is absolute temperature at which k = 1 min-1. We calculated parameters Ea and T* from the experimental dependence of Cpex on temperature shown in Fig. 7 (curve 1). For this purpose we used the region of temperatures higher than 40°C. The experimental data were described on the basis of the system of differential equations:
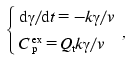 (4)
(4)where gamma is the portion of the form P, v is the scanning rate, and Qt is heat absorbed during protein denaturation. Program Scientist was used in such calculations, as described previously [8]. The following values of parameters of the Arrhenius equation were obtained: Ea = 660 ± 5 kJ/mol and T* = 314.36 ± 0.01 K. With these values of parameters it is easy to show that at 52°C (this temperature was used in the aggregation experiments in 50 mM phosphate buffer) even after 0.1 sec the degree of conversion of P into U is equal to 0.999. Thus, by the point in time at which the registration of TMV CP aggregation was started at 52°C (10 sec) all the protein turns into the completely unfolded state.
In the aggregation experiments carried out in 100 mM phosphate buffer the excess heat capacity Cpex reaches a maximum value at 42.5°C (Fig. 7, curve 2). It is clear that at 42°C (this temperature was used in the aggregation experiments in 100 mM phosphate buffer) the rate of aggregation is comparable with the rate of protein denaturation. To confirm such a conclusion, let us try to estimate of the time of half-conversion for denaturation at 42°C. For this purpose we used the formula proposed by Sanchez-Ruiz [11] for calculation of the rate constant k on the assumption that denaturation proceeds as an irreversible monomolecular reaction:Fig. 7. The temperature profiles of excess heat capacity Cpex for TMV CP (1 mg/ml). The scanning rate, 1°C/min. The phosphate buffer concentration: 50 (1) and 100 mM (2).
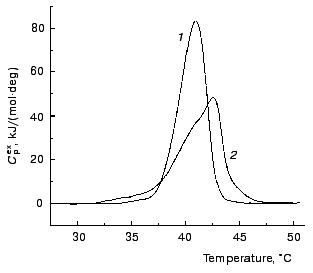
where Q is heat absorbed by the time of the attainment of a certain temperature (in our case 42°C). The value of k determined in such a way was found to be 0.49 min-1. Thus, the time of half-conversion (t1/2 = ln2/k) for the process of denaturation calculated from the DSC data on the assumption that denaturation follows the first order kinetics is equal to 1.41 min. This value of t1/2 and the value of t1/2 determined from the kinetic curves of aggregation at sufficiently high protein concentrations (t1/2 = 0.44 min) are the magnitudes of the same order.
DISCUSSION
In the present paper thermal aggregation was first studied in a wide range of the protein concentrations using TMV CP as a model protein. For both temperatures used (42 and 52°C) the terminal phase of aggregation at relatively low protein concentrations follows the first order kinetics. However the rate constant of the first order is a function of the protein concentration and linear with [P]0.
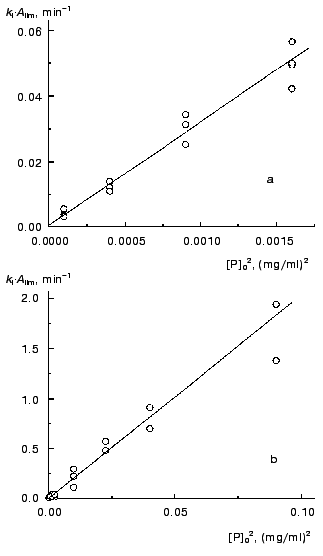
Previously [3] we proposed to use the kI*Alim product as a measure of the initial rate of aggregation in the case of fulfillment of the first order kinetics. Strictly speaking, this product corresponds to the rate of aggregation at the point with coordinates t = t0 and A = 0. Since both the Alim value and the kI value are directly proportional to the protein concentration, the initial rate of aggregation expressed as a kI*Alim product is proportional to the protein concentration squared. Data shown in Fig. 8 support this conclusion. It should be noted that the second (or close to second) order of aggregation with respect to protein calculated from the dependence of the initial rate of aggregation on the initial protein concentration was established experimentally for aggregation of lactate dehydrogenase from rabbit skeletal muscles during refolding of the enzyme denatured by guanidine hydrochloride ([12]; nc = 2.5 ± 0.1) and for aggregation of a mutant of a human anti-beta-galactosidase single chain antibody fragment scFv13R4c during refolding of the protein denatured by 7.5 M urea ([13]; nc = 2.0 ± 0.1).
Thus, in the region of applicability of the pseudo-first order kinetics aggregation proceeds as a bimolecular reaction. It is reasonable to stress once again that the order of aggregation with respect to protein (nc) calculated from the current values of the rate (i.e., from the kinetic curve) is equal to unity, whereas the nc value calculated from the dependence of the initial rate on the initial protein concentration is equal to 2.Fig. 8. The dependences of the kI*Alim product characterizing the initial rate of aggregation on the TMV CP concentration squared. Temperature: 42°C (a) and 52°C (b).
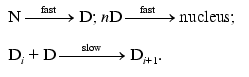
Consider the kinetic model that can explain the above-mentioned kinetic regularity of thermal aggregation. It is clear that a model where the rate-limiting stage of aggregation is the interaction of unfolded states of the protein molecule proceeding as a bimolecular reaction (as assumed in the theoretical work [14]) is unsuitable. The only model that is capable of explaining the difference in the values of the order of aggregation with respect to protein calculated from the kinetic curve, on the one hand, and from the dependence of the initial rate of aggregation on the initial protein concentration, on the other hand, is the model of protein association including the stage of the formation of a nucleus (a model of nucleation-dependent polymerization). The model was proposed by Oosawa and Kasai [15] and includes the following reversible stages: the stage of nucleation
(M is a monomer and Mn is a nucleus) and the stage of growth of aggregate
When discussing the applicability of such a model to thermal aggregation of TMV CP, we should take into account first of all that at 52°C all the protein turns into the denatured state by the point in time at which the registration of TMV CP aggregation was started (10 sec). In other words, we can consider the stage of denaturation N --> D as being fully completed. As for 42°C, such a conclusion is valid only for a region of relatively low protein concentrations (0.01-0.04 mg/ml) where the rate of aggregation in sufficiently low.
Thus, monomer M in reactions (6) and (7) refers to the denatured form D. Aggregation of TMV CP is an irreversible process. This is evident from the fact that the dilution of aggregated protein is not accompanied by the breakdown of aggregates (aggregation was followed by monitoring the change in the absorbance).
Furthermore, assume that the stage of nucleation is reversible. Combination of the reversible stage of nucleation and the irreversible stage of growth of aggregate cannot provide the first order of aggregation with respect to monomer D. We made this conclusion on the basis of analysis of the kinetic scheme involving reversible stages of nucleation and growth of aggregate [16] (when analyzing this kinetic scheme, the rate constant for breakdown of the associate Mi+1 in the corresponding equations was set equal to zero).
To explain the first order of aggregation with respect to protein on examination of the kinetic curves of aggregation, we should assume that, firstly, the stage of nucleation is irreversible and proceeds very rapidly in comparison with the rate of the stage of growth of aggregate and, secondly, the concentration of nuclei remains constant in the course of aggregation.
The scheme of aggregation of denatured molecules being proposed in the present paper includes the stage of nucleation
(D is a monomer, R is a nucleus) and the stage of growth of aggregate
(R´ is a nucleus containing an additional molecule of D). kIImacro refers to the macroscopic rate constant of the second order.
Generally the nucleus R contains several points of growth (i.e., the sites where an attachment of monomer D occurs). Let Omega be the point of growth of aggregate and j be the number of the points of growth in the nucleus R. If [R] is a molar concentration of nuclei, the molar concentration of the points of growth will be j[R]. The condition of constancy of the concentration of nuclei is equivalent to the condition of the indestructibility of the points of growth and their constancy in the course of aggregation:
where kIImicro is the microscopic rate constant of the second order. The following relationship between the microscopic and macroscopic rate constants of the second order is fulfilled: kIImacro = jkIImicro.
The rate of aggregation expressed as a reduction in the concentration of monomer D has the following form:
 (11)
(11)In this expression kI is the rate constant of pseudo-first order: kI = kIImacro[R] = kIImicro[Omega].
In the event that the experimentally determined rate constant of the first order kI is a linear function of the protein concentration, the concentration of nuclei [R] (or the concentration of the points of growth [Omega]) is directly proportional to [P]0.
In the region of relatively low concentrations of TMV CP the rate-limiting stage of aggregation is the stage of growth of aggregate. The initial rate of unfolding of the protein molecule is proportional to the first power of the protein concentration, whereas the initial rate of aggregation is proportional to [P]02. Therefore one can expect that at sufficiently high concentrations of the protein the rate-limiting stage of aggregation will be the stage of protein denaturation. Actually, at 42°C the time of half-conversion for the kinetic curves of aggregation of TMV CP approaches a limiting value with increasing protein concentration (Fig. 4b) and the dependences of A/Alim on t fall on a common curve (Fig. 4a). By this is meant that the rate-limiting stage of aggregation is not a bimolecular reaction (in the case of bimolecular reaction the time of half-conversion is reciprocally proportional to the initial protein concentration). It is evident that in the region of sufficiently high protein concentrations the rate-limiting stage of aggregation is the stage of protein molecule unfolding.
Analysis of the terminal phase of the kinetic curves obtained at relatively high concentrations of TMV CP (0.3-0.4 mg/ml; 42°C) shows that in this case the simple exponential law, namely Eq. (1), is not fulfilled. The reason is that the mechanism of denaturation is rather complex. Actually, it is impossible to describe the temperature profiles of the excess heat capacity by the one-step mechanism of the type N --> D. However, when thermal denaturation proceeds as a one-step irreversible reaction, one can expect that in the region of relatively high protein concentrations aggregation will follow the first order kinetics. Previously [3] we analyzed the data on the kinetics of thermal aggregation and denaturation of the catalytic subunit of protein kinase CK2 (CK2alpha) presented in [17]. The results of analysis show that the first order rate constant calculated from the terminal phase of aggregation of CK2alpha is close to the rate constant of inactivation of the enzyme. It is highly probable that the rate-limiting stage of aggregation is the stage of protein denaturation proceeding as a monomolecular irreversible reaction N --> D. It is worthy to note that to substantiate this conclusion we should have experimental data demonstrating the constancy of the first order rate constant calculated from the kinetic curves of aggregation at variation of the protein concentration (strictly speaking, in a definite interval of the values of [P]0).
Based on the experimental data on the kinetics of aggregation of TMV CP we can make a conclusion that the kinetic mechanism of aggregation is changed with variation of the protein concentration. By convention three regions of the protein concentration may be specified.
The region of relatively low protein concentrations. At sufficiently low protein concentrations the rate-limiting stage of aggregation is the stage of growth of aggregate from initial nuclei, the concentration of the latter remaining constant in the course of aggregation. The terminal phase of aggregation follows the first order kinetics and the kI value is a linear function of the protein concentration. The initial rate of aggregation expressed as a kI*Alim product is proportional to [P]02. The kinetic scheme of aggregation has the following shape:
 (12)
(12)The region of relatively high protein concentrations. At sufficiently high protein concentrations the rate-limiting stage of aggregation is the stage of protein molecule unfolding. If unfolding proceeds as an irreversible monomolecular reaction, the terminal phase of aggregation follows the first order kinetics and the kI value remains constant at variation of the protein concentration. The initial rate of aggregation expressed as a kI*Alim product is proportional to [P]0. The kinetic scheme of aggregation has the following shape:
The circumstance that thermal aggregation (at the terminal phase) follows the first order kinetics at relatively low or relatively high protein concentrations (in the latter case provided that thermal denaturation is an one-step process) explains why the kinetics of thermal aggregation are described, as a rule, by the exponential law [3].
The region of intermediate protein concentrations. In this region of the values of [P]0 the situation is realized when the rate of protein molecule unfolding is comparable with the rate of aggregation of denatured molecules. In this case it is beyond reason to hope that aggregation will follow the first order kinetics. Previously [18] we used the mechanism of aggregation involving the stage of irreversible denaturation, the stage of nucleation, and the stage of growth of aggregate (provided that the rates of protein molecule unfolding and growth of aggregate are comparable) for analysis of the initial parts of the kinetic curves of thermal aggregation of proteins. It was shown that after the completion of the stage of nucleation the kinetics of aggregation follows the law: A ~ t2 (or dA/dt ~ t).
The kinetic regime of aggregation depends not only on the protein concentration, but also on the conditions of the experiment (temperature, ionic strength, pH, viscosity of the medium). The change in the conditions may result in the change in the kinetic regime of aggregation. For instance, our experimental data show that at TMV CP concentration equal to 0.3 mg/ml rise in temperature from 42 to 52°C results in the change in the kinetic regime of aggregation: at 42°C the rate-limiting stage of aggregation is the stage of protein molecule unfolding, whereas at 52°C the rate-limiting stage of aggregation is the stage of growth of aggregate.
In conclusion, it is worthy to note that to characterize the activity of molecular chaperones the test-systems based on prevention of aggregation of protein substrates are used. It is evident that the interpretation of the results of action of chaperones in such systems requires an understanding of the mechanism of aggregation of the protein substrate used. Thus, the ideas regarding the kinetic mechanism of thermal aggregation of proteins proposed in the present work may be used for the study of the function of molecular chaperones.
The study was funded by the Russian Foundation for Basic Research (grants 02-04-48704, 02-04-48842, 02-04-39007, and 00-15-97787).
REFERENCES
1.Butler, P. J. G. (1986) J. Gen. Virol.,
65, 253-279.
2.Orlov, V. N., Arutyunyan, A. M., Kust, S. V.,
Litmanovich, E. A., Drachev, V. A., and Dobrov, E. N. (2001)
Biochemistry (Moscow), 66, 154-162.
3.Kurganov, B. I. (2002) Biochemistry
(Moscow), 67, 492-507.
4.Dobrov, E. N., Abu-Eid, M. M., Solovyev, A. G.,
Kust, S. V., and Novikov, V. K. (1997) J. Protein Chem.,
16, 27-36.
5.Fraenkel-Conrat, H. (1957) Virology,
1, 1-4.
6.Dobrov, E. N., Kust, S. V., Yakovleva, O. A., and
Tikhonenko, T. I. (1977) Biochim. Biophys. Acta, 475,
623-637.
7.Eronina, T. B., Chebotareva, N. A., Livanova, N.
B., and Kurganov, B. I. (2001) Biochemistry (Moscow),66,
449-455.
8.Kurganov, B. I., Lyubarev, A. E., Sanchez-Ruiz, J.
M., and Shnyrov, V. L. (1997) Biophys. Chem., 69,
125-135.
9.Lyubarev, A. E., and Kurganov, B. I. (2000) J.
Thermal Analysis Calorimetry, 62, 51-62.
10.Lyubarev, A. E., and Kurganov, B. I. (2000)
Uspekhi Biol. Khim., 40, 43-84.
11.Sanchez-Ruiz, J. M., Lopéz-Lacomba, J. L.,
Cortijo, M., and Mateo, P. L. (1988) Biochemistry, 27,
1648-1652.
12.Zettlmeissl, G., Rudolph, R., and Jaenicke, R.
(1979) Biochemistry, 18, 5567-5571.
13.Martineau, P., and Betton, J.-M. (1999) J.
Mol. Biol., 292, 921-929.
14.Kiefhaber, T., Rudolph, R., Kohler, H.-H., and
Buchner, J. (1991) Bio/Technology, 9, 825-829.
15.Oosawa, F., and Kasai, M. (1962) J. Mol.
Biol., 4, 10-21.
16.Inouye, H., and Kirschner, D. A. (2000) J.
Struct. Biol., 130, 123-129.
17.Roher, N., Miré, F., Boldyreff, B.,
Llorens, F., Plana, M., Issinger, O.-G., and Itarte, E. (2001) Eur.
J. Biochem., 268, 429-436.
18.Kurganov, B. I. (1998) Biochemistry
(Moscow), 63, 364-366.