Comparative Analysis of Proteome Maps of Helicobacter pylori Clinical Isolates
V. M. Govorun1,2*, S. A. Moshkovskii1, O. V. Tikhonova1, E. I. Goufman1, M. V. Serebryakova1, K. T. Momynaliev2, P. G. Lokhov1, E. V. Khryapova1, L. V. Kudryavtseva2, O. V. Smirnova2, I. Yu. Toropyguine1, B. I. Maksimov1, and A. I. Archakov1
1Orekhovich Institute of Biomedical Chemistry, Russian Academy of Medical Sciences, Pogodinskaya ul. 10, Moscow, 119121 Russia; fax: (095) 245-0857; E-mail: proteomics@ibmh.msk.su2Institute of Physico-Chemical Medicine, Russian Federation Ministry of Public Health, ul. M. Pirogovskaya 1a, Moscow, 119992 Russia; fax: (095) 246-4311; E-mail: govorun@hotmail.ru
* To whom correspondence should be addressed.
Received May 27, 2002
The gram-negative bacterium Helicobacter pylori is found in human gastric mucosa. A widely distributed H. pylori infection is associated with chronic gastritis, gastric and duodenal ulcers, and malignant neoplasms. In this study proteome maps of four H. pylori clinical isolates derived from patients of two Russian regions (Moscow/Moscow Region and Novosibirsk) were obtained using 2D-electrophoresis and MALDI-TOF-mass-spectrometry. Variability of some H. pylori proteins and the level of their expression have been evaluated. These four isolates could be easily subdivided into two equal groups characterized by the close proteome profiles and the isolate from Moscow Region and the isolate from Novosibirsk constituted one group. The present study demonstrates the potential of proteome technology, which can be employed together with genome and transcriptome studies for the multiparameter typing of clinical isolates of pathogenic microorganisms.
KEY WORDS: proteomics, two-dimensional (2D) electrophoresis, mass-spectrometry, Helicobacter pylori, clinical isolate
The existence of bacteria on human gastric mucosa was originally reported at the end of XIX century [1]. However, only in 1983 did researchers successfully cultivated new Gram-negative bacilli isolated from gastric mucosal epithelium of patients with chronic gastritis [2]. The new microorganism was named Helicobacter pylori.
Initially H. pylori infection lacks clinical manifestations, but it is the cause of chronic inflammation that is responsible for subsequent development of chronic gastritis and gastric and duodenal ulcers. Certain evidence also exists that H. pylori infection is associated with the development of such malignant neoplasms as extranodal B-cell MALT-lymphoma and gastric adenocarcinoma [3]. Based on results of clinical studies the World Health Organization has assigned H. pylori as a group of apparent carcinogens [4]. However, the existence of a direct relationship between carcinogenesis and H. pylori infection is still subject to discussion [5].
Epidemiological studies demonstrate that H. pylori infection is one of the most distributed infections in the world. Infectivity of the adult population in the world varies from 20 to 100% [6, 7].
The genomes of two strains of H. pylori (26695 and J99) have been sequenced [8, 9]. The genome of H. pylori contains about 1600 genes. Use of DNA array technology revealed variability of H. pylori genome in various clinical isolates [10]. The list of variable genes includes genes encoding enzymes of restriction/modification, transposases, surface antigens, and some specific H. pylori proteins of unknown functions [10]. It was also demonstrated that the genome of H. pylori may loose some genes during long-term persistence of this microorganism in the patient; and this probably explains the ability of H. pylori cells to accumulate external genetic material [11]. Genotyping of H. pylori revealed differences in pathogenicity genes, particularly related to the cag pathogenicity island, and cagA (cag26) is the marker gene of this island. The presence of this gene is attributed to the increased ability of particular H. pylori strain to induce inflammatory process on gastro-intestinal tract mucosa [12]. The protein product of the cagA gene is transported to the host mucosal cells and influences their metabolism [13].
Information accumulated during genomic studies of H. pylori allowed the use of proteomic technologies in studies of this microbe. A generally accepted approach for proteome analysis employs solubilization of proteins and their separation by two dimensional (2D) electrophoresis followed by subsequent identification using various mass-spectrometry methods. This approach was already used for proteomic mapping of H. pylori strains with known genome [1]. In this paper the authors identified products of 126 individual genes. Recently 2D-electrophoretic proteome map of H. pylori NCTC 11637 strain (the first clinical control strain isolated from a patient in 1982) was obtained and 35 major proteins were identified and possible post-translational modifications of some of them were analyzed [14].
The comparison of 2D-electrophoretic maps of H. pylori strains 26695 and J99 revealed certain differences in positions of protein spots in the gel. These differences were mainly related to protein products of homologous genes which were characterized by different pI values. This comparison of proteome maps was made using control (reference) strains of different origin, which were maintained for a long time in libraries [1].
In the present study we have compared 2D-electrophoretic proteome maps of clinical isolates obtained from two regions of the Russian Federation, Moscow/Moscow Region and Novosibirsk. This allowed the evaluation of variability of the most abundant H. pylori proteins and the level of their expression.
MATERIALS AND METHODS
Characterization of clinical isolates. Helicobacter pylori strains were isolated from biopsy material of gastric antral mucosa, which was obtained from patients from Moscow (isolates 8 and 46), Moscow Region (isolate 37), and Novosibirsk (isolate 36). The patients had duodenal ulcers and chronic gastritis.
Sample preparation and protein separation. Helicobacter pylori strains were cultivated on Petri dishes containing serum agar at 37°C for two days under microaerobic atmosphere (5% O2, 85% N2, 10% CO2). Bacteria were harvested, washed twice in ice-cold phosphate saline buffer (50 mM sodium phosphate, 0.15 M sodium chloride, pH 7.2) containing protease inhibitors, and lysed as described previously [1]. Protein content was determined by the method of Lowry et al. [15].
The resulting samples were solubilized with 9 M urea, 4% CHAPS (3-[(3-cholamidopropyl)dimethylammonio]-1-propane sulfonate) (w/v), 0.2% Triton X-100 (v/v), and 100 mM dithiothreitol and sonicated using a Soniprep 150 disintegrator (UK). The sonication procedure included five pulses of 1 sec at 4°C (at frequency and amplitude of 50 kHz and 30 µm, respectively). The sonicated sample was centrifuged at 12,000g for 15 min, and after addition of 0.2% Ampholine pH 3-10 (w/v) (Amersham, Sweden) the resulting supernatant was used in subsequent experiments.
2D-electrophoresis was carried out using a Protean IEF Cell for protein isoelectrofocusing and Protean II xi Cell (Bio-Rad, USA).
In the case of subsequent sample staining with silver the separation in the first dimension was carried out by isoelectrofocusing in glass tubes (Bio-Rad; inner and outer diameters of 1.5 and 4 mm, respectively). The length of gel was 17 cm and the amount of the applied sample did not exceed 50 µg of protein per tube. Before sample application the tubes for isoelectrofocusing were filled with 4.5% polyacrylamide gel, containing 8 M urea, 4% CHAPS, 3.6% Ampholine pH 5-8 (w/v), 1.2% Ampholine pH 3-10 (w/v), and 0.5% Triton X-100 (v/v). The isoelectrofocusing was initially carried out at 250 V for 1 h, then at 450 V for 2 h, and finally at 950 V to a total of 14,000 V*h.
In the case of subsequent staining with Coomassie brilliant blue R-250 isoelectrofocusing was carried out using IPG strips, pH 4-10 (Bio-Rad). The strips were prepared according to recommendations of the supplier. The sample was solubilized as for silver staining and the amount of applied protein did not exceed 500 µg per strip. The isoelectrofocusing was initially carried out at 250 V for 15 min, then for 5 h using liner voltage increase up to 10,000 V and then during 6 h at 10,000 V to a total of 100,000 V*h.
After isoelectrofocusing tubes or strips were incubated for 30 min in 0.125 M Tris-buffer, pH 6.8, containing 6 M urea, glycerol (300 g/liter), and SDS (20 g/liter).
For the separation of proteins in the second dimension we used 9-16% vertical gradient gel prepared using a standard protocol [16]. The size of gels used for all kinds of staining was 0.15 × 20 × 20 cm.
Silver staining with sodium thiosulfate and staining with Coomassie brilliant blue R-250 were carried out as described in [17] and [18], respectively.
Treatment of gels, trypsinolysis, and protein extraction were carried out according to standard protocols [19] with minor modifications.
Gel fragments (~3 mm3) were excised from the protein spots stained with Coomassie or silver. Each fragment was washed in 150 µl of 50 mM NH4HCO3 in 30% acetonitrile (v/v) for 45 min at room temperature with shaking. The supernatant was discarded and gel fragments were dried using a centrifuge evaporator RC 1010 (Jouan, France). Each gel fragment was treated at 4°C with 7 µl of modified porcine trypsin (6.25 ng/µl) (Promega, USA) in 20 mM NH4HCO3 and after incubation at this temperature for 45 min it was incubated overnight at 37°C. After the trypsinolysis gel fragments were dried down using the centrifuge evaporator. For removal of buffer salts the fragments were washed with 20 µl of deionized water and dried down again. Peptides were extracted with 20 µl of 0.1% (v/v) trifluoroacetic acid in deionized water at room temperature for 20 min with shaking. Supernatant was collected in separate tubes. Extraction was repeated by incubating the gel fragments with 20 µl of 0.1% trifluoroacetic acid in 50% acetonitrile at room temperature for 40 min. Corresponding supernatants were pooled and concentrated to final volume 1-2 µl using the centrifuge evaporator. These samples diluted to 5 µl with 0.1% trifluoroacetic acid in 50% acetonitrile were then used for mass-spectrometry analysis.
Mass analysis by time-of-flight matrix-assisted laser desorption-ionization (MALDI-TOF). The sample (0.2-1 µl) was mixed on the matrix with equal volume of 2,5-dihydrobenzoic acid (Sigma, USA) solution (20 mg/ml) in 20% acetonitrile and 0.1% trifluoroacetic acid and dried down under air. In other cases the sample (0.2-1 µl) was applied onto the matrix and after immediate addition of equal volume of saturated solution of alpha-cyano-4-hydroxycinnamic acid (Sigma) in 80% acetonitrile and 0.1% trifluoroacetic acid dried down under air. Before use alpha-cyano-4-hydroxycinnamic acid was recrystallized twice from methanol.
Mass-spectra were obtained using MALDI-TOF Reflex III mass spectrometer (Bruker, USA) with UV-laser (336 nm) (the mode of positive ions in the range of masses from 500 to 8000 daltons). Mass-spectra were calibrated using known masses of internal standards. Proteins were identified by the sets of proteolytic peptide masses using Peptide Fingerprint option of Mascot software (Matrix Science, USA). The accuracy of MH+ mass determination was 0.01% and possible modification of cysteine residues by acrylamide and methionine oxidation were taken into consideration. Search employed databases of US National Center for Biotechnological Information (http://www.ncbi.nlm.nih.gov) containing complete genomes of H. pylori strains 26695 [8] and J99 [9].
Genotyping of the cag26 (cagA) pathogenicity island. DNA isolation from clinical isolates H. pylori 8, 36, 37, and 46 and determination of H. pylori was carried out using Khelikopol II kits (Litekh, Russia).
For genotyping of cag26 (cagA) pathogenicity island previously described primers were used [20, 21]. The reaction mixture (30 µl) contained 1 µg H. pylori DNA, 50 mM KCl, 10 mM Tris-HCl, pH 8.8 (at 25°C), 1.5 mM MgCl2, 0.08% Nonidet P-40, 200 µM deoxynucleoside triphosphates (each) (Fermentas, Lithuania), 20 pM primers (each), and 2.5 U Taq DNA polymerase (Fermentas). Polymerase chain reaction for cagA typing included denaturation at 94°C for 5 min, 1 min at 94°C, 1 min at 52°C, 2 min at 72°C (35 cycles in total), and then 5 min at 72°C using amplifier GeneAmp PCR System 2400 (Perkin-Elmer, USA).
The amplification products were separated in 2% agarose gel (containing 0.5 µg ethidium bromide) using single TAE buffer (0.04 M Tris-acetate, 2 mM sodium EDTA). The results were documented by means of a GelDoc 1000 video system (Bio-Rad) and treated using Molecular Analyst Software (Bio-Rad).
RESULTS AND DISCUSSION
Using 2D-electrophoresis we obtained proteome maps of four clinical isolates of H. pylori (8, 36, 37, 46) (Figs. 1-4). For each isolate at least three 2D-electrophoregrams were obtained. Using MALDI-TOF mass spectrometry of tryptic peptides we have analyzed about 500 protein spots of these maps and identified products of 105 individual genes (data not shown). The electrophoregrams obtained corresponded to previously published proteome maps of H. pylori by architectonic of spot intensity of proteins characterized by the highest level of expression (ureA and ureB urease subunits, tsaA alkylhydroperoxide reductase, thioredoxin, etc.) [1].
Fig. 1. Proteome map of Helicobacter pylori clinical isolate 36. The 2D-electrophoregram was stained with silver. Abscissa and ordinate show isoelectrofocusing and SDS-electrophoresis in polyacrylamide gel, respectively. Proteins corresponding to spot numbers are given in the table. Molecular masses (in kD) are given on the left.
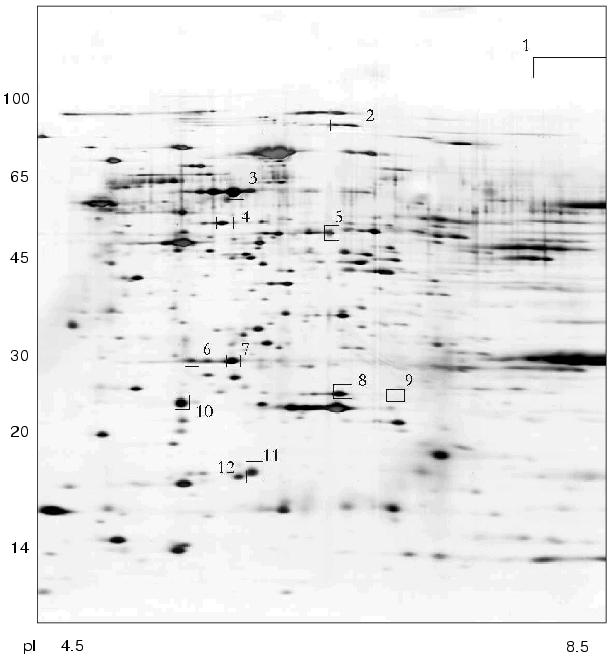
Fig. 2. Proteome map of Helicobacter pylori clinical isolate 37. The 2D-electrophoregram was stained with silver. Abscissa and ordinate show isoelectrofocusing and SDS-electrophoresis in polyacrylamide gel, respectively. Proteins corresponding to spot numbers are given in the table. Molecular masses (in kD) are given on the left.
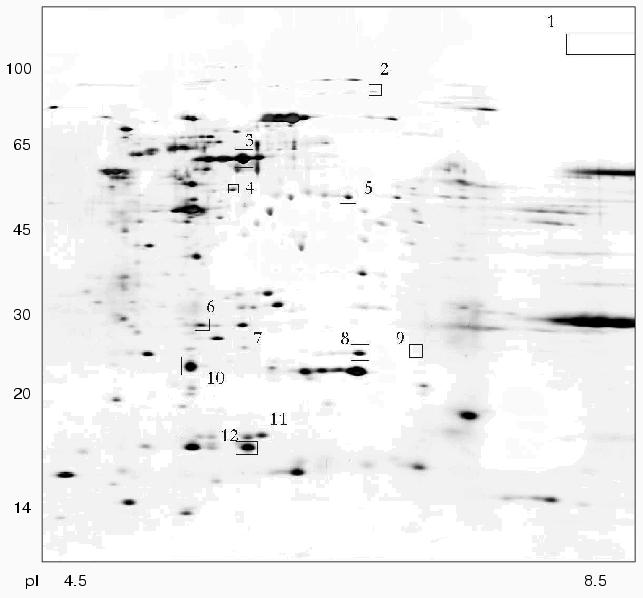
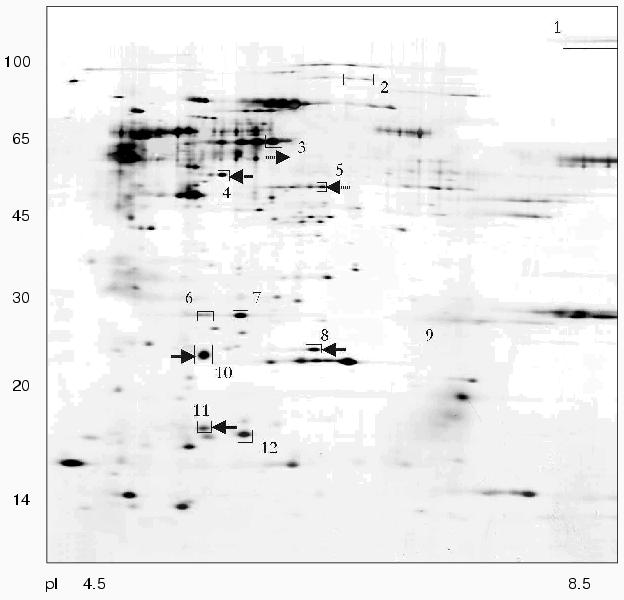
Fig. 3. Proteome map of Helicobacter pylori clinical isolate 8. The 2D-electrophoregram was stained with silver. Abscissa and ordinate show isoelectrofocusing and SDS-electrophoresis in polyacrylamide gel, respectively. Proteins corresponding to spot numbers are given in the table. Molecular masses (in kD) are given on the left. Arrows show changes in pI values for the isolated protein spots versus the referent proteome map of isolate 36.
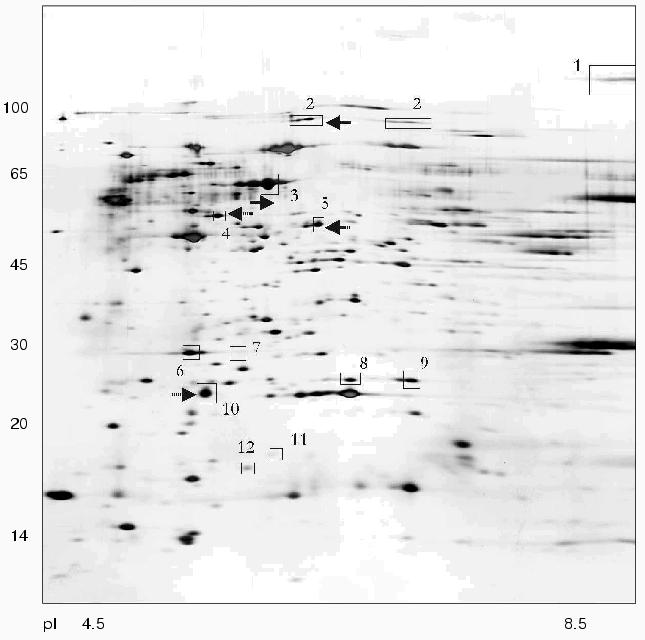
There were proteins with different behavior on the proteome maps of the clinical isolates. Some proteins listed in the table were characterized by different pI values. These changes may be attributed to possible single amino acid substitutions and/or posttranslational modifications. The differences in pI values were found for housekeeper proteins (groEL and tig chaperones), enzymes involved in free radical and hydrogen peroxide catabolism (sodF, tagD), and cell wall lipoprotein component (omp18).Fig. 4. Proteome map of Helicobacter pylori clinical isolate 46. The 2D-electrophoregram was stained with silver. Abscissa and ordinate show isoelectrofocusing and SDS-electrophoresis in polyacrylamide gel, respectively. Proteins corresponding to spot numbers are given in the table. Molecular masses (in kD) are given on the left. Arrows show changes in pI values for the isolated protein spots versus the referent proteome map of isolate 36.
Identified differences in proteome maps of four clinical isolates of
Helicobacter pylori
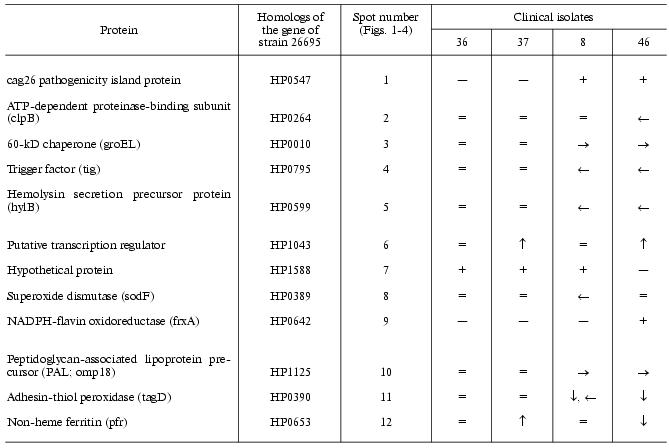
Note: Changes in pI values are given using isolate 36 as the
reference. Symbols “-->” or “<--” show marked
shift into alkaline or acidic regions, respectively. Symbols
“+” or “-” show the presence or absence of
corresponding protein spot on the proteome map, respectively. Symbols
“”, “v”, and “.” show
increased or reduced protein expression or approximate similarity
versus the referent isolate (36), respectively.
Some proteins varied in expression level. Spots corresponding to cag26 pathogenicity factor were absent on the proteome maps of H. pylori isolates 36 and 37. In contrast to all the other proteome maps the electrophoregram of isolate 46 lacks the spot corresponding to hypothetical protein HP1588, but there was the spot corresponding to frxA reductase. The presence or absence of some protein spots on 2D-electrophoregrams may be attributed to repression of particular protein or to complete loss of the corresponding gene from the genome [10].
To elucidate possible reasons for repression of cag26 (cagA), we investigated genotyping of the strains by means of polymerase chain reaction with respect to this gene. The analysis revealed the presence of cag26 (and consequently, the whole pathogenicity island cag-PAI) in strains 8 and 46 and its absence in strains 36 and 37. Thus, lack of cag26 protein spots on these proteome maps is related to genetic variability rather than transcription and posttranslation regulation.
These clinical isolates of H. pylori can be subdivided into two groups (Figs. 1-4, table). Besides lack of cag26 pathogenicity factor, strains 36 and 37 also share similarity in the majority of other proteins spots (Figs. 1 and 2). The main differences between these strains consist of levels of expression of putative transcription regulator HP1043 and non-heme ferritin.
The cag-positive isolates 8 and 46 also share some similarity. Using strain 36 as the reference they are characterized by the same changes in pI values of such major proteins as groEL, tig, hylB, and omp18 (table). It is possible that groEL and tig related to chaperones undergo combined changes [22].
Interestingly, subdivision of the four isolates into the two groups does not correspond to their geographic distribution. The stains characterized by the highest similarity by their proteome maps are related to Moscow Region (37) and Novosibirsk (36). It is possible that within the distribution area several H. pylori variants requiring taxonomic classification exist.
The proteome technology including protein separation by 2D-electrophoresis followed by mass-spectrometry identification has been used in the present study as the example of multiparameter typing of clinical isolates of the pathogenic bacterium. The present study demonstrates a possible approach for evaluation of proteome map variability and the data obtained may supplement results of genome and transcriptome typing. Combined employment of these three modes of molecular typing with respect to clinically important objects (i.e., database compiling) promotes the development of adequate methods of medical treatment and vaccination. The results of this study may be employed for compiling of extended database of proteome maps of clinical isolates of H. pylori from the main regions of the Russian Federation.
This work was supported by the program “Proteomics in Medicine” from the Ministry of Industry, Science, and Technology of the Russian Federation.
The authors are grateful to V. T. Ivashkin (Sechenov Moscow Medical Academy), V. A. Isakov (MONIKI, Moscow Region), and S. A. Kurilovich (Novosibirsk) for kind supply of this study with the biopsy material of human gastric mucosa.
REFERENCES
1.Jungblut, P. R., Bumann, D., Haas, G., Zimny-Arndt,
U., Holland, P., Lamer, S., Siejak, F., Aebischer, A., and Meyer, T. F.
(2000) Mol. Microbiol., 36, 710-725.
2.Marshall, B. J., and Warren, J. R. (1984)
Lancet, 1, 1311-1315.
3.El-Omar, E. M., Chow, W. H., and Rabkin, C. S.
(2001) Gastroenterology, 121, 1002-1004.
4.Merabishvili, V. M. (2001) Prakt. Onkol.,
3, 3-8.
5.Haas, G., Karaali, G., Ebermayer, K., Metzger, W.
G., Lamer, S., Zimny-Arndt, U., Diescher, S., Goebel, U. B., Vogt, K.,
Roznowski, A. B., Wiedenmann, B. J., Meyer, T. F., Aebischer, T., and
Jungblut, P. R. (2002) Proteomics, 2, 313-324.
6.Scherbakov, P. L. (1999) in Helicobacter pylori:
Revolution in Gastroenterology (Ivashkin, V. T., Megro, F., and
Lapina, T. L., eds.) [in Russian], Triada, Moscow, pp. 14-20.
7.Poundeyr, R. E., and Ng, D. (1995) Aliment.
Pharmacol. Ther., 9 (Suppl. 2), 33-39.
8.Tomb, J. F., White, O., Kerlavage, A. R., Clayton,
R. A., Sutton, G. G., Fleischmann, R. D., Ketchum, K. A., Klenk, H. P.,
Gill, S., Dougherty, B. A., Nelson, K., Quackenbush, J., Zhou, L.,
Kirkness, E. F., Peterson, S., Loftus, B., Richardson, D., Dodson, R.,
Khalak, H. G., Glodek, A., McKenney, K., Fitzegerald, L. M., Lee, N.,
Adams, M. D., Hickey, E. K., Berg, D. E., Gocayne, J. D., Utterback, T.
R., Peterson, J. D., Kelley, J. M., Karp, P. D., Smith, H. O., Fraser,
C. M., and Venter, J. C. (1997) Nature, 388, 539-547.
9.Alm, R. A., Ling, L. S., Moir, D. T., King, B. L.,
Brown, E. D., Doig, P. C., Smith, D. R., Noonan, B., Guild, B. C.,
deJonge, B. L., Carmel, G., Tummino, P. J., Caruso, A., Uria-Nickelsen,
M., Mills, D. M., Ives, C., Gibson, R., Merberg, D., Mills, S. D.,
Jiang, Q., Taylor, D. E., Vovis, G. F., and Trust, T. J. (1999)
Nature, 397, 176-180.
10.Salama, N., Guillemin, K., McDaniel, T. K.,
Sherlock, G., Tompkins, L., and Falkow, S. (2000) Proc. Natl. Acad.
Sci. USA, 97, 14668-14673.
11.Israel, D. A., Salama, N., Krishna, U., Rieger,
U. M., Atherton, J. C., Falkow, S., and Peek, R. M., Jr. (2001)
Proc. Natl. Acad. Sci. USA, 98, 14625-14630.
12.Israel, D. A., Salama, N., Arnold, C. N., Moss,
S. F., Ando, T., Wirth, H. P., Tham, K. T., Camorlinga, M., Blaser, M.
J., Falkow, S., and Peek, R. M., Jr. (2001) J. Clin. Invest.,
107, 611-620.
13.Keates, S., Keates, A. C., Warny, M., Peek, R.
M., Jr., Murray, P. G., and Kelly, C. P. (1999) J. Immunol.,
163, 5552-5559.
14.Lock, R. A., Cordwell, S. J., Coombs, G. W.,
Walsh, B. J., and Forbes, G. M. (2001) Pathology, 33,
365-374.
15.Lowry, O. H., Rosebrough, N. J., Farr, A. L., and
Randall, R. J. (1951) J. Biol. Chem., 193, 265-275.
16.Goerg, A., and Weiss, W. (1999) in 2-D
Proteome Analysis Protocols. Methods in Molecular Biology (Link, A.
J., ed.), Vol. 112,Humana Press, Totowa, New Jersey, pp. 235-244.
17.Blum, H., Beier, H., and Gross, H. J. (1987)
Electrophoresis, 8, 93-99.
18.Neuhoff, V., Arold, N., Taube, D., and Ehrhardt,
W. (1988) Electrophoresis, 9, 255-262.
19.Shevchenko, A., Wilm, M., Vorm, O., and Mann, M.
(1996) Analyt. Chem., 68, 850-858.
20.Van Doorn, L. J., Figueiredo, C., Sanna, R.,
Plaisier, A., Schneeberger, P., deBoer, W., and Qoit, W. (1998)
Gastroenterology, 115, 58-66.
21.Van Doorn, L. J., Henskens, Y., Nouhan, N., and
Verschuuren, A. (2000) J. Clin. Microbiol., 38,
13-17.
22.Deuerling, E., Schulze-Specking, A., Tomoyasu,
T., Mogk, A., and Bukau, B. (1999) Nature, 400,
693-696.