Effects of Human Presenilin 1 Isoforms on Proliferation and Survival of Rat Pheochromocytoma Cell Line PC12
I. V. Bobrysheva1,2#*, A. P. Grigorenko1,2#, E. V. Novosadova1, N. R. Kal'ina1, E. L. Arsenyeva1, I. A. Grivennikov1, V. Z. Tarantul1, and E. I. Rogaev2
1Institute of Molecular Genetics, Russian Academy of Sciences, pl. Kurchatova 2, Moscow 123182, Russia; fax: (095) 196-0221; E-mail: irinab@img.ras.ru2Mental Health Research Center, Russian Academy of Medical Sciences, Zagorodnoe Shosse 2/2, Moscow 113152, Russia; fax: (095) 952-8940; E-mail: rogaev@dol.ru
# These authors contributed equally to this work.
* To whom correspondence should be addressed.
Received January 9, 2003; Revision received February 13, 2003
Missense mutations in human presenilin 1 gene (hPS1) cause an autosomal dominant, early onset form of Alzheimer's disease (AD). To study effects of mutant presenilin on processes of cell growth, differentiation, and susceptibility to apoptotic signals, we produced a series of rat pheochromocytoma PC12 poly- and monoclonal cell lines stably expressing wild type hPS1 and hPS1 with mutations in amino (N-) and carboxyl (C-) terminal regions of the PS1 protein. Employing a heterologous rat PC12 cell system, we demonstrated that: 1) AD mutations inhibit, in part, processing of hPS1 holoprotein; 2) negative selection against highly expressed hPS1 may occur in polyclonal cell cultures; 3) expression of N-terminus mutant (M146V) hPS1 increases susceptibility to apoptosis in differentiated neuronal PC12 cells under deprivation conditions; 4) monoclones with hPS1 C-terminal AD mutation (C410Y) have lower proliferation rates than monoclones expressing wild type hPS1 under deprivation conditions and during NGF-induced neuronal differentiation. The data demonstrate deleterious effect of PS1 AD mutations. The effect depends on the level of expression of the hPS1 isoforms, the number of passages, and trophic and differentiation conditions used for growing PC12 cells.
KEY WORDS: Alzheimer's disease, human presenilin 1 gene, stably transfected cell lines, PC12 cells, proliferation, neuronal differentiation, apoptosis
Alzheimer's disease (AD) is a frequent neurodegenerative human disorder in the middle- and old-aged population. The main histopathological hallmark of AD is the accumulation of senile plaques and intracellular neurofibrillar tangles, accompanied by a massive death of neurons in brain neocortex structures.
The early-onset familial forms (up to 10% of all AD cases) are characterized by the onset of disease under 65 years of age, rapid progression, and the autosomal dominant inheritance of mutations in three genes, namely, the beta-amyloid precursor protein (APP), presenilin 1 (hPS1/PSEN1 [1, 2]) and presenilin 2 (hPS2/PSEN2 [3]) genes. Mutations in the hPS1 gene may be responsible for over 60-75% of cases of the early familial forms of AD.
It remains to be elucidated how mutations, particularly those in the hPS1 and hPS2 genes, trigger the cascade mechanisms leading to AD hallmarks and neurodegeneration. According to the most widely accepted hypotheses, the mutations may affect the intramembrane proteolysis specificity of the amyloid precursor protein (APP), increasing the Ab42/Ab40 ratio [4]. Other pathogenic effects of PS mutations include cellular homeostasis disturbance (destabilized calcium exchange, oxidative stress, dysfunction of mitochondria, etc.) and also increased cell sensitivity to apoptosis- or necrosis-evoking factors [5, 6].
To study apoptosis in vitro as one of the putative critical events of AD pathogenesis, cell lines transfected with various (normal and mutant) forms of genes for AD have been employed. Expression of the APP gene, both with and without AD-mutations, sensitizes mammalian cells to apoptosis in transfected cell lines [7, 8]. Increased vulnerability of cultured cells to different apoptotic stimuli (deprivation, oxidative stress, beta-amyloid) was shown in cultures with hyperexpression of mutant forms of the hPS1 gene and wild type or mutant forms of the hPS2 gene, but these data are still controversial [5, 6, 9-12].
In previous studies [12], we analyzed the effect of different hPS1 gene forms on the viability of stably transfected rat pheochromocytoma line PC12 cells exposed to apoptotic stimuli, such as trophic starvation (deprivation) and oxidative stress (H2O2). Cells expressing an hPS1 point mutations in exon 12 (C410Y) demonstrated increased sensibility to the apoptotic signals as compared with cultures with no transgenes or transfected by the hPS1 normal isoform (wt). To elucidate further the effect of the PS mutations on cell proliferation, differentiation, and apoptotic processes, we generated additional cell lines with hPS1 gene isoforms carrying mutations in the amino- and carboxy-terminal regions of PS1 protein (M146V, C410Y).
We discuss here the possibility of using the cellular systems with AD mutant genes which negatively regulate cell proliferation as a model for screening potential factors and drug compounds modulating deleterious effects of mutant genes involved in AD.
MATERIALS AND METHODS
Cells and cultivation methods. Rat pheochromocytoma PC12 cells [13] were used in this study. The cells were incubated at 37°C, 5% CO2 in RPMI-1640 media (ICN, USA) with addition of 15% fetal bovine serum (ICN) and 80 µg/ml of gentamicin. Human embryonic kidney cells HEK293 were cultivated in DMEM media (GibcoBRL, USA) containing 10% fetal bovine serum (GibcoBRL), 1% penicillin/streptomycin.
Plasmids. pcDNA3 vector (Invitrogen, USA) and different PS1 isoforms (cDNA insertions) cloned into this vector: 1) pcPS1wt (wild type hPS1); 2) pcPS1M146V (with mutation in exon 6, leading to the substitution of methionine for valine at position 146) (kindly provided by F. Checler); and 3) pcPS1C410Y (with mutation in exon 12, leading to the substitution of cytosine for tyrosine at position 410) were used in this study. Plasmid DNA was isolated from transformed in E. coli XLI-Blue cells using QIAGEN (USA) columns. Plasmid DNA was precipitated and sterilely diluted in Milli-Q H2O to the final concentration of 2 µg/µl.
Plasmid expressing N-terminal fragment of the hPS1 protein (aa 1-93) were constructed by cloning of PCR product corresponding to N-terminus 1-93 aa into pQE vector (QIAGEN).
Production of polyclonal antibodies to hPS1. The N-terminal hPS1 peptide (aa 1-93) was overexpressed in E. coli cells, purified, and used to immunize rabbits. The first immunization was conducted in complete Freund's adjuvant, and the subsequent ones in incomplete Freund's adjuvant. Rabbits weighing 2-3 kg were immunized in popliteal and armpit lymph nodes, the dose per animal being 1 mg. The first three immunizations were made at weekly intervals, and the fourth immunization was performed after a month. The blood for serum production was collected on the 7th, 9th, and 11th days following the last immunization. The coarse fraction of IgG was obtained by salting out in Na2SO4 with subsequent dialysis in 0.2 M borate buffer, pH 8.0. The titer of antibodies, calculated by the solid state IPA method, was 100 ng/ml.
Transfection of mammalian cells. PC12 cells were electroporated using a SUM4 electroporation device (Institute of Molecular Biology, Russian Academy of Sciences) under the following experimentally established parameters: impulse duration 1.5 msec; power 450 W. Plasmid DNA (10 µg) was used for transfection of 1*106 cells. Electroporation was carried out in buffer containing 20 mM HEPES, 137 mM KCl, 4 mM NaCl, 1 mM MgCl2, 0.4% Ficoll 400, pH 7.2. After electroporation cells were plated in standard cultured media for further selection. Transient transfection of HEK293 cells was performed using lipofectamine (LipofectAMINE Reagent, GibcoBRL).
Production of hPS1-transfected polyclonal cultures and clones of individual origin. After electroporation, PC12 cells were plated both for the production of polyclonal cultures (25*104 per 60-mm plate in 5 ml of standard media) and for isolation of individual clones (103 cells per well of a 96-well plate in 100 µl of standard media). Selection was started on the second day after plating by addition of G418 into the cultural media to the final concentration of 0.5 mg/ml. Selective medium was changed every 3-4 days. Polyclonal cultures of each transfection variant were collected on the 14-16th day of selection as a total pool of G418-resistant clones. Independent individual clones of transfectants were isolated only from those wells in which single colonies had resulted from the selection.
Polymerase chain reaction. The presence of transgene in cells was verified by PCR. Genomic DNA from the transfected cell cultures was isolated by standard methods [14]. PCR was conducted using primers 5´-CTCCAGCAGGCATATC-3´, 5´-ACCTCGTCCCTCAAATCTG-3´ to the cDNA fragment of hPS1 gene (1007 bp).
Isolation of protein homogenates from mammalian cells. Protein homogenates were isolated from transfected and control cells. Mammalian cells (5*106) were mechanically removed from the plates and precipitated by centrifugation for 5 min at 1000 rpm. The pellet was washed two times in 7 ml of PBS buffer (137 mM NaCl, 2.7 mM KCl, 1.5 mM KH2PO4, 8 mM Na2SO4, pH 7.2) with subsequent centrifugation (5 min, 1000 rpm), resuspended in 75 µl RIPA-buffer (10 mM Tris-HCl, pH 7.4, 150 mM NaCl, 1 mM EDTA), containing protease inhibitors (1 mM benzamidine, 50 µg/ml PMSF, 1 µg/ml aprotinin) per 106 cells, and lysed three times by freezing-defreezing. For the mechanical destruction of membranes, cellular lysates were passed through a Hamilton microsyringe needle, in 25 µl (per 106 cells) of RIPA buffer containing detergents added to the final concentration of 0.1% sodium dodecyl sulfate (SDS), 1% Triton X-100, and 1% sodium deoxycholate, and incubated at 4°C overnight. The tube with homogenate was centrifuged at 4°C for 1 h at 14,000 rpm. The supernatant was transferred into a clean tube and stored at -70°C. The amount of total protein in cellular homogenates was determined by Peterson's modification of the Lowry method [15] using BSA (Sigma, USA) as a standard.
Protein electrophoresis in polyacrylamide gel. Electrophoretic separation was performed according to Laemmli [16] in a gradient polyacrylamide gel (5-12%) using 1.5 M Tris-HCl buffer, pH 8.8, for the concentrating gel and 0.5 M Tris-HCl buffer, pH 6.8, for the separating gel in the presence of SDS. Each lane contained 30 µg of protein. The Standard Protein Low Molecular Weight Calibration Kit (Pharmacia, Sweden) was used as a molecular mass marker.
Western blotting. After electrophoretic separation, proteins were transferred on a Hybond ECL nitrocellulose membrane (Amersham, England) using a Bio-Rad blotting unit at 0.8 mA/cm2 for 90 min. Polyclonal antibodies against the N-terminal part of hPS1 (aa 1-93) were used for detection of protein bands on the nitrocellulose membrane. Antibodies against rabbit IgG conjugated with horseradish peroxidase (Amersham) were used as secondary antibodies. Complexes were visualized using ECL kit (Amersham).
Analysis of cell differentiation. For induction of neuronal differentiation by neuronal growth factor (NGF), cells of each line were plated in a media containing 1% fetal bovine serum and 100 ng/ml NGF, 2*103 cells per well of a 96-well plate, and 12.5*103 cells per well of a 24-well plate. Every three days NGF was added to the culture media to 100 ng/ml concentration.
Analysis of mammalian cell proliferation. The rates of dead and alive cells were determined by evaluation of their number calculated by the optical density values after addition of MTT (3-(4,5-dimethylthiazolyl-2)-2,5-diphenyl-tetrazolium bromide), the vital reagent showing tropity to the mitochondria of alive cells [17]. To establish the growth characteristics, cells were plated 2*103 cells per well of 96-well plate and 12.5*103 cells per well of 24-well plate. Cells were incubated in 0.1 mg/ml MTT for 4 h and lysed for 3 h. For each sample optical density was measured in 3-4 wells at OD 600 nm and cell number was determined according to a calibration curve.
Analysis of apoptosis in transfected cultures. In apoptosis experiments, cells from each culture were plated on cover glasses. Visualization of apoptosis was performed by staining with DNA-binding fluorescent dye Hoechst 33258. Cells were counted on three or four glasses in five random fields of each glass at ×400 magnification. Cells were considered as apoptotic if their nuclei were compressed or markedly fragmentized.
RESULTS AND DISCUSSION
Generation of PC12 cell lines stably expressing different hPS1 gene variants. Transfected cell cultures of the rat pheochromocytoma PC12 cell line were employed to conduct this study. The PC12 cell line provides a convenient and widely-used model to study neuronal differentiation and cell death processes, since these cells acquire a neuron-like phenotype under the influence of nerve growth factor (NGF) added to the culture medium.
In the initial stage, the electroporation method was employed to transfect the PC12 cells with the pcDNA3 vector as a control and PS1 genes cloned into this vector: pcPS1wt (carrying an insertion of cDNA of hPS1 gene wild type isoform) and pcPS1C410Y (carrying an insertion of cDNA of hPS1 gene mutant C410Y isoform), and, in the next series of experiments, pcPS1M146V (with an insertion of cDNA of hPS1 gene mutant M146V). cDNA insertions of the presenilin isoforms (pcPS1wt and pcPS1C410Y) contained the most extended 5´- and 3´-untranslated regions (UTR) and differed in the 5´-UTR from previously used constructions [2].
The hPS1 point mutations C410Y and M146V are characterized by autosomal dominant inheritance and induce the aggressive early-onset familial AD form [1, 18]. The choice of the mutations to be used in this study was also determined by the position of amino acid substitutions in N- and C-terminal regions of the protein.
In follow up transfection and subsequent selection for resistance to antibiotic G418 (all the recombinant plasmids carried the resistance gene to neomycin, neor), four polyclonal cultures were generated, namely, K-poly (transfection by pcDNA3 vector), wt-poly (by pcPS1wt), C410Y-poly (by pcPS1C410Y), and M146V-poly (by pcPS1M146V).
Each polyclonal culture represented a total pool of 300 to 400 G418-resistant clones. In parallel to the isolation of polyclonal cultures, 10 to 20 individual clones of independent origin were selected for each transfection variant. The independence of origin of the clones was ensured by an experimentally established strategy of plating and selection of transfected cells (see “Materials and Methods”).
The PCR analysis of the cell cultures and clones showed that, in each transfection variant, the polyclonal cultures and about 75-80% of G418-resistant clones contained human PS1 gene cDNA insertions. The PCR-positive cultures and clones were analyzed further for the expression of the protein product. Polyclonal antibodies which we generated against the hPS1 protein N-terminal region were used for Western blot analysis (see “Materials and Methods”). The PS1 467-amino-acid product is predicted to be a polytopic membrane protein with at least 8 hydrophobic transmembrane domains, hydrophilic N- and C-terminal ends, and a loop oriented, according to one of the models, towards the cytoplasm [19]. The 43-45 kD hPS1 holoprotein undergoes endoproteolysis within the hydrophilic loop and is present in the cell in the form of two main fragments: the 27-28 kD N-terminal and the 16-18 kD C-terminal [20].
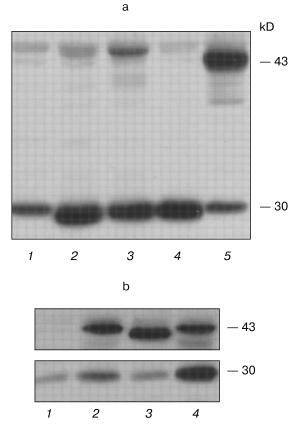
Western analysis detected the 43-45 kD isoform corresponding to the exogenous human PS1 non-processed protein (holoprotein) in the polyclonal cultures wt-poly, C410Y-poly, and M146V-poly. In contrast, the control K-poly cells had no PS1 holoprotein product detectable by immunoblot. These data demonstrate complete and rapid processing of endogenous PS1 in PC12 cells as shown for other mammalian cells. PS1 holoproteins, both wild type and mutant isoforms, also undergo extensive endoproteolytic cleavage in the hydrophilic loop region. However, exogenous mutant presenilin, especially the isoform with the C410Y mutation, was processed with less efficiency than the wild type. These results were confirmed in at least six independent experiments and also in experiments using transient transfection in another cell type, HEK293 (Fig. 1). A 30 kD form of endogenous rat presenilin is also clearly detected in all cultures, as the homology degree of rat and human presenilins is approximately 96% and the AB raised against human PS1 detect also the rat PS1 (Fig. 1).
Apoptosis and mutant presenilins in polyclonal cell cultures. Proliferative activity of the K-poly, wt-poly, C410Y-poly, and M146V-poly polyclonal cell cultures growing in different medium conditions (in standard medium with 15% serum, with lowered (1%) serum, or under conditions inducing differentiation) was similar and with no statistically significant differences in cell growth rate (data not shown). It is noteworthy that all experiments for analyzing the proliferation of cultured PC12 cells were performed using the MTT method. Using this method, we failed to demonstrate any differences between the polyclonal cultures in their susceptibility to the apoptotic stimulus (data not shown). The MTT method is based on the capacity of the MTT added to cultural medium transformed in insoluble form by mitochondrial succinate dehydrogenase in living cells. The subsequent lysis of the cells and the evaluation of optical density of the lysates using calibration analysis allow the determination of the number of viable cells as the number of cells with retained mitochondrial enzymes. By this approach, the number of living cells can be determined. In apoptosis studies, this method generally underestimates the rate of cell death in comparison with cytological methods assessing nuclei fragmentation and condensation typical for apoptosis. This method may detect apoptotic cells as being normal and viable, since in contrast to necrotic cells, the membranes may remain intact in apoptotic cells and the activity of respiratory chain enzymes retained in the fragmented membrane formations. Thus, we stained the nuclear DNA by the fluorescent dye Hoechst 33258.Fig. 1. Western blot analysis of hPS1-transfected cell cultures. a) Polyclonal stably transfected rat PC12 cells: 1) K-poly (transfection with control vector pcDNA3); 2) M146V-poly (transfection with pcPS1-M146V plasmid); 3) C410Y-poly (transfection with pcPS1-C410Y plasmid); 4) wt-poly (transfection with pcPS1-wt plasmid). b) Human HEK293 cells transiently transfected with: 1) control vector pcDNA3; 2) pcPS1-C410Y plasmid; 4) pcPS1-wt plasmid. The molecular masses of marker proteins are shown in kD. PC12 cells expressing stably transfected spliced isoform of hPS1 (Delta9) that does not undergo endoproteolysis were taken as a control: a) lane 5; b) lane 3.
Analysis of the K-poly, wt-poly, and M146V-polyclonal cell cultures demonstrated increased susceptibility of M146V cells to deprivation conditions (low serum or serum-free media). A statistically significant difference in the number of apoptotic cells in M146V-poly cultures as compared to controls was demonstrated by the Hoechst method (Fig. 2). We also showed increased vulnerability of cells expressing the hPS1-C410Y to apoptotic signals in cells undergoing early passages [12]. In later passages, we found no apoptotic effect in the polyclonal culture C410Y-poly. This might be explained by the negative selection of the cells highly expressing the mutant gene to the advantage of the cells not expressing or expressing PS1C410Y at low levels. Such selection is possible, as polyclonal cultures represent a heterogenous (as showed by analysis of transgene expression) population of cells.
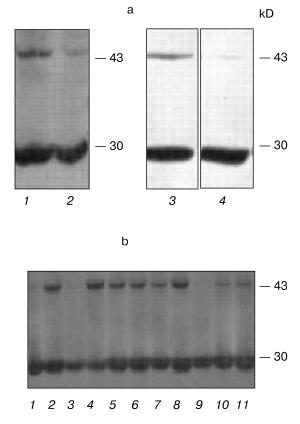
Indeed, we showed that, according to the PCR-analysis and Northern-hybridization data, approximately 40% of polyclonal culture clones resistant to the G418 antibiotic did not express exogenous hPS1 protein. In addition, the Western hybridization demonstrated that the expression of the holoprotein (non-processed PS1 isoform) may be decreased in the cultured cells at later passages. As shown in Fig. 3a, the expression of the exogenous hPS1 in polyclonal cell cultures is considerably decreased in cells passing over the 10th passage. These results provide an indirect indication of the negative effect of over-expressed PS1 isoforms on cell viability.Fig. 2. Effect of hPS1M146V mutation on susceptibility of neuronally differentiated PC12 cells to apoptotic factors: 1) K-poly (transfection with pcDNA3 control vector); 2) wt-poly (transfection with pcPS1-wt plasmid); 3) M146V-poly (transfection with pcPS1-M146V plasmid). Control variants (standard cultivation conditions) are shown in white, variants with deprivation in gray. The histogram shows standard deviations from the average values of the trait (n > 3).
Mutations and overexpression of the hPS1 holoprotein decrease the proliferative activity of monoclonal PC12 cell cultures. Due to the dependence of the PS expression and induced deleterious effects on the number of passages of polyclonal cells, we produced a series of monoclonal cultures for each of the PS isoforms and control plasmids. Expression studies of exogenous hPS1 in monoclonal cultures showed that, unlike polyclonal cultures, they are able to retain the high expression level of the transgene up to the 20th passage (Fig. 3b). This may explain the differences in proliferative activity of poly- and monoclonal cultures observed in our experiments. For instance, clear differences in proliferation of cells with the mutant PS1 isoforms and the control cells were observed for independent monoclones. Under deprivation conditions (with serum content lowered to 1% or NGF withdrawal) the mutant hPS1-C410Y-transfected cells showed delayed growth and lower proliferative activity (Fig. 4, a-c) as compared to wild type hPS1-transfected cells, K-poly cells transfected with mock plasmid, and control culture PC12.Fig. 3. Western analysis of hPS1-transfected cultures and clones. a) Comparison of hPS1 expression in polyclonal cultures of early and late passages: 1) wt-poly, 3rd passage; 2) wt-poly, 9th passage; 3) C410Y-poly, 3rd passage; 4) C410Y-poly, 9th passage. b) hPS1 expression in monoclonal cultures of late passages (10-20th): 1) K-poly control culture; 2-7) monoclonal cultures transfected with C410Y mutant isoform; 8-11) monoclonal cultures transfected with hPS1 wt. The molecular masses of marker proteins are shown in kD.
Next, we selected and studied the clones (identified by immunoblot analysis) with stable but varying levels of hPS1 expression. The proliferation rate of differentiated cells in media supplemented with NGF depended on the level of PS1 protein product expression. As showed in the histogram (Fig. 5, a and b), the hyperexpression of the non-processed wild-type 43 kD hPS1 (clone dN-F4) holoprotein inhibited cell growth as compared to the control culture (K-poly). The mutant hPS1-C410Y (clone M1-D5), even with a lower expression than the PS1 wild type, exerts a stronger negative action on cell proliferation. The increase of holoprotein expression level (M1-E5 clone) causes a further decrease in the rate of cell growth.Fig. 4. Cell growth dynamics in monoclonal cultures transfected with different hPS1 isoforms: a, b) on a medium with lower serum content (1%); c) on a medium with 1% serum and 100 ng/ml NGF leading to neuronal differentiation. Cultures: 1) non-transfected PC12 cells; 2) K-poly (transfected with control vector pcDNA3); 3) dN-F4 (transfected with pcPS1-wt plasmid); 4) M1-E5; 5) M2-E4 (transfected with pcPS1-C410Y plasmid). The graphs show standard deviations from the average values of the trait.
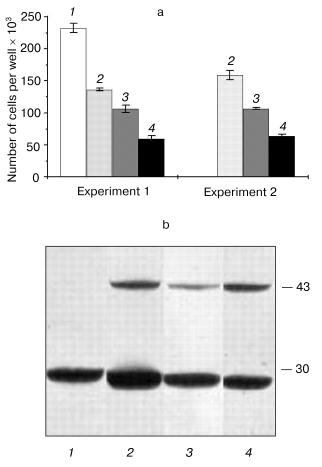
Thus, we selected PC12 clones expressing human hPS1 mutant isoforms (C410Y, M146V) which show an increased apoptotic response to apoptotic signals and a decreased level of cell proliferative activity. These PS1 mutations inhibit in part processing of PS1 holoprotein and may have deleterious effect on PC12 cell growth.Fig. 5. Dependence of cell proliferation level on the level of hPS1 holoprotein product. a) Number of monoclonal culture cells on the 6th day of cultivation under neuronal differentiation conditions: 1) K-poly (transfection with control vector pcDNA3); 2) dN-F4 (transfection with pcPS1-wt plasmid); 3) M1-D5 (transfection with pcPS1-C410Y plasmid); 4) M1-E5 (transfection with pcPS1-C410Y plasmid) (n > 3); b) Western blot analysis of hPS1 expression in monoclonal cultures using antibodies against N-terminal part of the protein. The molecular masses of marker proteins are shown in kD.
These hPS1-transfected cell cultures may be used to further search for genes and proteins interacting with PS functions, and as a model system, to search and test molecular factors modulating AD pathogenesis.
This work was supported by the Russian Foundation for Basic Research, INTAS, HHMI, Inco-Copernicus grants, and by the Program for Fundamental Research “Fundamental Studies in Medicine” of the Russian Academy of Sciences Presidium.
REFERENCES
1.Sherrington, R., Rogaev, E. I., Liang, Y., Rogaeva,
E. A., Levesque, G., Ikeda, M., Chi, H., Lin, C., Li, G., Holman, K.,
Tsuda, T., Mar, L., Foncin, J. F., Bruni, A. C., Montesi, M. P., Sorbi,
S., Rainero, I., Pinessi, L., Nee, L., Chumakov, I., Pollen, D.,
Brookes, A., Sanseau, P., Pollinsky, R. L., Wasco, W., Da Silva, H. A.,
Haines, J. L., Pericak-Vance, M. A., Tanzi, R. E., Roses, A., Frazer,
P., Rommens, J., and St. George-Hyslop, P. (1995) Nature,
375, 754-760.
2.Levy-Lahad, E., Wasco, W., Poorkaj, P., Romano, D.
M., Oshima, J., Pettingell, W. H., Yu, C. E., Jondro, P. D., Schmidt,
S. D., and Wang, K. (1995) Science, 269, 973-977.
3.Rogaev, E. I., Sherrington, R., Rogaeva, E. A.,
Levesque, G., Ikeda, M., Liang, Y., Chi, H., Lin, C., Holman, K.,
Tsuda, T., Mar, L., Sorbi, S., Nacmias, B., Piacentim, S., Amaducci,
L., Chumakov, I., Cohen, D., Lannfelt, L., Fraser, P., Rommens, J., and
St. George-Hyslop, P. (1995) Nature, 376, 775-778.
4.Popesku, B. O., and Ankarcrona, M. (2000) J.
Cell Mol. Med., 4, 249-261.
5.Wolozin, B., Iwasaki, K., Vito, P., Ganjei, K.,
Lacana, E., Sunderland, T., Zhao, B., Kusiak, J., Wasco, W., and
D'Adamio, L. (1996) Science, 274, 1710-1713.
6.Guo, Q., Furukawa, K., Sopher, B., Pham, D., Xie,
J., Robinson, N., Martin, G., and Mattson, M. (1996)
Neuroreport, 8, 379-383.
7.Yamatsuji, T., Okamoto, T., Takeda, S., Murayama,
Y., Tanaka, N., and Nishimoto (1996) EMBO J., 15,
498-509.
8.Nishimura, I., Uetsuki, T., Dani, U., Ohsawa, Y.,
Saito, I., Okamura, H., Uchiyama, Y., and Yoshikawa, K. (1998) J.
Neurosci., 18, 2387-2398.
9.Guo, Q., Sopher, B., Furukawa, K., Pham, D.,
Robinson, N., Martin, G., and Mattson, M. (1997) J. Neurosci.,
17, 4212-4222.
10.Guo, Q., Robinson, N., and Mattson, M. (1998)
J. Biol. Chem., 273, 12341-12351.
11.Deng, G., Pike, C. J., and Cotman, C. W. (1996)
FEBS Lett., 397, 50-54.
12.Chernyavskaya, L., Grigorenko, A., Bobrysheva,
I., Kal'ina, N., Grivennikov, I., Tarantul, V., Fliss, G., Gulyaeva,
N., and Rogaev, E. (1998) Neirokhimiya, 15, 308-311.
13.Greene, L., and Tischer, A. (1976) Proc. Natl.
Acad. Sci. USA, 73, 24524-24528.
14.Maniatis, T., Fritsch, E. F., and Sambrook, J.
(1984) Molecular Cloning: A Laboratory Manual [Russian
translation], 2nd ed., Mir, Moscow.
15.Peterson, G. L. (1977) Analyt. Biochem.,
83, 346-356.
16.Laemmli, U. K. (1970) Nature, 227,
680-685.
17.Shearman, N., Ragan, C., and Iversen, L.
(1994) Proc. Natl. Acad. Sci. USA, 91, 370-373.
18.Alzheimer's Disease Collaborative Group (1995)
Nat. Genet., 11, 219-222.
19.Li, X., and Greenwald, I. (1998) Proc. Natl.
Acad. Sci. USA, 95, 7109-7114.
20.Thinakaran, G., Borchelt, D. R., Lee, M. K.,
Slunt, H. H., Spitzer, L., Kim, G., Ratovitsky, T., Davenport, F.,
Nordstedt, C., Seeger, M., Hardy, J., Levey, A. I., Gandy, S. E.,
Jenkins, N. A., Copeland, N. G., Price, D. L., and Sisodia, S. S.
(1996) Neuron, 17, 181-190.