
|
Epigenetic Changes and Repositioning Determine the Evolutionary Fate of Duplicated GenesS. N. Rodin, D. V. Parkhomchuk, and A. D. Riggs*Department of Theoretical Biology, Beckman Research Institute of the City of Hope, 1500 E. Duarte Road, Duarte, CA 91010, USA; fax: 626-930-5366; E-mail: ariggs@coh.org* To whom correspondence should be addressed.
|
Received December 4, 2004
Consideration of epigenetic silencing, perhaps by DNA methylation, led to an epigenetic complementation (EC) model for evolution by gene duplication (Rodin and Riggs (2003) J. Mol. Evol., 56, 718-729). This and subsequent work on genome-wide analyses of gene duplicates in several eukaryotic species pointed to a fundamental link between localization in the genome, epigenetic regulation of expression, and the evolutionary fate of new redundant gene copies, which can be either non- or neo-functionalization. Our main message in this report is that repositioning of a new duplicate to an ectopic site epigenetically alters its expression pattern, and concomitantly the rate and direction of mutations. Furthermore, comparison of syntenic vs. non-syntenic pairs of gene duplicates of different age unambiguously indicates that repositioning saves redundant gene duplicates from pseudogenization and hastens their evolution towards a new development-time and tissue-specific pattern of function.
KEY WORDS: DNA methylation, molecular evolution, comparative genomics, gene duplications, position effects, genetic complexity
Abbreviations: DDC) duplication-degeneration-complementation model; EC) epigenetic complementation model; LCR) locus control region of the human beta-globin gene cluster; Ne) effective (propagating) population size; GC content) frequency of guanine and cytosine; GC3) content of guanine and cytosine in 3rd codon position; G and R bands) Giemsa dark (GC-poor) and light (GC-rich) bands in chromosomes of warm-blooded vertebrates; sps) number of silent substitutions per site.
The enzymatic formation of 5-methylcytosine in DNA, studied since
pioneering work by Boris Vanyushin in the 1960s [1-3], is now known to be essential
for correct development of higher plants and animals. DNA methylation
was one of the first epigenetic mechanisms to be studied and the first
to be rather well understood at the molecular level [4-6]. Much evidence indicates that
DNA methylation plays several roles, including repetitive element
silencing and single-copy gene regulation, during both normal
development and cancer progression [7, 8]. Other epigenetic mechanisms, such as those
depending on histone methylation [9], are now being
elucidated, and it seems clear that there are several ways to
epigenetically silence genes. The hallmark feature of epigenetic
silencing is the stable and somatically heritable silencing of
expression without any permanent change in primary base sequence; thus
an epigenetically silenced gene is still potentially functional.
Certainly it can more easily revert to a functional state than can a
gene silenced by mutation.
Recently, we asked the question: Does DNA methylation have a role in evolution, especially evolution by gene duplication? The answer with regard to DNA methylation is not yet known, but we came to the conclusion [10] that epigenetic silencing indeed can play an important role in evolution, especially in those organisms with a small effective population size. In this paper we review and extend this epigenetic complementation (EC) model [10].
THE MAJOR PARADOX
The main source of evolutionary innovation is gene duplication. Extra gene copies originate by either whole genome doublings or by piecemeal gene duplications [11-15]. According to the classic scenario for creation of a new function (neo-functionalization) by gene duplication, one copy retains the original function and remains under strong surveillance by negative (purifying) selection, whereas its twin gene is free of selective constraints, so spontaneous mutations and positive selection may gradually shape it into a novel gene [15]. The problem with this idea is that natural selection overlooks deleterious mutations in the redundant copy. Any mutation, either deleterious or advantageous, in the new duplicate becomes neutral and may be spread in a population by neutral, stochastic drift (Fig. 1a). Deleterious mutations originate far more frequently than advantageous ones. Therefore, instead of neo-functionalization, almost all the time deleterious mutations will cause deterioration of the redundant gene into a functionless pseudogene and eventually into junk DNA.
The prediction of population genetic theory for a gene duplicate is clear and unambiguous: the result is pseudogenization [16-21]. Genome-wide studies of duplicate genes have supported this conclusion ([22, 23] and many others). What adds to this “loss-or-gain” dilemma even more is that it seems to be of much more importance for higher organisms such as mammals. Indeed, rigorous population genetic theory treatments [21, 24-26] confirm that the smaller the effective population size Ne, the more likely will be pseudogenization as opposed to the selective fixation of advantageous mutations. One thus faces a significant paradox [10]: higher organisms with complex, slow development have a relatively small Ne, but their complexity is presumably determined by new genes or/and regulatory elements generated by duplication.
Thus the vast majority of gene duplicates seem destined to become pseudogenes unless something else happens. Whatever it might be, this “something else” should bring a free-evolving gene copy under supervision of negative selection, and the earlier this takes place, the more likely is the duplicate to escape from mutational degradation. Our analysis of multigene families suggests how this might have happened.Fig. 1. Epigenetic complementation (EC) model for protection of new gene duplicates from mutational degradation to pseudogenes. For simplicity, the case of only two tissue/stage-specific gene duplicates is shown. These two are shown silenced (shaded boxes) in the stage (tissue)-differential manner. “X” denotes a degenerative mutation; *, an advantageous mutation. Selective values of the corresponding mutant alleles are indicated relative to the wild-type allele alpha0: neutral (s = 0), deleterious (s < 0), and advantageous (s > 0), respectively. a) Classic non- or neo-functionalization model where both gene duplicates have the same expression pattern. b) Model of epigenetic complementation. In spite of redundancy, the stage/tissue-complementary epigenetic silencing of duplicates exposes a degenerative mutation to negative selection (s < 0) in alleles alpha1 and alpha2; both are thereby eliminated from the population, making way for advantageous alleles alpha3 and alpha4. Otherwise, without complementary silencing, both these mutant alleles alpha1 and alpha2 are actually neutral (each has one functional gene copy) and can be fixed by random genetic drift. The detailed analysis of the model is described in [10].
MODELS FOR ESCAPING PSEUDOGENIZATION OF DUPLICATE GENES
Even though genes in a typical multigene family are descendents of duplication events, the risk of pseudogenization for them is negligibly small for a simple reason: each member of the family has a particular developmental period or tissue specificity of expression during which its evolutionarily old and young relatives are not expressed in the same tissues at the same time. That is, the individual expression patterns of the genes are not identical in developmental time and space; instead they complement each other, comprising en toto the integral expression pattern of the family.
Two major mechanistic models have been put forward for the origin of such complementation: mutational [24-26] and epigenetic [10]. The mutational DDC (duplication-degeneration-complementation) model involves degenerative mutations, but the mutated duplicates are protected from degradation by having these mutations affect not the coding region but different, independent regulatory elements responsible for stage/tissue-specific expression. Once overlapping expression in development-time and tissue has been alleviated due to such non-overlapping mutations in regulatory elements, the two duplicates avoid pseudogenization and can diverge and specialize to a further extent.
The EC (epigenetic complementation) model (Fig. 1b), on the other hand, involves stage/tissue-complementary epigenetic silencing of duplicates via methylation, heterochromatinization, homologous RNAi-mediated silencing [27], or other processes involving heritable chromatin structure [9], under the assumption that newly produced and structurally identical gene duplicates often will not be identical with respect to control by epigenetic mechanisms [10]. The duplication event itself might change expression of both gene copies, due to, for example, changing their distances from tissue/stage-specific regulatory sites. Complementary epigenetic events will save newly born duplicates from the evolutionarily rapid accumulation of deleterious mutations.
For example a typical case of EC would be when one duplicate retains the original expression pattern whereas its twin becomes activated at a novel stage(s) or/and in a novel tissue(s), thus providing conditions for neo-functionalization. Then eventually, with regard to the whole repertoire of tissues and stages of expression, these two genes will complement each other (Fig. 1b). Epigenetic complementation of this type seems to be a quite likely phenomenon. For example, epigenetic causal factors were suggested to be responsible for organ-specific silencing of duplicated genes that take place immediately after formation of cotton allotetraploids [28].
ADVANTAGE OF COMPLEMENTARY SILENCING OF DUPLICATES
A quantitative analysis of the models (Fig. 1) [10] revealed that (Fig. 2):
- in very small populations neutral drift prevails over selection pressure so that in both models, with and without epigenetic stage/tissue-complementary silencing of duplicates, pseudogenization is the most likely outcome;
- in very large populations, on the contrary, selection greatly dominates over random drift, thus making pseudogenization highly unlikely for both cases;
- the complementary silencing of duplicates does aid and notably accelerates their functional divergence in relatively small populations (in the range 1 < Nes < 100);
- this advantage is in reverse dependence on rho (the gene-specific ratio of adaptive to degenerative mutations); the rarer is an adaptive mutation among degenerative ones, the larger is the beneficial effect of epigenetic stage/tissue-complementary silencing of duplicates, thus clearly pointing to the protective role of this mechanism against pseudogenization.
The EC-mediated escape of pseudogenization is predicted to be more common in higher organisms with complex, slow development and small effective population size Ne. This correlation is observed for DNA methylation [29]. Furthermore, the EC model predicts a more efficient functional expansion of multigene families in organisms with small Ne and methylated genomes. Again, our genome-wide study confirmed the prediction [10]. Another important attribute of the EC mechanism, re-positioning effects, is described below.Fig. 2. The effect of complementary silencing on the probability Uf that a duplicated gene fixes an advantageous (rather than a degenerative) allele as a function of 4Nes. Ne is the effective population size and s is the selection factor. For simplicity, the selective disadvantage of deleterious mutations is assumed to be equal in its absolute value, |s|, to the selective advantage of adaptive mutations. Represented in the top panel are the probability Uf for the classic (Fig. 1a) and the EC (Fig. 1b) models. The corresponding ratio Uf (1b)/Uf (1a) is shown in the bottom panel. Within the range of relatively small Nes, this ratio notably decreases with rho, the gene-specific ratio of adaptive to degenerative mutations (the two cases shown are for rho = 0.01 and 0.1). For more details see [10].
RE-POSITIONING EFFECTS: BASIC PREMISES
In our primary paper [10] we emphasized that the epigenetic (EC-based) survival of a new gene duplicate might be strongly associated with its relocation within the genome. It was a priori clear that the expression pattern of an extra gene copy is of critical importance for its evolutionary fate. Indeed, if newly born gene duplicates have exactly the same development-time and tissue pattern of expression, selection is unable to distinguish them and one of the duplicates will degrade to a pseudogene. However, gene expression strongly depends on the local chromatin environment whether on the same or different chromosomes [30, 31]. For example, experiments involving insertion of the beta-globin gene into ectopic sites indicate that the local chromatin environment has a strong effect if just the beta-globin gene and promoter are inserted at an ectopic site [32]; however, if the entire beta-globin locus with its locus control region (LCR) and 55 kb of upstream regulatory sequences is inserted, then the locus is expressed rather independently of the insert site [33].
Consistent with such experiments is our major hypothesis that the aforementioned position effects might play an important role in evolution of gene duplicates, being much more common for translocated than for tandem duplicates and more common for relatively small duplications than for large ones. More specifically, re-positioning of a small gene duplicate to an ectopic site will likely place it outside the control of the former “parental” regulatory elements, and it will come under the control of different regulatory elements. Many multigene families are very intriguing in this regard. For example, alpha- and beta-hemoglobin genes have definitely originated from a common single precursor and were closely linked in an ancestral jawed vertebrate. One would think that tandem organization of genes facilitates their coordinated regulation. However, in birds and mammals alpha- and beta-globin gene clusters lie on separate chromosomes, with the mammalian beta-globin gene in a G-band and alpha-globin gene in an R-band [34]. The alpha-globin gene is expressed in many tissues like a housekeeping gene while the beta-globin gene expression is tissue-specific [31]. These alpha- and beta-globin gene clusters have contrasting subnuclear chromatin environments, e.g. GC contents, CpG islands, replication timing, histone methylation, interphase positioning, and DNA methylation levels [35-37]. Not surprisingly, they exhibit marked tissue-restricted differences in expression.
RE-POSITIONING EFFECTS: RESULTS OF SYNTENIC VS. NON-SYNTENIC
COMPARISONS
It seems likely that re-positioning of a gene duplicate will result in evolutionarily advantageous epigenetic changes of its expression pattern at the new location even though no genetic (e.g. mutational) changes occur in the gene itself. In contrast, the mutational DDC mechanism for enhancing the survival of duplicates does not depend on repositioning effects. Our recent, genome-wide observations have not only strengthened our EC model but, more importantly, clearly pointed to repositioning as the major course toward novelties [38, 39]. The main idea behind these studies was that more often than not a true novelty in evolution by gene duplication might not result from gradual mutational tuning of a new molecular function but rather an almost immediate effect of relocation-caused radical change in place and time of expression of old function(s).
Very telling in this regard are the opposite trends in evolutionary dynamics shown by syntenic (same chromosome) and non-syntenic pairs of gene duplicates (Fig. 3). From these data we concluded [38]:
- the large majority of very young duplicates (silent substitutions per site < 0.05; see Fig. 3) are localized on the same chromosome (likely as tandem repeated units), whereas only about 10% of such duplicates reside on different chromosomes;
- very quickly, by 0.05 silent substitutions per site (sps), the number of syntenic duplicates steeply drops. In contrast, non-syntenic duplicates demonstrate a rapid increase;
- the increase in duplicates on different chromosomes likely occurs at the expense of duplicates on the same chromosome. One can see, however, that in the interval 0 < sps < 0.02 the “syntenic decrease” apparently exceeds the “non-syntenic” increase. This imbalance suggests that the greater part of newly born tandem duplicates perish if they stay at the same place whereas translocation to ectopic sites, often a different chromosome, favors their survival.
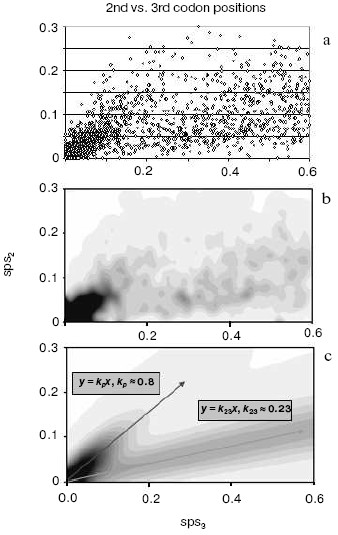
A strong independent argument in favor of translocation-associated survival of gene duplicates comes from the two-stream pattern of their evolution (Fig. 4). In this figure, we plot sps in the 2nd codon position versus sps in the 3rd codon position. If there is no selection, these would both change at similar rates, and one would expect a slope close to 1.0. However, base changes in the 3rd position often do not result in an amino acid change. Thus if there is selection, the 2nd and 3rd codon position would be expected to change at different rates. Figure 4 (lower panel) demonstrates a distinct two-stream pattern of evolution that might be shaped quite shortly after duplication: one stream with ~0.8 slope and the other with ~0.23 slope. In the first (largest) stream, one gene in most pairs is a future pseudogene (“pseudogene-to-be”) that accumulates mutations freely until it is recognized as a pseudogene; at this time, the duplicate is no longer in the functional duplicates database and disappears from consideration. Accordingly, this group is large for young duplicates but exponentially decays in time. In the second stream, both duplicates in a pair separate from “pseudogenes-to-be” and fall under the strong pressure of purifying selection very early. We observed this two-stream pattern with the same ~0.8 and ~0.2 slopes for all large genomes studied, thus suggesting that they reflect some universal constants.Fig. 3. The number of human gene duplicates as a function of the number of silent substitutions per site (sps). It is assumed that the number of sps is proportional to time. The “same chromosome” (syntenic) (bold curve) group is comprised of the pairs in which both homologous genes are located on the same chromosome; the pairs of such genes located on different chromosomes constitute the “different chromosomes” (non-syntenic) (thin curve) group. Bin size is 0.01. Redrawn from [38].
By computer simulation of random base substitutions in protein-encoding genes, one can predict the moment when the first translation-truncating stop codon appears. It is at this point that a duplicate gene destined to degenerate turns into a recognizable pseudogene, and, accordingly, is removed from the database of intact genes. Such simulations indicate that by the time when sps ~ 0.1 substitutions per site, all the duplicates doomed to degradation have already reached this point of warranted detection, i.e. become an identifiable pseudogene [39]. This is consistent with estimations made by Lynch and Conery [22] and their conclusion that the gene duplicates are apparently nonfunctionalized by the time silent sites diverged by only a few percent. Remarkably, the comparison of two genome-wide plots (Figs. 3 and 4) clearly shows that it is exactly the point when (i) the pseudogene-to-be stream runs short (Fig. 4), and (ii) non-syntenic duplicates reach their maximum number while syntenic duplicates, on the contrary, drop to the minimum (then both the groups decline very slowly) (Fig. 3). This means that translocation to an ectopic site does not affect the rate of pseudogenization. Furthermore, in full agreement with our EC model [10], these data indicate that moving to a new residence in the genome preserves a duplicate and promotes its functional divergence. Pairs of non-syntenic duplicates certainly belong to this category. Quite the opposite, the vast majority of pairs with a degrading “pseudogene-to-be” are of the syntenic status.Fig. 4. A two-stream pattern of divergence for human duplicates. a) The original 2nd vs. 3rd plot of duplicates divergence. Each point represents a pair of homologous human genes with the corresponding numbers of sps in the 3rd (X axis) vs. 2nd (Y axis) codon positions. b) A plot of human duplicates from (a) spatially averaged to produce smooth distribution. c) The two-stream approximation of the original data (a) with variance (corresponds to streams “width”) modeled by the binomial distribution. The decaying stream along represents the pairs consisting mostly of a functional gene and its pseudogene-to-be paralog. The second steady stream along represents the cases when both duplicates in the pair are functional under the surveillance of the purifying selection.
REPOSITIONING-ASSOCIATED MUTATIONAL ASYMMETRY OF DUPLICATE
GENES
Among different repositioning effects on duplicate genes, one would expect to find both epigenetic and genetic changes. We do observe changes in the rate and direction of mutations (Figs. 5 and 6). Originally we expected to detect such changes in vertebrates since their genomes consist of rather long (>300-kb) pieces of DNA significantly differing in GC content (“isochores”) [40, 41], so that if a duplicate gene moves into a different isochore, it may accumulate mutations that bias its GC content toward the GC content of its new residence. Consistently for the human genome, Figs. 5 and 6 and table clearly show that:
- while single (nonduplicated) and most very young gene duplicates (>95% amino acid identity) are quite similarly distributed in GC content, there is a suggestion of a bimodal distribution. The distribution of more diverged, older duplicates is clearly bimodal (Fig. 5). This bimodality is most pronounced for the selectively less-constrained 3rd codon position [38];
- for human and other mammalian genomes, this GC asymmetry of gene duplicates correlates with the GC level of isochores in which GC-asymmetric duplicates are placed [38];
- a new isochoreic affiliation of one of two homologous genes in the pair is definitely caused by its repositioning in the genome (table);
- apparently, the GC asymmetry is a result of a significant difference between gene duplicates in the rate and direction of mutations (Fig. 6).
Shown in Figs. 5 and 6 are the GC-content and mutation data for the 3rd codon position, where substitutions are mostly silent and therefore reflect the duplicate-asymmetric neutral mutational noise. We observed exactly the same, but less pronounced, asymmetries of gene duplicates for the 1st and 2nd codon positions (not shown). The increased mutation pressure on the re-positioned gene copy could be a great help in its functional divergence from its parental twin; it does not change the ratio of detrimental to advantageous mutations, but essentially shortens the “waiting time” for acceptable non-silent (quasi-neutral or rare advantageous) mutations to occur.
Fig. 5. Frequency distributions of GC in the 3rd codon position (GC3) of human single and duplicated genes. Young duplicates have more than 95% identical amino acids, whereas the “old” group includes all duplicates that are in the range between 60 and 95% identical amino acids (for more detail see [38]).
Chromosomal localization of homologous gene pairs*Fig. 6. The mutational asymmetry of gene duplicates at genome resolution in different species. Shown are frequency distributions of deviations from expected mean values of C<-->T transitions. Each point represents a frequency (Y-axis) of gene pairs with the corresponding “oddness” of pair-wise asymmetry measured in sigmas (X-axis). Young duplicates (nucleotide identity > 80%) were excluded since they did not diverge enough to show a significant asymmetry and may contain pseudogenes-to-be (see Fig. 4). The line without symbols shows the normal (Gaussian) distribution that is expected under the assumption of equal substitution rates in gene duplicates. If a point is higher than expected, this means that mutation rates are significantly duplicate-asymmetric in the corresponding pairs. The plot shows the C<-->T distributions for human, mouse, nematode and mustard weed genomes. The inset table on the right shows the dispersion of this distribution for C<-->T transitions in different eukaryotic species. Redrawn from [38].
*To minimize pseudogene-to-be influence only the pairs with identity <80% were considered (the trend remains the same when all the pairs are included). To avoid interference of conversion, only small multigene families not containing more than five genes were used.
**In parentheses, the number of chromosomes in the haploid set.
EPIGENETIC SURVIVAL OF DUPLICATES AND THE GENE NUMBER
PARADOX
The repositioning-caused asymmetry of gene duplicates in the rate and direction of mutagenesis is seen for all species so far examined [38]. Yet, of eight eukaryotic genomes studied, the human genome is the most asymmetric (Fig. 6 and table). Undoubtedly, gene duplicates in human and other vertebrate genomes are asymmetric due to depletion of CpG dinucleotides [38], most cytosines of which are methylated, and which are thought to have higher mutation rates due to methylation. However, methylation is worthy of attention not only in the context of mutational events but also as a marker of the epigenetic processes that likely play an essential, although indirect, role in evolution of new genes and change in gene number (G-value).
Tissue/stage-complementary epigenetic silencing of new gene duplicates should favor their preservation and subsequent neo-functionalization. Each such epigenetically preserved gene duplication increases the number of genes. The favorable role of epigenetic changes in gene evolution becomes even larger if one takes into account how small is the effective population size Ne of higher organisms such as mammals with slow and complex development. Moreover, in addition to small Ne, higher organisms show a much lower point mutation rate [42, 43]; hence they have a smaller probability of adaptive evolution by gradual accumulation of advantageous mutations. Our hypothesis is that due to more diverse chromatin organization higher organisms may readily compensate this shortcoming by genes re-positioning and epigenetic changes of their expression.
In general, the evolutionary potential of genomes to increase their complexity might be not so much associated with the number of genes per se as with the number of epigenetically contrasting tissue- and/or stage-specific chromatin domains. It seems reasonable to assume that the greater the number of domains (with different chromatin type, DNA methylation level, etc.) an evolving genome already has, the greater the probability for the next extra gene copy to change its expression pattern due to re-positioning into a new chromatin environment, where it would come under the surveillance of natural selection and, accordingly, escape pseudogenization.
The human genome has only about 25,000-30,000 genes in total. This number seems to be unexpectedly small, especially in comparison with less complex organisms such as the nematode Caenorhabditis elegans, which has 17,000 genes. Of course, the more adequate measure of genetic complexity that correlates with organismal complexity is the diversity of expression patterns, which in turn depends on (i) the number of genes that encode transcription factors and cofactors and (ii) the number of their DNA targets--promoters, enhancers, silencers, etc. [44]. However, this does not solve the problem of the origin by adaptive evolution of these regulatory elements. We speculate that at the very initial phase, the local epigenetically contrasting chromatin domains could provide a sort of “launching platform” for such evolution. Further genome-wide analyses are required to examine this hypothesis in detail.
We emphasize that to gain a novel function, evolution more often than not experiments with already existing genes and regulatory elements by putting their duplicates (or sometimes even single genes themselves) in new places in the genome and changing tissue and stage of expression rather than creating a truly new gene from an old one by gradual accumulating rare advantageous mutations. If the repositioned gene or element has some positive effect, the re-positioned duplicate will be further tuned by perhaps a very few adaptive mutations to better suit the functional demands of its new residence.
Position effects have been well studied by developmental geneticists since 1930 [45-48]. The great creative role of gene duplications in evolution was also proposed in the early 30s [11-14]. Our initial conjecture on the role of epigenetic complementation [10], genome-wide analyses in general, and the comparison of Figs. 3 and 4 in particular, unite these two insights: it appears that predominantly repositioned duplicates survive whereas many stationary (most likely tandem repeated) duplicates degenerate into pseudogenes and eventually into junk DNA.
We thank G. Holmquist and A. Rodin for valuable comments and suggestions.
REFERENCES
1.Vanyushin, B. F., and Fais, D. (1962)
Biokhimiya, 26, 895-899.
2.Vanyushin, B. F., Tkacheva, S. G., and Belozersky,
A. N. (1970) Nature, 225, 948-949.
3.Vanyushin, B. F., Mazin, A. L., Vasilyev, V. K.,
and Belozersky, A. N. (1973) Biochim. Biophys. Acta, 299,
397-403.
4.Riggs, A. D. (1975) Cytogenet. Cell Genet.,
14, 9-25.
5.Holliday, R., and Pugh, J. E. (1975)
Science, 187, 226-232.
6.Riggs, A. D., and Xiong, Z. (2004) Proc. Natl.
Acad. Sci. USA, 101, 4-5.
7.Bird, A. (2002) Genes Dev., 16,
6-21.
8.Jones, P. A., and Baylin, S. B. (2002) Nat. Rev.
Genet., 3, 415-428.
9.Jenuwein, T., and Allis, C. D. (2001)
Science, 293, 1074-1080.
10.Rodin, S. N., and Riggs, A. D. (2003) J. Mol.
Evol., 56, 718-729.
11.Haldane, J. B. S. (1932) The Causes of
Evolution, Longman and Green, London.
12.Haldane, J. B. S. (1933) Am. Nat.,
67, 5-19.
13.Muller, H. J. (1935) Genetics, 17,
237-252.
14.Serebrovsky, A. S. (1938) Proc. Russ. Acad.
Sci., 19, 77-81.
15.Ohno, S. (1970) Evolution by Gene
Duplication, Springer, Berlin.
16.Nei, M., and Roychoudhury, A. K. (1973) Am.
Nat., 107, 362-372.
17.Kimura, M., and King, J. L. (1979) Proc. Natl.
Acad. Sci. USA, 76, 2858-2861.
18.Li, W.-H. (1980) Genetics, 95,
237-258.
19.Ohta, T. (1987) Genetics, 115,
207-213.
20.Clark, A. G. (1994) Proc. Natl. Acad. Sci.
USA, 91, 2950-2954.
21.Walsh, J. B. (1995) Genetics, 139,
421-428.
22.Lynch, M., and Conery, J. S. (2000)
Science, 290, 1151-1155.
23.Mounsey, A., Bauer, P., and Hope, I. A. (2002)
Genome Res., 12, 770-775.
24.Force, A., Lynch, M., Pickett, B., Amores, A.,
Yan, Y.-L., and Postlethwait, J. (1999) Genetics, 151,
1531-1545.
25.Lynch, M., and Force, A. (2000) Genetics,
154, 459-473.
26.Lynch, M., O'Hely, M., Walsh, B., and Force, A.
(2001) Genetics, 159, 1789-1804.
27.Carmichael, G. G. (2003) Nature Biotech.,
21, 371-372.
28.Adams, K. L., Percifield, R., and Wendel, J.
(2004) Genetics, 168, 2217-2226.
29.Tweedie, S., Charlton, J., Clark, V., and Bird,
A. (1997) Mol. Cell Biol., 17, 1469-1475.
30.Cockell, M., and Gasser, S. M. (1999) Curr.
Opin. Genet. Dev., 9, 199-205.
31.Brown, K. E., Amoils, S., Horn, J. M., Buckle, V.
J., Higgs, D. R., Merkenschlager, M., and Fisher, A. G. (2001)
Nature Cell Biol., 3, 602-606.
32.Aladjem, M. I., Rodewald, L. W., Kolman, J. L.,
and Wahl, G. M. (1998) Science, 281, 1005-1009.
33.Simon, I., Tenzen, T., Mostoslavsky, R., Fibach,
E., Lande, L., Milot, E., Gribnau, J., Grosveld, F., Fraser, P., and
Cedar, H. (2001) EMBO J., 20, 6150-6157.
34.Goldman, M. A., Holmquist, G. P., Gray, M. C.,
Caston, L. A., and Nag, A. (1984) Science, 224,
686-692.
35.Holmquist, G. P. (1992) in Advances in
Mutagenesis Research (Obe, G., ed.) Vol. 2, Springer, Berlin, pp.
95-126.
36.Smith, Z. E., and Higgs, D. R. (1999) Hum.
Mol. Genet., 8, 1373-1386.
37.Schubeler, D., Francastel, C., Cimbora, D. M.,
Reik, A., Martin, D. I., and Groudine, M. (2000) Genes Dev.,
14, 940-950.
38.Rodin, S. N., and Parkhomchuk, D. V. (2004) J.
Mol. Evol., 59, 372-384.
39.Rodin, S. N., Parkhomchuk, D. V., Rodin, A. S.,
Holmquist, G. P., and Riggs, A. D. (2005) DNA Cell Biol., in
press.
40.Bernardi, G. (2000) Gene, 241,
3-17.
41.Jabbari, K., Rayko, E., and Bernardi, G. (2003)
Gene, 317, 203-208.
42.Martin, A. P., and Palumbi, S. R. (1993) Proc.
Natl. Acad. Sci. USA, 90, 4087-4091.
43.Yi, S., Ellsworth, D. L., and Li, W.-H. (2002)
Mol. Biol. Evol., 19, 2191-2198.
44.Levine, M., and Tjian, R. (2003) Nature,
424, 147-151.
45.Muller, H. J. (1930) J. Genet., 22,
299-335.
46.Lewis, E. B. (1950) Adv. Genet., 3,
73-115.
47.Brickner, J. H., and Walter, P. (2004) PloS
Biology, 2, 342.
48.Isogai, Y., and Tjian, R. (2003) Curr. Opin.
Cell. Biol., 15, 296-303.