A Novel Low Molecular Weight Alanine Aminotransferase from Fasted Rat Liver †
M. Vedavathi1,2, K. S. Girish1,3, and M. Karuna Kumar1*
1Department of Biochemistry, University of Mysore, Manasagangotri, Mysore 570006, India; E-mail: karunamkk@rediffmail.com2Present address: Department of Orthopedic and Surgery, University of Virginia, Charlottesville, Virginia 22903, USA
3Present address: Department of Surgery, Thomas E. Starzl Transplantation Institute, University of Pittsburgh, E1502 BST, 200 Lothrop Street, Pittsburgh, PA 15232, USA
* To whom correspondence should be addressed.
† This article has been retracted.
Received March 8, 2005; Revision received March 24, 2005
Alanine is the most effective precursor for gluconeogenesis among amino acids, and the initial reaction is catalyzed by alanine aminotransferase (AlaAT). Although the enzyme activity increases during fasting, this effect has not been studied extensively. The present study describes the purification and characterization of an isoform of AlaAT from rat liver under fasting. The molecular mass of the enzyme is 17.7 kD with an isoelectric point of 4.2; glutamine is the N-terminal residue. The enzyme showed narrow substrate specificity for L-alanine with Km values for alanine of 0.51 mM and for 2-oxoglutarate of 0.12 mM. The enzyme is a glycoprotein. Spectroscopic and inhibition studies showed that pyridoxal phosphate (PLP) and free -SH groups are involved in the enzymatic catalysis. PLP activated the enzyme with a Km of 0.057 mM.
KEY WORDS: alanine aminotransferase, fasting, purificationDOI: 10.1134/S0006297906130189
Abbreviations: AlaAT) alanine aminotransferase; PLP) pyridoxal phosphate.
Alanine aminotransferase (AlaAT) enzyme activity increases under
conditions associated with gluconeogenesis such as starvation in
mammalian liver [1]. This enzyme is present in the
mitochondrial fraction of rat liver as well as in the supernatant
fraction (soluble enzyme) [2-4]. Alanine is the prime substrate for this enzyme and
most effective precursor for gluconeogenesis among amino acids [5-7]. The initial reaction for
gluconeogenesis from alanine is catalyzed by alanine-2-oxoglutarate
aminotransferase (EC 2.6.1.2). Its activity, when measured in
homogenates, changes markedly in response to various physiological and
nutritional treatments [8-12].
Rosen et al. [11] found that AlaAT activity
increased under conditions associated with gluconeogenesis--in response
to hydrocortisone and dietary protein and in diabetes and fasting.
Beaton et al. [13] concluded that the increase in
the level of AlaAT activity indicates the involvement of new enzyme
synthesis rather than the release of inhibitors or activators in the
liver. The conditions which stimulate gluconeogenesis may initially
influence amino acid transport or some aspects of protein synthesis or
nucleic acid metabolism that increase the metabolic pools of amino
acids resulting in substrate-induced AlaAT synthesis. In mammalian
liver, starvation produces an increase in the specific activity of the
cytosolic isoenzymes but not the mitochondrial isoenzymes [14].
Most of the studies on the purification and characterization of liver AlaAT was restricted to normal male adult rats. Very little information is available on the purification and characterization of AlaAT from liver of fasted male rats. The present study deals with the isolation and biochemical characterization of a novel low molecular weight cytosolic AlaAT from liver of male rats during fasting.
MATERIALS AND METHODS
Chemicals. Sephadex G-150, DEAE-Sephadex A-25, hydroxyapatite, beta-mercaptoethanol, pyridoxal phosphate (PLP), aminooxyacetic acid, and p-hydroxymercuribenzoate were from Sigma (USA). Calibration kits for isoelectric point determination were from Amersham and Pharmacia Biotech (USA). Nitro blue tetrazolium, phenazine methosulfate, L-alanine, and 2-oxoglutarate were from Merck (India). All other chemicals used were of analytical grade.
Animals. Swiss Wistar albino male rats weighing 160-200 g were obtained from Central Animal House facility, Department of Zoology, University of Mysore, Mysore, India. Food was given ad libitum before starvation. Rats were starved for three days but they were given water ad libitum. The animal experiments were conducted in compliance with the National Regulation for Animal Research.
Enzyme purification. The livers from three day fasted male rats were homogenized in a Sorvall-Omni mixer at full speed for 30 sec in five volumes of 0.25 M sucrose containing 0.01 M beta-mercaptoethanol. The homogenate was centrifuged at 10,000g for 30 min. The resulting supernatant was heated at 55°C for 5 min. Then the pH was lowered to 5.0 by the addition of 1 M acetic acid with constant stirring. Denatured protein was removed by centrifugation at 10,000g for 30 min. The clear supernatant was subjected to 48% ammonium sulfate precipitation (275 mg of ammonium sulfate per ml was added slowly with gentle stirring). The precipitate was collected by centrifugation at 10,000g for 30 min and dissolved in a small volume of 0.01 M potassium phosphate buffer, pH 5.7, containing 0.01 M beta-mercaptoethanol. The solution was dialyzed against several changes of the same buffer until the dialyzate failed to give precipitate with an acid solution of BaCl2. The resulting solution was then centrifuged at 40,000g for 3 h. The brownish inactive pellet was discarded and the supernatant used for further purification.
The dialyzate was applied on a Sephadex G-150 column (1.5 × 80 cm) equilibrated with 0.01 M potassium phosphate buffer, pH 7.4, containing 0.01 M beta-mercaptoethanol. The equilibration buffer was used for elution, and 2.5 ml fractions were collected at a flow rate of 25 ml/h. The elution of protein was monitored at 280 nm using a Shimadzu 1601A spectrophotometer (Japan). The fraction containing enzyme activities were pooled and concentrated. The enzyme concentrate was then applied to a DEAE-Sephadex A-25 column (2 × 30 cm) equilibrated with 0.01 M potassium phosphate buffer, pH 7.4, containing 0.01 M beta-mercaptoethanol. The column was washed with two bed volumes of the buffer. Column bound protein was eluted with stepwise molarities of NaCl (0-300 mM) in 0.01 M potassium phosphate buffer, pH 7.4. The flow rate was adjusted to 25 ml/h and 2.5-ml fractions were collected. The fractions containing enzyme activity were pooled and concentrated.
The enzyme active fractions from DEAE-Sephadex were applied onto a hydroxyapatite column (1.5 × 10 cm), which was pre-equilibrated with 0.1 M potassium phosphate buffer, pH 6.8, containing 0.01 M beta-mercaptoethanol. Elution was carried out stepwise with various molarities of potassium phosphate buffer (0.1-0.6 M) and 2.5-ml fractions were collected at a flow rate of 25 ml/h. The fractions with AlaAT activity were pooled.
Active fractions obtained from the hydroxyapatite column were further subjected to electrophoresis on 7.5% polyacrylamide gel (8 × 0.5 cm) as described by Davis [15]. Each protein separation was done in two gels. After electrophoresis one of two gels was stained with 0.1% Coomassie brilliant blue R-250 in methanol-acetic acid-water (40 : 10 : 60 v/v) for 1 h and another was left unstained. The gels were destained using methanol-acetic acid-water (40 : 10 : 60 v/v). The unstained gels were sliced into 10 mm slabs corresponding to the protein bands of the stained gels. Protein from the gel was extracted overnight in Tris-HCl buffer.
Enzyme assay. Keto acid was estimated according to the procedure of Reitman and Frankel [16]. To 0.5 ml of the buffered substrate (200 mM L-alanine and 2 mM 2-oxoglutarate in 0.1 M phosphate buffer, pH 7.4), 0.1 ml of the enzyme solution was added. The reaction mixture was incubated at 37°C for 30 min at the end of which 0.5 ml of 2,4-dinitrophenyl hydrazine (DNPH) was added to stop the reaction. A blank was also maintained simultaneously under similar conditions to which 0.5 ml of DNPH was added before the addition of the enzyme. The volumes in all the tubes were made up to 1.5 ml using appropriate amounts of phosphate buffer. The reaction mixtures were kept for 20 min at room temperature. Then 4 ml of 0.4 N NaOH was added. The resultant color was read immediately against the blank at 540 nm.
Polyacrylamide gel electrophoresis. To locate the enzyme activity, samples were run on polyacrylamide gel electrophoresis (10%). After electrophoresis, the gel was washed with 50 mM Tris-HCl buffer, pH 8.5, and incubated at 37°C for 30 min with 10 ml 50 mM Tris-HCl buffer containing 400 mM L-alanine, 40 mM 2-oxoglutarate, 1 mg phenazine methosulfate, 4 mg nitro blue tetrazolium, and 1 µmol PLP. Clear translucent bands against purple color background were obtained [17].
SDS-PAGE was carried out according to the method of Laemmli [18] and 10% gel was used. Molecular mass standards (14.3-200 kD) were employed. After electrophoresis, the gel was stained with 0.1% Coomassie brilliant blue R-250 for detection of the protein bands and destained with ethanol and 8% acetic acid in water.
The molecular mass of AlaAT was also determined by gel filtration according to the method of Andrews [19].
RP-HPLC. Alanine aminotransferase enzyme from electroelution was subjected to RP-HPLC using a Vydac-C8 (5 µm, 0.21 × 25 cm) column that has been pre-equilibrated with 0.1% trifluoroacetic acid (TFA) in water. The column was eluted using a linear gradient from solution A (0.1% TFA in water) to 100% solution B (0.1% TFA in acetonitrile) for 70 min. The protein was eluted at a flow rate of 1 ml/min and monitored at 280 nm.
Isoelectrofocusing. A calibration kit was used for pI determination of AlaAT according to the manufacturer's protocol. The broad pI calibration kit and enzyme were run on 10% polyacrylamide gel containing Pharmalyte 3-10. After focusing, the proteins on the gel were fixed with 20% trichloroacetic acid solution.
N-Terminal sequencing. The N-terminal sequencing of the AlaAT was carried out in a fully automated Shimadzu PSQ-1 protein sequencer system that employs Edman's degradation reaction for sequential separation of N-terminal amino acids.
Detection of glycoprotein by periodic acid Schiff's (PAS) staining. SDS-PAGE was carried out in slab gel as described above. PAS staining was done according to the method of Leach et al. [20].
UV-visible spectrum. The absorption spectrum of the enzyme (1 mg/ml) in 0.1 M potassium phosphate buffer was recorded between 240-480 nm with a Shimadzu UV 1601A spectrophotometer.
Substrate specificity. Substrate specificity of AlaAT was studied using different amino acids and their derivatives at 200 mM concentration in 0.1 M potassium phosphate buffer, pH 7.4. The activity was estimated by the usual assay procedure.
Inhibitor study. For inhibition studies inhibitors such as aminooxyacetate, hydroxylamine, p-hydroxymercuribenzoate, HgCl2, o-phenanthroline, L-ascorbate, maleate, and glutarate were used. Aliquots of inhibitor solution at 2.5 mmol/ml were preincubated with purified enzyme at 37°C for 30 min. A set of control experiments was performed simultaneously. Reaction was initiated by the addition of substrate (200 mM alanine and 2 mM 2-oxoglutarate). The activities were determined as described above.
Effect of PLP on AlaAT apoenzyme activity. About 10 µg of purified apoenzyme in 0.5 ml buffered substrate, pH 7.4, was incubated with different concentrations (0-300 mM) of cofactor (PLP) for 30 min. The enzyme activity was determined as described above.
Fluorescence emission spectra and protein determination. The fluorescence intensity of AlaAT was monitored using a Shimadzu RF-5301pc spectrofluorimeter. Reaction mixture of 2 ml taken in 1-cm pathlength quartz cuvettes contained 0.1 M potassium phosphate buffer, pH 7.4, and 50 µg of AlaAT. The fluorescence spectrum was measured between 300 to 400 nm with excitation at 280 nm. The protein content was determined by the method of Lowry et al. [21] using bovine serum albumin (BSA) as the standard.
RESULTS
Alanine aminotransferase enzyme was purified from starved rat livers. The crude enzyme extract was subjected to heat and acid treatment and ammonium sulfate precipitation. After this, the sample was subjected to gel filtration, which resolved it into three peaks (Fig. 1a). The first peak containing AlaAT activity was loaded onto a DEAE-Sephadex column. Of the four protein peaks resolved in DEAE-Sephadex column chromatography, one showed with dotted line (Fig. 1b) exhibited about 39% of the AlaAT activity. The enzyme fraction from ion-exchange chromatography was further loaded onto a hydroxyapatite column, resulting in three peaks (Fig. 1c). The third peak with AlaAT activity was concentrated and subjected to PAGE. The electrophoretic pattern showed two protein bands, which were extracted separately from the gel using incubation buffer. The band showing enzyme activity was designated as AlaAT. A summary of the purification procedure is given in Table 1.
Table 1. Summary of the purification of L-alanine aminotransferase from fasted liver of adult male ratFig. 1. Isolation of alanine aminotransferase from fasted rat liver. a) Elution profile from Sephadex G-150 column. Protein absorbance at 280 nm (solid line) and relative activity (dotted line) profiles are shown. b) Elution profile from DEAE-Sephadex A-25 column. c) Elution profile from hydroxyapatite column.
Note: One unit of enzyme activity is defined as the amount of enzyme forming 1 mg of pyruvate in 30 min at 37°C.
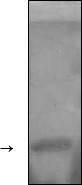
Homogeneity and characterization. The extent of purification is shown by SDS-PAGE (Fig. 2). Homogenate and the preparations obtained after heat and acid treatment and ammonium sulfate precipitation showed several bands on SDS-PAGE. The hydroxyapatite fraction showed two bands (lane 4), and the purified fraction of AlaAT from electroelution showed only one band under non-reducing conditions (Fig. 2, lane 5). The purified AlaAT moved as a single sharp band on PAGE (Fig. 3b). Parallel mobility was also seen in activity-stained gel with the appearance of a translucent band (Fig. 3a, lane 5). AlaAT gave a single positive pink colored band on PAS staining (Fig. 4). The enzyme eluted as a single sharp peak in RP-HPLC with the retention time of 50.4 min (Fig. 5). The sequence analysis of enzyme confirms the presence of glutamine at the N-terminal position. The relative molecular weight determined on SDS-PAGE was 17.7 kD, while the apparent molecular mass by the gel filtration method was 18.3 kD. The isoelectric point was found to be 4.2 with a specific activity of 17.1 units/min. The activity optimum pH and temperature were 8.5 and 55°C, respectively.
Fig. 2. The progress of purification of alanine aminotransferase enzyme as shown by SDS-PAGE (10%). Samples contained 100 µg crude extract (1), 75 µg heat and acid treatment (2), 75 µg ammonium sulfate precipitate (3), 30 µg hydroxyapatite fraction (4), and 20 µg of purified enzyme under non-reducing condition (5). M represents molecular weight marker in kD, from top to bottom: myosin H chain (200), phosphorylase b (97.4), BSA (68), ovalbumin (43), carbonic anhydrase (29), beta-lactoglobulin (18.4), and lysozyme (14.3).
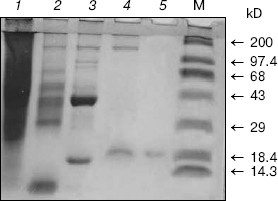
Fig. 3. a) Activity gel assay for alanine aminotransferase (AlaAT) as shown in PAGE (10%). Samples contained 30 µg of crude extract (1), 30 µg heat and acid treatment (2), 30 µg of ammonium sulfate precipitation (3), 15 µg of ion exchange fraction (4), and 5 µg of purified enzyme (5). b) Native gel of purified AlaAT (20 µg).
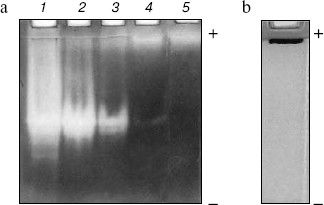
Fig. 4. PAS staining of purified alanine aminotransferase (40 µg) as shown by SDS-PAGE (10%).
The absorbance spectrum of the enzyme in the visible region showed a maximum absorbance at 420 nm. Upon the addition of L-alanine (10 mM), the 420 nm peak virtually disappears and a 320 nm peak was markedly increased (Fig. 6).Fig. 5. RP-HPLC analysis of purified alanine aminotransferase. Ten microgram of enzyme was applied onto a Vydac C8 column (5 µm, 0.21 × 25 cm) equilibrated with 0.1% TFA in water.
Thirty different amino acids and their derivatives (200 mM) were tested as substrates for AlaAT in the presence of 2 mM 2-oxoglutarate as amino acceptor. The enzyme converts 100% of L-alanine compared to DL-alanine and L-tyrosine of about 63 and 12.5%, respectively. The results are summarized in Table 2.Fig. 6. Absorption spectra of alanine aminotransferase with (dashed line) and without (solid line) L-alanine (10 mM). The spectra of enzyme (1 mg/ml) in 0.1 M potassium phosphate buffer were recorded.
Table 2. Amino donor specificity of fasted
rat liver AlaAT
The classical inhibitors of AlaAT inhibited the enzyme activity to a varied extent. Table 3 gives the percentage of inhibition of different inhibitors. Hydroxylamine, aminooxyacetate, p-hydroxymercuribenzoate, and HgCl2 completely inhibited the enzyme activity. Glutarate and maleate caused 70% inhibition, whereas L-ascorbate, o-phenanthroline, and EDTA showed little or no inhibition.
Table 3. Effect of different inhibitors on
the AlaAT of fasted rat liver
Addition of the PLP to apoenzyme reconstituted enzyme activity completely with the Km of 0.057 mM (Fig. 7). The enzyme has a tyrosine specific fluorescence emission maximum between 310-320 nm and another maximum at 350-360 nm (data not shown).
The Km values obtained from the secondary plots were 0.51 mM for alanine and 0.12 mM for 2-oxoglutarate substrates for the enzyme and kcat is 17.1 sec-1 (Fig. 8, a and b).Fig. 7. Effect of pyridoxal 5´-phosphate on alanine aminotransferase apoenzyme activity. The enzyme (10 µg/ml) in 0.1 M potassium phosphate buffer was used in each assay and activity is expressed as µg of product (pyruvate) released/min at 37°C.
Fig. 8. Ping-pong mechanism of the bi-bi reaction of L-alanine aminotransferase enzyme from fasted rat liver. a) Lineweaver-Burk plot of initial velocity data from an experiment in which alanine was the variable substrate at four different fixed concentration of 2-oxoglutarate. b) Secondary plot of intercepts (1/Vmax) and slopes as a function of the co-substrate concentration.
DISCUSSION
The complete purification of AlaAT from starved male rat liver proved to be difficult and involved a large number of chromatographic steps. Successive four-step fractionation of ammonium sulfate precipitate of liver homogenate through gel filtration, ion exchange, hydroxyapatite, and electroelution resulted in purification of AlaAT to the extent of 275.14-fold. Biochemical and biophysical properties of AlaAT of fasted rat liver are shown in Table 4.
Table 4. Biochemical and biophysical
properties of alanine aminotransferase of fasted rat liver
PAGE, SDS-PAGE, RP-HPLC, and N-terminal sequencing analysis confirmed the homogeneity of the purified enzyme. The molecular weights of AlaAT from bovine brain [22], pig heart [23], rat liver [24], Drosophila [25], tomato [26,27], Panicum miliaceum [28], Pyrococcus furiosus [29], Chlamydomonas reinhardtii [30], Candida maltosa [31], and mitochondrial and cytosolic form of pig liver and kidney [32] are between 70-125 kD. However, the molecular weight of AlaAT purified by us was 17.3 kD. To our knowledge, this is the first aminotransferase having low molecular weight.
The isoelectric point of AlaAT (pI 4.2) suggests that the enzyme is acidic in nature. Although the results are well comparable with the cytosolic AlaATs from bovine brain, rat liver, guinea pig liver, human liver, rat kidney, and pig kidney which have pI values between 4.8-5.7 [33], the mitochondrial enzymes of the above-mentioned organs and starved chicken liver [34] have pI of 6.7-8.7. The enzyme activity was the highest at pH of 8.5, in contrast to other cytosolic aminotransferases with maximum activity in pH range of 6.5-7.5.
The absorption spectrum of the purified AlaAT indicates that PLP is bound to the protein. The absorption at 420 nm represents the phosphopyridoxal form of the enzyme, showing a typical Schiff's base formed between the enzyme protein and PLP. The absorption at 320 nm could be due to the phosphopyridoxamine form, the derivative formed by enzyme, cofactor, and alanine. Under the conditions of this experiment, the latter is probably the predominant form. These results are consistent with our observation that the enzyme still had 50% activity in the absence of added PLP. During the purification, the cofactor did not release from the enzyme. A similar tight binding between PLP and apoenzyme was observed in AspAT of C. reinhardtii [35] and higher plants [36, 37]. The reconstitution of the cofactor with the enzyme is reversible. The 5´-phosphates of both pyridoxal and pyridoxamine were equally effective in completely restoring activity to the apoenzyme.
The results from substrate specificity data confirmed that the enzyme exhibits absolute specificity for L-alanine compared with other amino acids and beta-alanine. Alanine is recognized as the most important amino acid donor to hepatic gluconeogenesis [38] but its significance as a hepatic nitrogen donor has received little attention. It is a principal amino acid released by skeletal muscle and taken up by the liver in starvation [38]. Alanine is also of great importance in the fed state, not only because of its being a constituent of dietary protein but also because of its production by intestinal cells, where it is a major end product of glutamine metabolism [39].
Alanine aminotransferase activity was strongly inhibited by aminooxyacetate and hydroxylamine, which are PLP antagonists. The enzyme activity was completely inhibited by p-hydroxymercuribenzoate and HgCl2, which are typical reagents for sulfhydryl groups. These results are comparable with those reported in the literature for cytosolic aminotransferase from other sources [24]. Our results are consistent with direct involvement of both PLP and free -SH groups in enzyme catalysis. Similar observations on inhibition by antagonists of PLP and by sulfhydryl reagents have been observed in alga [35], Chlamydomonas, and higher plants [40, 41, 42].
Inhibition by substrate analogs such as maleate and glutarate to an extent of 70% suggested that the dicarboxylic acids bind to the enzyme by attachment at the same groups as do the substrate keto acids [43]. Velick and Vavra [44] reported that these dicarboxylic acids were noncompetitive inhibitors with respect to both the keto and amino acid substrates, indicating that these analogs bound with both the pyridoxal and pyridoxamine forms of the enzyme. Similar results were observed for AlaAT of rat liver [45]. However, Bulos and Handler reported that maleate was a competitive inhibitor with respect to 2-oxoglutarate and uncompetitive inhibitor with respect to alanine [43]. EDTA and phenanthroline did not show any effect on enzyme activities, indicating that the enzyme is not metal dependent.
The N-terminal amino acid reported for cytosolic enzymes of rat liver is alanine [31], while in our studies we observed glutamine. The only glutamine residue appears in the seventh position of the cytosolic high molecular weight enzyme. Thus cleaving off of six N-terminal residues from the high molecular weight enzyme cannot generate the low molecular weight enzyme.
The parallel lines obtained for double reciprocal plots indicated the ping-pong bi-bi mechanism for the enzyme reaction [46].
Hence, we conclude that the low molecular weight alanine aminotransferase is a novel enzyme not reported so far, with all its properties distinctly different from the high molecular weight alanine aminotransferase reported from normal rat liver.
We thank Prof. Cletus J. M. D'Souza (Department of Biochemistry, Mysore) for his valuable suggestions during this study.
REFERENCES
1.Karl, I. E., Barber, A. J., and Kipnis, D. M.
(1976) J. Biol. Chem., 251, 884.
2.Katanuma, N., Mikumo, K., Matsuda, M., and Okada,
M. (1962) J. Vitaminol., 8, 68-73.
3.Hopper, S., and Segal, H. L. (1964) Arch.
Biochem. Biophys., 105, 501-505.
4.Swick, R. W., Barnstein, P. L., and Stange, J. L.
(1965) J. Biol. Chem., 240, 3334-3340.
5.Yamamoto, H., Aikawa, T., Matsutake, H., Okuda, T.,
and Ishikawa, E. (1974) Am. J. Physiol., 226,
1428-1433.
6.McDonald, M., Neufeld, N., Park, B. N., Berger, M.,
and Ruderman, N. (1976) Am. J. Physiol., 231,
619-626.
7.Remsey, C., Demigne, C., and Aufrere, J. (1978)
Biochem. J., 170, 321-329.
8.Schimke, R. J. (1962) J. Biol. Chem.,
237, 459-468.
9.Muramatsu, K., and Ashida, K. (1962) J.
Nutr., 76, 143-150.
10.Zuchlowski, A. C., and Gaebler, O. H. (1957)
Arch. Biochem. Biophys., 66, 463-488.
11.Rosen, F., Roberts, N. R., and Nichol, C. A.
(1959) J. Biol. Chem., 234, 476-480.
12.Waldorf, M. A., Kirk, M. C., Linkswiter, H., and
Harper, A. E. (1963) Proc. Soc. Exp. Biol. Med., 112,
764-768.
13.Beaton, G. H., Curry, D. M., and Veen, M. J.
(1957) Arch. Biochem. Biophys., 70, 288-297.
14.Swick, R. W., Barnstein, P. L., and Stange, J. L.
(1965) J. Biol. Chem., 240, 3341-3345.
15.Davis, B. S. (1964) Ann. NY Acad. Sci.,
121, 404-427.
16.Reitman, S., and Frankel, S. (1957) Am. J.
Clin. Pathol., 28, 56-63.
17.Yagi, T., Kagamiyama, H., and Nozaki, M. (1981)
Analyt. Biochem., 110, 146-149.
18.Laemmli, U. K. (1970) Nature, 227,
680-685.
19.Andrews, P. (1964) Biochem. J., 91,
222-233.
20.Leach, B. S., Collawn, J. F., and Fish, W. W.
(1980) Biochemistry, 19, 5734-5741.
21.Lowry, O. H., Rosebrough, N. J., Farr, A. L., and
Randall, R. J. (1951) J. Biol. Chem., 193, 265-275.
22.Ruscak, M., Orlicky, J., Zubor, V., and Hager, H.
(1982) Neurochemistry, 39, 210-216.
23.Saier, M. H., and Jenkins, T. W. (1967) J.
Biol. Chem., 242, 91-100.
24.Gatehouse, P. W., Hopper, P. S., Schatz, L., and
Segal, H. L. (1967) J. Biol. Chem., 242, 2319-2324.
25.Schneider, M., and Chen, P. S. (1981) Insect.
Biochem., 11, 657-672.
26.Gazeu-Reyjal, M., and Crouzet, J. (1976)
Phytochemistry, 15, 1619-1622.
27.Rech, J., and Crouzet, J. (1974) Biochim.
Biophys. Acta, 350, 392-399.
28.Son, D., Jo, J., and Sugiyama, T. (1991) Arch.
Biochem. Biophys., 289, 262-266.
29.Ward, D. E., Kengen, S. W. M., van der Oost, J.,
and de Vos, W. M. (2000) J. Bacteriol., 182,
2559-2566.
30.Lain-Guelbenzu, B., Cardenar, J., and
Munoz-Blanco, J. (1991) Eur. J. Biochem., 202,
881-887.
31.Umemura, J., Yenagiya, K., Komatsubara, S., Sato,
T., and Tosa, T. (1994) Biosci. Biotech. Biochem., 58,
283-287.
32.De Rosa, G., Burk, T. L., and Swick, R. W. (1979)
Biochim. Biophys. Acta, 567, 116-124.
33.Ruscak, M., Orlicky, J., and Zubor, V. (1982)
Comp. Biochem. Physiol., 71, 141-144.
34.Fujiwara, S., Sakuraba, H., and Noguchi, T.
(1994) Arch. Biochem. Biophys., 310, 497-503.
35.Lain-Guelbenzu, B., Munoz-Blanco, J., and
Cardenas, J. (1990) Eur. J. Biochem., 188, 529-533.
36.Bone, D. H., and Fowden, L. (1960) J. Exp.
Bot., 11, 104-115.
37.Reed, R. E., and Hess, J. L. (1975) J. Biol.
Chem., 250, 4456-4461.
38.Felig, P. (1975) Annu. Rev. Biochem.,
44, 933-955.
39.Watford, M. (1994) Biochim. Biophys. Acta,
1200, 73-78.
40.Givan, C. V. (1980) The Biochemistry of
Plants. A Comprehensive Treatise, Academic Press, New York.
41.Splittstoesser, W. E., Chu, C., Stewart, S. A.,
and Splittstoesser, S. A. (1976) Plant Cell Physiol., 17,
83.
42.Ireland, R. J., and Joy, K. W. (1985)
Transaminases, John Wiley and Sons, New York.
43.Bulos, B., and Handler, P. (1963) Abst. Amer.
Chem. Soc. Meet., New York.
44.Velick, S. F., and Varva, J. (1962) J. Biol.
Chem., 237, 2109-2122.
45.Hopper, S., and Segal, H. L. (1962) J. Biol.
Chem., 237, 3189-3195.
46.Parich, D. L. (1979) Methods in Enzymology
(Enzyme Kinetics and Mechanism), Academic Press, San Francisco.