Genetic Structure of the Salvelinus Genus Chars from Reservoirs of the Kuril Islands
E. A. Shubina1*, E. V. Ponomareva1, and O. F. Gritsenko2
1Belozersky Institute of Physico-Chemical Biology, Lomonosov Moscow State University, 119992 Moscow, Russia: fax: (495) 939-3181; E-mail: shubina@genebee.msu.su2All-Russian Institute of Fisheries and Oceanography, ul. Verkhnyaya Krasnosel'skaya 17, 107140 Moscow, Russia
* To whom correspondence should be addressed.
Received September 4, 2007
Genetic resemblance of chars Salvelinus alpinus krasheninnikovi (Salvelinus malma krasheninnikovi) of 35 samples collected in five Kuril Islands--Shumshu, Paramushir, Onekotan, Iturup, and Kunashir--has been studied by the PCR-RAPD method. In the limits of each island, both resident isolates and anadromous forms give strictly supported clusters distinct from samples from the other islands. The samples from five islands form three superclusters: the first from Kunashir and Iturup Islands, the second from Paramushir and Onekotan Islands, and the third from Shumshu Island. The possible reasons for genetic similarity of resident and anadromous forms of Dolly Varden chars inhabiting reservoirs of a definite island are considered (the founder effect, homing, limited migration).
KEY WORDS: PCR-RAPD, Dolly Varden chars, Kuril Islands, cluster analysisDOI: 10.1134/S0006297907120073
Abbreviations: mtDNA) mitochondrial DNA; PCR) polymerase chain reaction.
Dolly Varden char (Salvelinus malma W) inhabiting the Kuril
Islands is now considered by the majority of taxonomists to be either
an independent species of chars or a group of forms in the limits of a
complex species Salvelinus alpinus - malma complex [1, 2]. Chars are one of the most
widespread groups in the northern Pacific and possibly the worst
studied representatives of the Salvelinus genus. Based on
morphological features [3-6]
and results of genetic analysis of mitochondrial DNA (mtDNA) [7, 8], nucleotide sequences of the
nuclear ribosomal gene spacers [9], and analysis of
allozymes [10], Dolly Varden chars inhabiting
reservoirs of the Russian Far East are now subdivided mainly into the
northern S. a. malma (S. m. malma) and southern S. a.
krasheninnikovi (S. malma krasheninnikovi) varieties.
However, a proviso is made concerning an uncertainty of the taxonomic
status of the southern Dolly Varden chars and the divergence depth
between the northern and southern forms [11].
According to a viewpoint based on the incidence of different haplotypes
of mtDNA [12], a morphologically similar group of
chars species includes as independent species the southern Asian Dolly
Varden chars S. curilus (Pallas, 1814), the typical Dolly Varden
chars S. malma, and also some related species of chars. Dolly
Varden chars inhabiting water basins of the Kuril Islands became an
object of systematic studies only recently. Numerous forms were
described including both anadromous and isolated resident forms from
streams, rivers, and lakes [13-18]. The existence in reservoirs of the northern
Kuril Islands of self-reproducing stream and river chars isolated from
anadromous ones was reported. Some isolates were strongly specified by
phenotypic characters. Thus, a form from the Bolshoe Chernoe Lake was
discriminated from the anadromous and river Dolly Varden chars and from
other lake chars from the Paramushir Island but resembled both some
forms of chars from the Asian coast of the Pacific and American S.
confluentis, S. namaycush, and S. fontinalis [19]. On the other hand, different forms of chars from
reservoirs of the same island were concluded to be closer
phenotypically than the same form chars from reservoirs of different
islands [20]. Population genetics analysis of the
southern form of Dolly Varden chars from the eight largest Kuril
Islands based on allozyme markers revealed the absence of correlation
between the genetic structure and geographical location of the
population [21]. The supported clusters joined
chars from Paramushir and Iturup, on one hand, and from Onekotan and
Kunashir, on the other hand. Chars from Shumshu Island formed a
separate branch. The incidence distribution of alleles of some loci
suggests that the northern form should be present on Shumshu Island.
The present work has strictly confirmed the closeness of all forms of Dolly Varden chars in the limits of one island on the basis of molecular genetics data obtained by polymerase chain reaction with random primers (PCR-RAPD) applied for a large number of anadromous and resident forms of S. alpinus krasheninnikovi from the whole area of interest.
MATERIALS AND METHODS
Northern and Southern Kuril Dolly Varden chars were collected in expeditions organized by the All-Russian Institute of Fisheries and Oceanography in 2000-2001. The material to be studied was presented as preparations of milt and liver. The samples are described in Table 1. Figure 1 shows the schematic map of the material collection.
Table 1. Geographical location of Dolly
Varden char samples
Char tissues were lysed with guanidine thiocyanate, and the genomic DNA was isolated by sorption on a solid carrier (DiatomTM kit DNAPrep 100; Laboratory IsoGen, Russia) according to recommendations of the producer. The DNA yield was on average 0.5-1 µg in 5 µl of solution. Polymerization of the isolated preparations was monitored by electrophoresis in 0.6% agarose. The DNA preparations were of 40-50 kb in size and satisfied PCR requirements.Fig. 1. A schematic map of localities of Dolly Varden char samples. The numbers correspond to the preparation numbers in Table 1.
The approach used in this work is based on random amplification of relatively short DNA sequences, which are later fractionated by electrophoresis in agarose or polyacrylamide gel [22, 23]. We used a PCR modification [24] with combination of two random 20-nucleotide primers. We tested 91 combinations of primers, and 15 were chosen for the further work. The primers were chosen based on the presence of at least one polymorphic fragment produced by PCR. The primer sequences are presented in Table 2, as well as the fragment sizes, which with a few exceptions were common for all samples of Dolly Varden chars. The reproduction of this set of fragments in every corresponding reaction for all samples served as an inner control of the reproducibility.
Table 2. Sequences of oligonucleotide
primers used in PCR-RAPD reactions and sizes of the main fragments
(bp), which determine the electrophoretic separation profiles of
products of corresponding reactions
*One primer was used in the reaction.
The reactions were performed in 25 µl of 0.01 M Tris-HCl (pH 8.3) containing 0.05 M KCl, mixture of four dNTP (0.2 mM each), 5.5 mM MgCl2, the corresponding pair of primers (Table 2) (5 pmol each), Taq polymerase (Dialat, Russia) (2 activity units), and ~20 ng DNA under analysis [25]. DNA preparations were diluted immediately before the experiment. Purity of the primers and DNA templates were monitored as required. PCR was performed by the following program: 95°C - 2 min; three cycles: 94°C - 45 sec, 50°C - 30 sec, 72°C - 30 sec; and 35 cycles: 94°C - 45 sec, 60°C - 30 sec, 72°C - 30 sec.
The reaction products were separated by electrophoresis for 3.5 h in horizontal 1.8% agarose gel (type II agarose; Sigma, USA) in TBE buffer in the presence of ethidium bromide at 7 V/cm. Electrophoresis of 40-65 preparations separated in the same field was conducted concurrently.
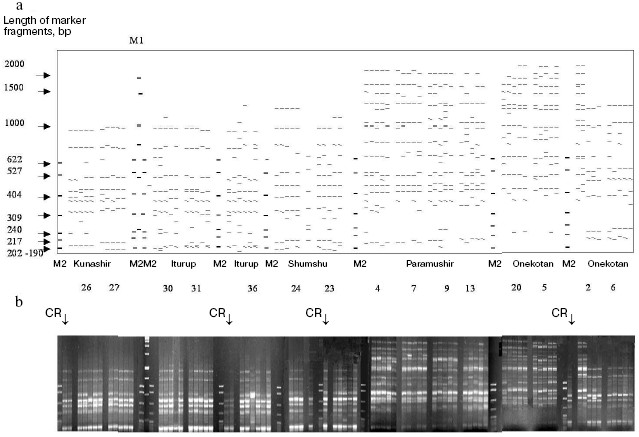
To increase the reproducibility of results, many technical regimens were used. All amplification reactions with a particular pair of primers were conducted synchronously from the same dilution (300-400 reactions per day). PCR was performed using a “hot start” method with Taq polymerase associated with antibodies, and this allowed us to avoid differences between specimens mixed in the beginning and end of the experiment. Each reaction was performed in duplicate. Similarity of temperature regimens in the thermocycler cells was controlled; the same type tubes and the same batch of reagents were used for PCR and electrophoretic separation of the fragments. Considering results of previous experiments, scrupulous attention was paid to observation of similar quantitative relationships between DNA templates and primers. All DNA preparations used in this work were prepared once, i.e. had a definite polymerization, concentration, and purification degree. Thus, the quantitative relationships in the reactions were standardized, and reproducibility in the repeated experiments reached 100%. The reaction products were separated in the same electric field, separately for collections from different islands. The relatively small samples from Kunashir and Iturup Islands were analyzed in one experiment. It was impossible to compare the samples from all islands in the same gel because the total width of the specimens under analysis would be about 1 m. In this case, the gels were compiled using cross specimens introduced into every band of each electrophoresis (Fig. 2).
The gel photographs were edited (aligned) using the Adobe Photoshop 7.0 program. The fragments were typed and their sizes were determined with the Gel-Quant Electrophoresis Software program (Free Trial, http://www.ampl.com.au/gq_frames.htp) with additional manual correction. Fragments to be analyzed were chosen automatically using the Gel-Quant program upon settling a definite level of sensitivity. The fragment size was determined, and the data were tabulated. The set of chosen fragments presented a pattern. The binary matrix of the character state was composed by principle of the presence or absence of a fragment with the same electrophoretic mobility. The data were processed in several stages: analysis of the whole collection of resident forms, analysis of all anadromous forms, and the joint analysis of anadromous and resident forms from every island. On analyzing anadromous and resident forms from every island in the summarized and joined sample of resident chars, the tabulation was performed using the Gel-Quant program. In the latter case up to 731 characters were analyzed. The summarized sample of anadromous forms was tabulated manually, and the number of characters was 340. This discrepancy was caused by the higher sensitivity of the program than of the visual estimation. An electrophoretic pattern is exemplified in Fig. 2, as well as the corresponding schematic map.Fig. 2. Electrophoregram of PCR-RAPD products from resident forms of Dolly Varden chars from the Kuril Islands with the 43sm primer pair. M1 and M2 are markers of molecular weight: M1) 2000, 1500, 1000, 750, 500, and 250 bp; M2) 622, 527, 404, 309, 240, 217, and 202 bp. a) Compiled schematic map of the agarose gel, numbers indicate sample numbers. b) Combined picture of electrophoretic separation. Vertical arrows indicate cross reactions (CR) (not presented in panel (a)).
Cluster analysis with constructing dendrograms was performed by the distant Neighbor-Joining (NJ) approach [26]. Pairwise genetic distances between patterns were calculated according to the method of Nei and Li [27]. This method is based on calculation of the Chekanowsky similitude index S or distance D = 1 - S calculated by the formula:
S = 2nab/(na + nb),
where na is the number of bands in pattern a, nb the same in pattern b, and nab are bands present in the patterns of both specimens under comparison. Distant trees were constructed using the TREECON 1.3b program [28]. During the alternative cladistic analysis (designing of maximally economical MP-trees) the number of steps is accounted, which is necessary for the transition 0 (“no band”) into 1 (“band is present”) in the binary matrix of characters, or Wagner parsimony (PAUP: http://www.lms.si.edu/PAUP/). Dollo parsimony also takes into account the back transition. MP-Trees were constructed using MIX, DOLLOP, and CONSENCE programs from the PHYLIP 3.6 program package.
In both cases, node stability was tested by bootstrap analysis [29], and not samples but characters were estimated.
RESULTS
Analysis of samples from different islands. Considering the repeated experiments, in total about 5300 PCR runs were performed. For chars from Onekotan Island 320 characters and for those from Shumshu Island 540 characters were analyzed.
Separate analyses of samples from every island revealed some common features. Alongside with “profile” bands common for all reactions (Table 2), there was a pronounced polymorphism of “additional” bands in both between samples and in the limits of each sample. However, in the system of markers used by us there were no “diagnostic” bands, i.e. monomorphic bands inherent in only one sample. Because of small size of the samples (on average, about five) due to small size of stream populations, we could not quantitatively estimate individual characters in each sample. Figure 3 (a-d) presents generalized genetic distances as scaled non-rooted NJ-dendrograms for resident and anadromous samples from different islands.
All samples from Paramushir Island described earlier as resident forms on the basis of geographical considerations and morphological characters demonstrate isolation from the other samples (bootstrap indices are 46-96%). Thus, genetic isolation of each of these samples is proved. All samples from Paramushir Island (Fig. 3a) formed two stable (70% bootstrap support) clusters, one of which included four of five resident forms analyzed, and the other included anadromous forms. The cluster of anadromous forms also involves resident chars from Bolshoe Chernoe Lake, which form an isolated group within the cluster. This seems to be explained by later penetration of anadromous chars into Bolshoe Chernoe Lake.Fig. 3. NJ-Dendrogram of resident and anadromous forms of Dolly Varden chars constructed on Nei and Li genetic distances with rooting by the middle point. Denominations of the branches contain numbers of the sample and individual in accordance with Table 1. In the branching nodes, bootstrap indices higher than 30 are indicated. Genetically isolated clusters of resident forms are distinguished. For each tree the number of characters analyzed is presented: Paramushir Island - 436 characters (a), Onekotan Island - 320 characters (b), Iturup and Kunashir Islands - 345 characters (c), Shumshu Island - 540 characters (d).
Two stream and two lake samples from Paramushir Island tended for joining into the “stream” and “lake” clusters with weak support of 39 and 37% bootstrap, respectively (Fig. 3a). In the cluster of “anadromous chars”, there were no well-supported groups, save the sample from Bolshoe Chernoe Lake. The greatest genetic polymorphism was revealed in anadromous Dolly Varden chars from Pokoi River (Paramushir Island) (Table 1, sample 14). This was because two individuals from the sample had nearly twice longer genetic distances expressed by the branch length than the other individuals (Fig. 3a).
Eight samples from Onekotan Island (Fig. 3b) were distributed similarly into clusters of mainly resident forms (all from the Sea of Okhotsk side of the island) and anadromous forms. But the statistical support of these clusters is weak (34% bootstrap). Similarly to chars from Paramushir Island, genetic isolation was confirmed for resident forms from Onekotan Island: for chars from Marshuk stream and Anechkin stream it was supported by 72 and 100% bootstrap, respectively. Two forms of chars from Fontanka stream, the resident form (No. 5) inhabiting the upper stream and the anadromous form (No. 20) spawning in the lower stream separated by a geographical obstacle (waterfall), are combined (bootstrap index is 47-50% for different approaches in constructing the tree). This could be a consequence of a recent separation of the populations, or, more likely, the genetic relation could be ensured by one-sided flow of genes from the resident form. The other populations of anadromous chars failed to enter in the dendrogram groups, which would not correspond to the samples (Nos. 3, 10, 15, 17). This could be associated with insolvability in the system of markers used or, more likely, with absence of isolation of anadromous fishes from different streams on Onekotan Island.
Southern Kuril chars were represented by four samples from Kunashir Island and seven samples from Iturup Island (in total 45 fishes), and of the anadromous forms, one was represented by a single individual and another by two individuals (Table 1). These minimal samples were also taken into account on analysis. Products of all 45 PCR for a given primer pair were separated synchronously in the same electric field. Figure 3c presents results of cluster analysis of these char samples. Similarly to the samples from Paramushir and Onekotan Islands, only resident forms displayed genetic isolation in all samples, save the samples from Sopochnoe Lake, Kumushka River, and from Above Waterfall River: one individual from these samples fell in the dendrogram into other groups. As a whole, the insular populations from Kunashir and Iturup Islands appear more uniform than chars from Paramushir and Onekotan Islands. Measurement of genetic distances (taking into account the scale) to the hanging nodes representing resident forms in the dendrograms (Fig. 3, a and c) indicates that these differences for chars from Kunashir and Iturup Islands are, on average, 14.4% less than for chars from Paramushir Island. Possibly, the lower number of informative (distinguishable) characters is an explanation of the less strict support on analyzing the genetic isolation of each sample of resident forms. By results of our analysis, anadromous and semi-anadromous forms from Kunashir and Iturup Islands do not join into groups corresponding to the geographical source of the samples.
As a whole, chars inhabiting reservoirs of Kunashir and Iturup Islands subdivided into separate clusters detectable in 42% of the trees on resampling (Fig. 3c). Every cluster is represented by both resident and anadromous forms.
The material on chars from Shumshu Island had another structure. From seven samples, only one presented the form that had been described as a stream-lacustrine isolate from Yuzhnyi stream. But, as discriminated from the resident forms of the above-considered islands, it did not form an isolated cluster (Fig. 3d) but joined (with 94% bootstrap index) with anadromous chars from the neighboring Yudin stream. Thus, this form is not a genetic isolate.
Some other samples of anadromous chars from Shumshu Island displayed relative genetic isolation. Such were a sample from Ostrozhnaya River (isolation was observed in 86% bootstrap), prespawning sample No. 8 from Bettobu River (30% bootstrap), and prespawning sample No. 18 from Bettobu river (99% bootstrap) made with a few day interval with respect to the previous sample. Several relatively big rivers drain into Bettobu Lake, and essentially every river can be a place for reproduction of an independent population of chars. As to Bettobu River, it is a short channel connecting the lake with the Sea of Okhotsk. Two char samples (Nos. 8 and 18) taken in the mouth of this river fall into different clusters (Fig. 3d). More likely, this phenomenon can be explained by occurrence into samples Nos. 8 and 18 of individuals from different rivers falling into Bettobu Lake. However, the cluster containing a complete sample No. 18 from Bettobu River includes two individuals from sample No. 24 (Yudin stream). This may be interpreted as a result of a lack of strict homing of anadromous chars within the same island. Despite the presence in the dendrogram of mixed clusters similar to the above-considered one, in Shumshu Island there are separate groups well isolated genetically (as differentiated from Paramushir and Onekotan Islands). We think that this suggests a genetic heterogeneity of the populations studied. A significant difference in the length of branches corresponding to genetic distances (on average to 50%) between individuals from Shumshu Island and other samples on the scaled insular dendrograms also supports this hypothesis. These results also do not contradict data on protein markers [21].
General genetic structure of Dolly Varden char populations from the Kuril Islands. To evaluate the divergence of Dolly Varden char genomes in the whole area under investigation, 16 samples were chosen which mainly represented isolated resident forms of stream, lake, and river chars (Fig. 4a). In addition to the isolates, under analysis were anadromous chars from Fontanka stream (No. 20, Onekotan Island) of the same water system with sample No. 5 and the anadromous chars from Yudin stream, which gave a close group with a resident stream-lacustrine form (sample No. 23). The matrix included 731 characters for 76 individuals.
By results of the analysis, the entire joined sample is disintegrated into three statistically reliable clusters corresponding to geographical location. These are clusters of southern Kuril Islands (Iturup and Kunashir Islands), of northern Kuril Islands (Paramushir and Onekotan Islands), and of Shumshu Island separately. The further branching follows the strict hierarchy by the “insular” principle. In other words, first of all the samples from the water system of the same island are grouping, then the samples from the inner region of the island with similar ecological conditions (e.g. the cluster of stream and the cluster of lake chars from Paramushir Island). This topology manifests itself at both the distant NJ and cladistic analysis (maximum economy method) and is highly supported statistically (Fig. 4, a and b). Morphological differences between Dolly Varden chars from the southern and northern Kuril Islands were also recorded earlier [30, 31].Fig. 4. Summarized non-rooted trees of resident forms of Dolly Varden chars from the Kuril Islands. Designations are the same as in Fig. 3. The analysis embraced 731 characters. The NJ dendrogram is based on Nei and Li genetic distances (a). The unscaled MP-tree is based on Wagner parsimony (b). The bootstrap indices are presented completely.
A similar topology although lacking such high support was also obtained for samples of anadromous chars (Fig. 5, a and b). Similarly to the tree of the resident forms, superclusters of the northern Kuril Islands, the southern Kuril Islands, and the separate cluster of Shumshu Island are distinguished. The “insular” principle of further hierarchic division of superclusters is mainly retained also for anadromous Dolly Varden chars. An exception is represented by results of NJ analysis with respect to the southern Kuril Islands where a cluster is formed only by samples from Kunashir Island (Fig. 5a). However, cladistic analysis confirms the isolation of samples of Iturup Island anadromous chars from the samples of Kunashir Island chars (Fig. 5b).
Fig. 5. Summarized non-rooted trees of anadromous forms of Dolly Varden chars from the Kuril Islands. The analysis embraced 340 characters. The distant NJ dendrogram (a). Designations are the same as in Fig. 3. The unscaled MP-tree is based on Dollo parsimony. Sample numbers are designated. The bootstrap indices are shown only for the main clusters (b).
DISCUSSION
Possibilities and reproducibility of RAPD. The main possibility presented by the RAPD method is direct comparison of DNA of individuals or their samples. Thus, RAPD can be used as an approach of population genetics and systematics at the species and intraspecies taxonomic level.
As compared with other methods of population analysis, e.g. analysis of allozymes, RAPD is specified by some features. It is advantageous due to accounting of a very great number of characters. However, RAPD belongs to the so-called dominant markers. On estimation of genotypes, RAPD does not discriminate between a dominant homozygote and heterozygote, whereas it is realized by codominant, e.g. allozymatic, markers. Moreover, different alleles in RAPD can manifest themselves not only by the presence/absence of the band but also by change in the electrophoretic mobility that virtually prevents their accounting as allelic variants of the same locus. Consequently, it is impossible to calculate the incidence of alleles as it is accepted on the analysis of allozymes. Some authors [32, 33] have proposed some corrections in order to calculate for RAPD traditional parameters of population genetics, but we believe that a direct estimation of electrophoretic bands as individual characters at the distant or cladistic analysis is more adequate. In this case, the homology of DNA fragments with the same electrophoretic mobility is the only assumption. It was earlier shown that in intraspecies studies the homology between the comigrating RAPD fragments was up to 95% and seldom decreases below 85% [34, 35]. RAPD analysis results in a tree of genetic distances, or cladogram.
Bad reproducibility of PCR results is considered to be a shortcoming of RAPD. The instability of PCR with random primers is emphasized by some authors [36]. Nevertheless, this approach still remains one of the most frequently used [37]. We think that RAPD is popular not only due to its relative simplicity and availability but also because the irreproducibility of RAPD is slightly exaggerated. No doubt, there are some technical requirements for using this method. Some of them we have considered in Materials and Methods, and they are quite obtainable. More likely, our analysis of Kuril chars induces a question about insufficient resolving power (polymorphism) of the markers used. Only 15 primers of 91 primer pairs occurred suitable for discrimination. In the other 76 combinations, electrophoretic patterns were completely similar.
We think that the reconstructed genetic structure of the populations studied is itself proof of objectivity of the findings of the present work. The genetic isolation of the isolates detected by us, as well as clusterization of the samples within the islands, speak just in favor of stability of the PCR results and their repeatability from one specimen to another. These results are not associated with mistakes at the typing, because mixed insular summarized resident and anadromous forms have been analyzed separately and by different approaches.
Statistical assessment of RAPD analysis certainty. The bootstrap procedure is an adequate approach for statistical assessment of the node certainty of dendrograms or cladograms constructed from different data including RAPD. The bootstrap coefficient indicates the percent of trees in which a cluster under consideration is retained on resampling, i.e. on multiply repeated random sampling of characters from their general totality. Initially Felsenstein [29] proposed considering as “certain” nodes with 95% bootstrap, but later he determined this level to be 85% [38]. But soon this requirement was found to be too rigorous, and now nodes with more than 50% bootstrap are often believed to be well supported [39]. Many authors beginning from Hillis and Bull [40] attempted to convert with mathematical justification statistical evaluations of the node stability of differently constructed trees (bootstrap, jacknife, Bremer coefficient, Bayesian posterior probability) into limits of the 95% confidence interval. Such conversions are usually performed on multiply generated computerized “evolution” (which as a result becomes known), and erroneously reconstructed nodes can be discriminated from the true ones. At present, the empirical correlation of 70% bootstrap and 95% interval is most widely assumed [41]. But this correlation is true only at normal or close to normal distribution of variables used in the computerized generation of evolution. In the case of RAPD, the distribution of distances does not follow any law; therefore, we think that a quantitative comparison with the confidence interval is incorrect. Moreover, as a result of working for many years with different DNA fingerprints we dispose empirical observations about a slightly underestimated bootstrap coefficient for the same groups under comparison in the RAPD analysis, as compared to AFLP or RFLP (amplification or restriction fragment length polymorphism). In the present work, we consider as supported only those nodes that are reproduced on different approaches for constructing the tree, even if their bootstrap indices are slightly lower than 50%.
Genetic relations of Dolly Varden char populations from the Kuril Islands. The northern Kuril Islands are inhabited mainly by small semi-anadromous chars not going far into the sea, and no anadromous forms have been described up to recent times for the southern Kuril Islands [17]. The absence of typical anadromous forms seems to make difficult gene exchange between the populations [13]. On the other hand, single anadromous individuals of northern Dolly Varden have been found within the area of the southern Dolly Varden char [42] and also the northern variant of mtDNA seldom occurring on Kunashir Island [43]. Therefore, the inherent in Kuril chars clonal variability in meristic characters may be explained by introgressive hybridization [12, 17]. Having in mind scanty insular populations, even a small migration can influence their gene pool. Thus, at present, data on the status of populations of chars from the Kuril Islands are rather contradictory.
An important result of the present work is the experimental proof of a noticeable genetic divergence of chars inhabiting different islands of the Kuril ridge. This fact, which is quite regular for resident isolates, was also shown for anadromous fishes. Chars anadromous within every island are in essence insular isolates on consideration in the limits of the whole Kuril ridge, and the resident and anadromous forms make unified groups of genotypes. Subpopulations of separate resident forms, as a rule, can be distinguished within every island.
Theoretically, the genetic isolations of Dolly Varden chars from separate islands may be associated with two different reasons: a genetic drift in the insular populations saved in isolated refugiums from the preglacier period [3, 5] or “the founder effect”, i.e. occupying the islands by individual anadromous fishes that would result in selected shifting of the allele incidence [21]. The genetic isolation of Dolly Varden chars from separate islands was earlier reported by Omelchenko et al. [21], but no correlation was found between the genetic resemblance and geographical distances between the populations. In the present work a reliable closeness is shown by different approaches between Dolly Varden chars from the northern Kuril Islands (Paramushir and Onekotan Islands) and those from the southern Kuril Islands (Iturup and Kunashir Islands) joining into two superclusters. We attribute this difference to the greater number (731) of characters analyzed in the present work as compared to their work [21] (51 alleles for 20 polymorphic loci). Our data allow us to exclude the drift or the founder effect as pure factors and show the influence of a limited gene flow between the neighboring islands. Our analysis simultaneously involves both resident and anadromous forms, and this allows us to somewhat clarify this question, as it will be shown below.
Separate samples of anadromous forms within the island did not, as a rule, form stable clusters. This is in agreement with a lack of strict homing described for the southern Dolly Varden chars [44]. Our data indicate that anadromous chars migrate not only within the island but also between the islands: clusters of the anadromous forms corresponding to the islands were supported at the statistically significant lower level (compare Fig. 4, a and b, and Fig. 5, a and b). If the anadromous fishes did not migrate between the islands, they would be isolated similarly to the resident forms. However, the intensity of gene flow between the islands is not sufficiently strong to join them into a unified genetic pool.
At least, the resident forms inhabiting different geographical points of Paramushir and Onekotan Islands are genetically closer to one another than to anadromous forms from the neighboring or even the same water systems. Therefore, these residents are suggested to be a kind of main body of insular chars which are descendents either of preglacial relicts or of precedent lodgers of the islands (here these two possibilities are indistinguishable) with which immigrants replenishing the pool of the insular anadromous chars are mixing continuously. The mixing of anadromous and resident forms in the limits of the same water system is exemplified by Fontanka stream (Fig. 3b). On comparing the statistical support of the resident sample from Fontanka stream within the summarized insular, summarized resident, and summarized anadromous (into which it is also included) samples (Figs. 3b, 4a, 4b), it is obvious that it is also mixed with other anadromous chars of the island, and this mixing seems to be mediated by the anadromous population of the stream. Anadromous immigrants can generate secondary resident forms, as occurs in Bolshoe Chernoe Lake on Paramushir Island (Fig. 3a). On Kunashir and Iturup Islands where anadromous forms are rarer, there is no subdivision into “resident main body” and “anadromous envelope”: obviously, the mixing occurs in the limits of many water systems of these islands.
Shumshu Island is slightly specific among the other Kuril Islands. By genetic distances and tree topology, chars from Shumshu Island form a separate cluster equivalent to the clusters from the northern and southern Kuril Islands. Shumshu Island is also additionally specified by differentiation of anadromous chars into several isolated groups (Fig. 3d). The genetic differentiation of anadromous Dolly Varden chars from Shumshu Island can be associated with overlapping of areas of two forms: S. alpinus malma and S. alpinus krasheninnikovi [13]. Based on shifting of distribution of alleles of allozyme loci, Omelchenko et al. [21] concluded that the northern form should inhabit Shumshu Island. Data on mtDNA are also in favor of this conclusion [12]. This hypothesis could not be tested in the present work because we had no sample of northern Dolly Varden char.
The PCR-RAPD analysis of genomic DNA of different resident and anadromous forms of Salvelinus alpinus krasheninnikovi Tarenetz from reservoirs of the Kuril Islands has shown a strict correlation between the genetic structure and geographical location of the populations. Different forms of Dolly Varden chars from the water system of the same island are shown to be more genetically uniform than similar ecological forms from different islands. The samples from five islands form five supported clusters which in turn join into three superclusters: Paramushir and Onekotan Islands, Iturup and Kunashir Islands, and Shumshu Island. Dolly Varden chars from Shumshu Island are found to be not genetically uniform. This finding seems to indicate a possible overlapping (at present or earlier) of areas of the southern and northern forms of Dolly Varden chars.
We are grateful to V. M. Stygar, A. K. Gruzevich, and E. V. Vedishcheva (All-Russian Institute of Fisheries and Oceanography) and to M. Yu. Pichugin (Chair of Ichthyology, Moscow State University) for collecting the material, and to K. A. Savvaitova for her interest in the work and valuable consultations. We are grateful to A. K. Gruzevich for designing the schematic map of the material collection. This article would have been impossible without discussion and work together with V. V. Aleshin on the final edition of the text.
This work was supported by the All-Russian Institute of Fisheries and Oceanography and the Russian Foundation for Basic Research (projects 01.04-48613 and 00-15-97905).
REFERENCES
1.Savvaitova, K. A. (1995) Nordic J. Freshw.
Res., 71, 81-91.
2. Shubina, E. A., Ponomareva, E. V., and Gritsenko, O. F. (2006)
Russ. J. Gen. Biol., 67, 280-297.
3. Taranets, A. Ya. (1936) Trudy Zool. In-ta Akad. Nauk
SSSR, IV, 483-537.
4.Berg, L. S. (1948) Fishes of the USSR and
Neighboring Countries Fresh Waters [in Russian], Pt. 1, Academy of
Sciences of the USSR, Moscow-Leningrad.
5.Gritsenko, O. F. (1975) Trudy VNII Rybnogo
Khozyaistva i Okeanografii, 106, 141-160.
6.Behnke, R. J. (1984) in Biology of the Arctic
Charr (Johnson, L., and Burns, B. L., eds.) University Manitoba
Press, Winnipeg, pp. 3-21.
7.Oleinik, A. G., Skurikhina, L. A., Frolov, S. A.,
Brykov, V. A., and Chereshnev, I. A. (2004) Environ. Biol.
Fish., 69, 449-459.
8.Oleinik, A. G., Skurikhina, L. A., Brykov, V. A.,
Krein, P. A., and Venburg, J. K. (2005) Russ. J. Genet.,
41, 501-508.
9.Phillips, R., Gudex, L., Westrich, K., and DeCicco,
A. (1999) Can. J. Fish Aquat. Sci., 56, 1504-1511.
10.Salmenkova, E. A., Omelchenko, V. T., Kolesnikov,
A. A., and Malinina, T. V. (2000) J. Fish Biol., 57
(Suppl. A), 136-157.
11.Behnke, R. J. (1989) Physiol. Ecol.
Jap. Spec., 1, 35-48.
12.Shedko, S. V., Ginatulina, L. K., Miroshnichenko,
I. L., and Nemkova, G. A. (2007) Russ. J. Genet., 43,
165-176.
13.Gritsenko, O. F., Savvaitova, K. A., Gruzdeva, M.
A., and Kuzishchin, K. V. (1998) J. Ichthyol., 38,
228-237.
14.Gritsenko, O. F., Savvaitova, K. A., Gruzdeva, M.
A., and Kuzishchin, K. V. (1999) J. Ichthyol., 39,
226-232.
15.Gritsenko, O. F., Pichugin, M. Yu., and
Dem'yanov, T. V. (2002) J. Ichthyol., 42, 368-376.
16.Savvaitova, K. A., Gruzdeva, M. A., Kuzishchin,
K. V., and Stygar, V. M. (2001) J. Ichthyol., 41,
1-14.
17.Shedko, S. V. (2002) in Plants and Animals of
the Kuril Islands (Materials of the International Kuril Project)
[in Russian], Dalnauka, Vladivostok, pp. 118-134.
18.Pichugin, M. Yu., Sidorov, L. K., and Gritsenko,
O. F. (2006) J. Ichthyol., 46, 369-382.
19.Savvaitova, K. A., Gritsenko, O. F., Gruzdeva, M.
A., and Kuzishchin, K. V. (2000) J. Ichthyol., 40,
704-723.
20.Savvaitova, K. A., Gruzdeva, M. A., Kuzishchin,
K. V., Gritsenko, O. F., and Stygar, V. M. (2004) J. Ichthyol.,
44, 82-93.
21.Omelchenko, V. T., Salmenkova, E. A., and Shedko,
S. V. (2002) Russ. J. Genet., 38, 1181-1188.
22.Williams, J. G. K., Kubelik, A. R., Livak, K. J.,
Rafalski, J. A., and Tingey, S. V. (1990) Nucleic Acids Res.,
18, 6531-6535.
23. Williams, J. G. K., Hanafey, M. K., Rafalski, J. A., and
Tingey, S. V. (1993) Meth. Enzymol., 218,
704-740.
24. Welsh, I., and McClelland, M. (1991) Nucleic Acids
Res., 19, 5275-5279.
25.Von Beroldingen, C. H., Blake, E. T., Higuchi,
R., Sensabaugh, G. F., and Erlich, H. (1989) in PCR Technology:
Principles and Applications for DNA Amplification (Erlich, H. A.,
ed.) Stockton Press, New-York, pp. 209-223.
26.Saitou, N., and Nei, M. (1987) Mol. Biol.
Evol., 4, 406-425.
27.Nei, M., and Li, W.-H. (1979) Proc. Natl.
Acad. Sci. USA, 76, 5269-5273.
28.Van de Peer, Y., and de Wachter, R. (1994)
Comput. Appl. Biosci., 10, 569-570.
29.Felsenstein, J. (1985) Evolution,
39, 783-791.
30.Glubokovskii, M. K. (1995) Evolutionary
Biochemistry of Salmonides [in Russian], Nauka, Moscow.
31.Nikiforov, S. N., Makeev, S. S., and Belovolov,
V. F. (1993) Vopr. Ikhtiol., 33, 500-510.
32.Lynch, M., and Milligan, B. G. (1994) Mol.
Ecol., 3, 91-99.
33.Zhivotovsky, L. A. (1999) Mol.
Ecol., 8, 907-913.
34.Reiseberg, L. H. (1996) Mol. Ecol.,
5, 99-105.
35.Wu, J., Krutovskii, K. V., and Strauss, S. H.
(1999) Genome, 42, 893-908.
36.Ferguson, M. M., and Danzmann, R. G. (1998)
Can. J. Fish. Aquat. Sci., 55, 1553-1563.
37.Sliva, E. P., and Russo, A. M. (2000)
Hydrobiologia, 420, 119-135.
38.Felsenstein, J., and Kishino, H. (1993) Syst.
Biol., 42, 193-200.
39.Marvaldi, A. E., Sequeira, A. S., O'Brien, C. W.,
and Farelli, B. D. (2002) Syst. Biol., 51, 761-785.
40.Hillis, D. M., and Bull, J. J. (1993) Syst.
Biol., 42, 182-192.
41.Zander, R. H. (2004) Phyloinformatics,
2, 1-13.
42.Ishigaki, K. (1969) Bull. Biogeogr. Soc.
Japan, 24, 37-43.
43.Ginatulina, L. K., Shedko, S. V., Ginatulin, A.
A., and Miroshnichenko, I. L. (2000) in Biodiversity and Dynamics of
Ecosystems in North Eurasia, Vol. 1, Pt. 3, IC&G, Novosibirsk,
pp. 40-41.
44.Armstrong, R. H., and Morrow, J. E. (1980) in
Charrs: Salmonide Fishes of the Genus Salvelinus (Balon, E. K.,
ed.) Dr. W. Junk Publisher, Hague, pp. 99-140.