Mitochondria-Targeted Plastoquinone Derivatives as Tools to Interrupt
Execution of the Aging Program.
1. Cationic Plastoquinone Derivatives:
Synthesis and in vitro Studies*
Y. N. Antonenko1, A. V. Avetisyan1, L. E. Bakeeva1, B. V. Chernyak1, V. A. Chertkov2, L. V. Domnina1, O. Yu. Ivanova1, D. S. Izyumov1, L. S. Khailova1, S. S. Klishin1, G. A. Korshunova1, K. G. Lyamzaev1, M. S. Muntyan1, O. K. Nepryakhina1, A. A. Pashkovskaya1, O. Yu. Pletjushkina1, A. V. Pustovidko1, V. A. Roginsky3, T. I. Rokitskaya1, E. K. Ruuge4, V. B. Saprunova1, I. I. Severina5, R. A. Simonyan1, I. V. Skulachev6, M. V. Skulachev6, N. V. Sumbatyan2, I. V. Sviryaeva4, V. N. Tashlitsky2, J. M. Vassiliev1, M. Yu. Vyssokikh1, L. S. Yaguzhinsky1, A. A. Zamyatnin, Jr.6, and V. P. Skulachev1,6,7**
1Belozersky Institute of Physico-Chemical Biology, Lomonosov Moscow State University, 119991 Moscow, Russia; fax: (495) 939-0338; E-mail: skulach@belozersky.msu.ru2Chemical Faculty, Lomonosov Moscow State University, 119991 Moscow, Russia
3Institute of Chemical Physics, ul. Kosygina 4, 119977 Moscow, Russia
4Institute of Experimental Cardiology, Cardiology Research Center, 3-ya Cherepkovskaya ul. 15A, 121552 Moscow, Russia
5Biological Faculty, Lomonosov Moscow State University, 119991 Moscow, Russia
6Mitoengineering Center, Lomonosov Moscow State University, 119991 Moscow, Russia
7Faculty of Bioengineering and Bioinformatics, Lomonosov Moscow State University, 119991 Moscow, Russia
* This and the following four articles were written by the request of the Editorial Board of Biochemistry (Moscow).
** To whom correspondence should be addressed.
Received December 29, 2007; Revision received August 14, 2008
Synthesis of cationic plastoquinone derivatives (SkQs) containing positively charged phosphonium or rhodamine moieties connected to plastoquinone by decane or pentane linkers is described. It is shown that SkQs (i) easily penetrate through planar, mitochondrial, and outer cell membranes, (ii) at low (nanomolar) concentrations, posses strong antioxidant activity in aqueous solution, BLM, lipid micelles, liposomes, isolated mitochondria, and cells, (iii) at higher (micromolar) concentrations, show pronounced prooxidant activity, the “window” between anti- and prooxidant concentrations being very much larger than for MitoQ, a cationic ubiquinone derivative showing very much lower antioxidant activity and higher prooxidant activity, (iv) are reduced by the respiratory chain to SkQH2, the rate of oxidation of SkQH2 being lower than the rate of SkQ reduction, and (v) prevent oxidation of mitochondrial cardiolipin by OH•. In HeLa cells and human fibroblasts, SkQs operate as powerful inhibitors of the ROS-induced apoptosis and necrosis. For the two most active SkQs, namely SkQ1 and SkQR1, C1/2 values for inhibition of the H2O2-induced apoptosis in fibroblasts appear to be as low as 1⋅10-11 and 8⋅10-13 M, respectively. SkQR1, a fluorescent representative of the SkQ family, specifically stains a single type of organelles in the living cell, i.e. energized mitochondria. Such specificity is explained by the fact that it is the mitochondrial matrix that is the only negatively-charged compartment inside the cell. Assuming that the Δψ values on the outer cell and inner mitochondrial membranes are about 60 and 180 mV, respectively, and taking into account distribution coefficient of SkQ1 between lipid and water (about 13,000 : 1), the SkQ1 concentration in the inner leaflet of the inner mitochondrial membrane should be 1.3⋅108 times higher than in the extracellular space. This explains the very high efficiency of such compounds in experiments on cell cultures. It is concluded that SkQs are rechargeable, mitochondria-targeted antioxidants of very high efficiency and specificity. Therefore, they might be used to effectively prevent ROS-induced oxidation of lipids and proteins in the inner mitochondrial membrane in vivo.
KEY WORDS: SkQ1, penetrating cations, plastoquinone, antioxidants, mitochondria, apoptosisDOI: 10.1134/S0006297908120018
Abbreviations: Δψ, transmembrane electric potential difference; AAPH, 2,2′-azobis(2-amidinopropane) dihydrochloride; BLM, bilayer planar phospholipid membrane; BSA, bovine serum albumin; CCCP, carbonyl cyanide m-chlorophenylhydrazone; CM-DCF-DA, 5-(-6)-chloromethyl-2′,7′-dichlorodihydrofluorescein diacetate; C12TPP, dodecyltriphenylphosphonium; DMQ, demethoxy-derivative of CoQ0 lacking one of the methoxy groups; DPQ, decylplastoquinone; FCCP, carbonyl cyanide p-trifluoromethoxyphenylhydrazone; MDA, malondialdehyde; MitoQ, 10-(6′-ubiquinonyl) decyltriphenylphosphonium; NAC, N-acetyl cysteine; PQ, plastoquinone; ROS, reactive oxygen species; SF6846, 3,5-di(tert)butyl-4-hydroxybenzylidene malononitrile; SkQ, cationic derivative of plastoquinone or methyl plastoquinone; SkQ1, 10-(6′-plastoquinonyl) decyltriphenylphosphonium; SkQ2, 10-(6′-plastoquinonyl) decylcarnitine; SkQ2M, 10-(6′-plastoquinonyl) decylmethylcarnitine; SkQ3, 10-(6′-methylplastoquinonyl) decyltriphenylphosphonium; SkQ4, 10-(6′-plastoquinonyl) decyltributylammonium; SkQ5, 5-(6′-plastoquinonyl) amyltriphenylphosphonium; SkQR1, 10-(6′-plastoquinonyl) decylrhodamine 19; TMRE, tetramethylrhodamine ethyl ester; TPB, tetraphenylborate; TPP, tetraphenylphosphonium.
Reactive oxygen species (ROS) are widely known to be dangerous for cells
and organisms. Intramitochondrial ROS are especially damaging because
they are produced in the hydrophobic region of the inner mitochondrial
membrane, initiating free radical-mediated chain reactions of lipid
peroxidation. This decreases the electrical resistance of the membrane
(which normally is very high to avoid H+ leakage and
uncoupling of respiration from ATP synthesis). Moreover, oxidative
damage to mitochondrial DNA, which is localized in close vicinity of
the inner membrane, can occur [1]. Antioxidants
conjugated with membrane-penetrating cations can be used to scavenge
ROS inside mitochondria. This class of ions was described by our group
40 years ago [2]. The charge of the ionized atoms
in such ions is distributed over a large hydrophobic molecule, allowing
penetration through membranes in an electric transmembrane potential
(Δψ)-driven fashion [2-8]. Soon after the discovery of penetrating cations,
we suggested that they might be used as “electric
locomotives” to accumulate non-charged compounds in mitochondria
[7, 9, 10]. Because the mitochondrial matrix is the only
intracellular compartment that is negatively charged, a transported
compound combined with a positively-charged penetrating cation should
be specifically targeted to mitochondria, being accumulated inside the
organelles, according to the Nernst equation, by a factor of 1000 when
mitochondrial Δψ is 180 mV [6, 7]. Following this reasoning, combining an antioxidant
and a penetrating cation might be a way to clean “the dirtiest
place of the cell”, i.e. the ROS-producing mitochondrial
interior.
Recently, the electric locomotive principle was successfully employed by Murphy and Smith to accumulate certain antioxidants inside mitochondria. They synthesized a compound composed of a thiobutyl residue chemically linked to a phosphonium cation [11]. Later, thiobutyl was replaced by alpha-tocopherol [12] and, finally, by ubiquinol to obtain a rechargeable antioxidant (oxidized forms of ubiquinol, appearing as a result of its antioxidant activity, can be converted back to the original reduced form by the mitochondrial respiratory chain) [13]. It was found that the latter compound, called MitoQ, (i) accumulates inside energized mitochondria in a Δψ-dependent fashion, (ii) prevents mitochondrial lipids from being oxidized by OH• in vitro, (iii) facilitates survival of an ROS-hypersensitive cell line at concentrations much lower than those of CoQ or alpha-tocopherol, and (iv) prolongs lifespan of cultivated fibroblasts at high O2 tension [13-18].
Unfortunately, depending on the amount added, MitoQ can also operate as a prooxidant [14, 19, 20], a feature limiting its practical use in vivo in treating, e.g. retinopathies in mice [21] or Friedrich ataxia in humans [22].
The goal of the present work was to find therapeutically useful, rechargeable antioxidants operating without risk of prooxidant side effects. To this end, we decided to use plastoquinone instead of ubiquinone in the cationic antioxidant construct. Plastoquinone operates in the chloroplast electron transfer chain, whereas the mitochondrial electron transfer chain is served by ubiquinone. Why are two different quinones used in the same plant cell? An explanation might be that plastoquinone is a better antioxidant than ubiquinone [23-25]. This feature could be of crucial importance for the oxygen-producing chloroplasts which are exposed to much stronger oxidative stress than oxygen-consuming mitochondria. Moreover, light is likely to produce more singlet oxygen in chloroplasts than in mitochondria because of the much higher light absorbance of these chlorophyll-containing organelles. Acidic pH in the thylakoid interior is also favorable for oxidative stress due to protonation of O2· to much more aggressive HO2•.
We synthesized several plastoquinone derivatives combined with various penetrating ions and tested them in model membranes, mitochondria, cells, and organisms. In this paper, we report that cationic plastoquinone derivatives penetrate planar phospholipid membranes, are electrophoretically accumulated in mitochondria, being practically absent in other cellular compartments, and can be reduced by the respiratory chain. These compounds were coined SkQs where Sk is for penetrating cation (“Skulachev ion”, a term introduced by David Green [8]) and Q is for quinone. In isolated mitochondria, SkQ1 (a member of the SkQ family) was found to operate as a very potent antioxidant protecting (in the nanomolar concentration range) cardiolipin against oxidation by OH•. Micromolar SkQ1, like MitoQ, showed strong prooxidant effect. However, for mitochondria in vivo the “window” between anti- and prooxidant concentrations for SkQ1 fortunately proved to be as wide as about 1000, whereas for its ubiquinone-containing analog MitoQ it was less than 2 under the same conditions. In cell cultures, SkQ1 inhibited H2O2-induced apoptosis at very low (picomolar) concentrations. The same concentrations prevented fission of extended mitochondrial filaments to small roundish mitochondria (“the thread -> grain transition”), induced by H2O2, and stimulated fusion of the majority of the filaments to electrically-united mitochondrial reticulum. (For preliminary communication, see [26].)
MATERIALS AND METHODS
Synthesis of penetrating cations is shown in Fig. 1 and described in Supplementary Information (section 1) presented in the electronic version of this article.
All reagents for cell cultures were from Gibco (USA). Mitotracker Red, Mitotracker Green, CM-DCF-DA (5-(-6)-chloromethyl-2′,7′-dichlorodihydrofluorescein diacetate), and TMRE (tetramethylrhodamine ethyl ester) were from Molecular Probes (USA). The other reagents (if not indicated otherwise) were from Sigma-Aldrich (USA).
Permeability of bilayer phospholipid membrane (BLM). A bilayer phospholipid membrane was formed on a 0.6-mm aperture in a Teflon septum separating the experimental chamber into two compartments. To form BLM, Escherichia coli phospholipids were used (57% phosphatidylethanolamine, 15% phosphatidylglycerol, 10% cardiolipin, 18% others). The phospholipids were dissolved in decane (final concentration, 2%). The membrane separated two compartments containing equal concentrations of the studied cation. Then an additional amount of the cation was put into one compartment. If the cation can easily penetrate through BLM, it diffuses from the compartment of higher concentration to that of lower concentration, generating thereby a transmembrane electric potential difference (Δψ), the lower concentration compartment being positively charged. For a monovalent cation, a 10-fold gradient should, according to the Nernst equation, form Δψ of about 60 mV. Electric parameters were measured with AgCl electrodes and a VA-J-5 electrometer (for details, see [27]).
Isolation of mitochondria from rat heart and liver. Mitochondria were isolated as in [28, 29]. Isolated mitochondria were suspended in medium containing 250 mM sucrose, 10 mM Mops-KOH, pH 7.4, 1 mM EGTA, and 0.1% BSA (for heart mitochondria) or 0.3% BSA (for liver mitochondria). Protein concentration of mitochondria (here and elsewhere) was measured with bicinchoninic acid according to the producer's instruction (Pierce, USA) using BSA as a standard protein solution.
Malondialdehyde measurement. Lipid peroxidation levels of the mitochondrial membranes were evaluated by measuring thiobarbituric acid (TBA)-reactive substances (TBARS) by the method of Yagi [30] as modified by Biesalski [31]. Amounts of TBARS (adducts of MDA and TBA) were expressed as nanomoles of malondialdehyde per mg protein. Light absorption was read at 535 and 572 nm on an Aminco DW2000 dual wavelength spectrophotometer.
Measurement of hydrogen peroxide. The Amplex Red reagent (10-acetyl-3,7-dihydroxyphenoxazine; Invitrogen, USA) was used to detect the release of H2O2 from mitochondria. Resorufin, the fluorescent product of hydrogen peroxide-induced Amplex Red oxidation, was measured by monitoring its fluorescence (excitation/emission maxima, ~550/595 nm). Mitochondrial suspension was added to a 1 ml plastic cuvette to be diluted by isolation medium without BSA (see above) down to protein concentration of 0.25 mg/ml. Then horseradish peroxidase (final content 1 U/ml) and 4 µl 10 mM Amplex Red reagent solution in dimethylsulfoxide were added. The fluorescence was recorded with a Hitachi MPF4 spectrofluorimeter (Japan).
Mitochondrial membrane potential measurement. Safranin O was used as a membrane potential probe [32]. The 555- to 523-nm light absorption was measured with an Aminco DW-2000 spectrophotometer (dual-wavelength regime). The medium for measurement contained 250 mM sucrose, 10 mM Mops-KOH, pH 7.4, 0.1 mM EGTA, 5 mM succinate, 2 µM rotenone, and 15 µM safranin O. Mitochondrial protein concentration was 0.7 mg/ml.
Cell culture and transfections. HeLa cells and human skin fibroblasts were grown in Dulbecco's modified Eagle's medium (DMEM) supplemented with 10% fetal calf serum, streptomycin (100 U/ml), and penicillin (100 U/ml). HeLa cells were transfected with Mito-YFP construct (Clontech, USA) containing yellow fluorescent protein (YFP) fused with the mitochondrial localization signal of subunit VIII of cytochrome c oxidase. Transfections were performed using Lipofectamine 2000 reagents according to the manufacturer's protocol (Invitrogen). The transfected cells were transferred to DMEM containing geneticin (500 µg/ml) (Invitrogen).
Visualization of intracellular mitochondria and immunostaining. Mitochondria were visualized with Mitotracker Red or Mitotracker Green (200 nM, 15 min, 37°C). For immunostaining, cells grown on glass cover slips were fixed with 3.7% formaldehyde in phosphate-buffered saline solution (PBS) for 15 min at room temperature and stained with monoclonal antibodies against cytochrome c (6H2.B4; BD Pharmingen, USA) or with anti-BAX polyclonal antibodies (13666E; BD Pharmingen). Images were analyzed with an Axiovert microscope (Carl Zeiss, Germany) and with an LSM 510 confocal microscope (Carl Zeiss). In experiments on fragmentation of mitochondria, 300 cells were counted in each sample.
Photodynamic treatment. HeLa cells were loaded with 200 nM Mitotracker Red for 15 min at 37°C. Then the cells were transferred onto plastic dishes and illuminated by the tungsten lamp of an Axiovert 200 M microscope (Carl Zeiss) using a green filter (bandpass, 545/25 nm) and Neofluor 20× objective, for 1.0-1.5 min to obtain illumination equal to 34.8 J/cm2. Necrosis was measured 5 h after illumination.
Detection of ROS production. For induction of oxidative stress, cells were treated with H2O2 (200 µM, 45 min) and then loaded with 5 µM CM-DCF-DA for 15 min at 37°C. Fluorescence was analyzed using a Partec PAS-III flow cytometer (Partec GmbH, Germany), equipped with a 488-nm argon laser.
Analysis of cell death. Apoptotic cells were stained with Hoechst 33342 (1 µg/ml, 40 min). Five hundred nuclei were counted in each sample [33]. The cells with condensed and fragmented chromatin usually showed staining with Annexin V-Cy3 fluorescent conjugates indicating phosphatidyl serine externalization. On the other hand, they were not stained with propidium iodide, indicating intactness of the plasma membrane. At high concentrations of H2O2, a significant fraction of the cells was double stained with Annexin V and propidium iodide due to a secondary necrosis. Necrotic cells in photodynamic treatment experiments were counted after staining with propidium iodide (1 µg/ml, 5 min).
Electron microscopy. HeLa cells were fixed with 4% glutaraldehyde in 0.1 M phosphate buffer, pH 7.4, at 4°C for 2 h and then treated with buffered 1% osmium tetroxide for 1.5 h. The sample was then dehydrated with ethanol solutions (50% ethanol, 30 min; 60% ethanol, 30 min, twice; 70% ethanol with 1.5% uranyl acetate, 11 h; 100% ethanol, 30 min; acetone, 30 min). Then the sample was embedded into Epon-812 epoxide resin and 700-800 Å slices were prepared using an Ultracat (Leica, Germany) ultramicrotome. Slices were stained with lead. The resulting preparations were investigated and photographed using HU-12 or H-700 electron microscopes (Hitachi).
Measurement of intracellular reduced glutathione. Non-protein thiols (mainly reduced glutathione) were measured after disruption of HeLa cells in PBS with 5% HClO4, 2.5% Triton X-100, and 2.5 mM EDTA. Denatured proteins were separated by centrifugation. Thiols were measured by reduction of 6 mM 5,5′-dithio-bis(2-nitrobenzoic acid) (DTNB) in 250 mM sodium phosphate (pH 7.5) and 6 mM EDTA. Protein was measured with the Lowry reagent. Light absorption at 412 nm was estimated with a Hitachi 557 spectrophotometer.
RESULTS
Synthesis of SkQs. The following new compounds composed of plastoquinone or its methylated derivative conjugated with phosphonium, ammonium, rhodamine 19, or methyl carnitine cations via decane or pentane linkers have been synthesized and characterized: 10-(6′-plastoquinonyl) decyltriphenylphosphonium (SkQ1), methylated 10-(6′-plastoquinonyl) decylcarnitine (SkQ2M), 10-(6′-methylplastoquinonyl) decyltriphenylphosphonium (SkQ3), 10-(6′-plastoquinonyl) decyltributylammonium (SkQ4), 5-(6′-plastoquinonyl) amyltriphenylphosphonium (SkQ5), and 10-(plastoquinonyl) decylrhodamine 19 (SkQR1). Moreover, two ubiquinone-containing penetrating cations were synthesized, namely 10-(6′-ubiquinonyl) decyltriphenylphosphonium (MitoQ) and its demethoxy-derivative lacking one of the two methoxy groups (DMQ). As a control compound possessing the cationic and linker constituents but no quinone moiety, dodecyltriphenylphosphonium (C12TPP) was synthesized. For formulas, see Supplementary Information (Figs. S1 and S2)1 or [26]. The methods of synthesis are shown in Fig. 1 (this article) and Figs. S3-S6. The micelle formation constant of SkQ1 (Fig. S7) and absorption and ESR spectra (Fig. S8) were determined.
1 Here and further, for figures designated with “S”, see Supplementary Information presented in the electronic version of the article.
Penetration of cationic plastoquinone derivatives through lipid bilayers. First of all, the compounds were tested for their ability to penetrate through hydrophobic membranes. Measurements of electric diffusion potential showed that SkQR1 gradient within the concentration range 10-6-10-5 M produced Δψ value close to the Nernstian (10-fold gradient formed Δψ of about 60 mV with “+” sign in the compartment with lower cation concentration). At the same concentrations, SkQ1, SkQ3, and MitoQ produced Δψ of the same sign but lower value than the Nernstian one (Fig. 2). In the case of SkQ2M, SkQ4, and SkQ5, Δψ was significantly lower. These results could be explained by different permeability of the BLM for the studied cations. Direct measurements of the transfer rate of these cations from one lipid monolayer of BLM to the other showed that this rate declines in the series SkQR1 > SkQ1 > SkQ3 > MitoQ [50]. On studying cations with low permeability, there is a danger that a diffusion potential will be shunted by the other ion flows and as a result will drop below theoretically calculated value. Actually, concentrations of cations under study could be elevated, but in this case they all manifest detergent properties thus damaging the BLM. The problem can be solved by replacing the BLM with a thick planar phospholipid membrane. In this case, SkQ1 concentration can be increased to 10-4 M without damaging the membrane. Within the 5⋅10-5 to 5⋅10-4 M concentration range, SkQ1 produced Δψ with a value corresponding to the Nernstian (see Fig. S9a in Supplementary Information). Thus, SkQ1, SkQ3, and SkQR1 have the highest membrane permeability among these novel compounds synthesized by us. They were chosen for further experiments.Fig. 1. Principle of synthesis of derivatives of quinone with alkyltriphosphonium as a cationic group.
Antioxidant properties of SkQs in various model systems. Anti- and prooxidant activities of the SkQs were tested in model systems, i.e. aqueous solutions, micelles, liposomes, and planar membranes. To measure the ability of SkQ1 to quench OH• in an aqueous solution, we used its effect on a luminal-mediated chemiluminescence induced by an azo-initiator, 2,2′-azobis(2-amidinopropane) dihydrochloride (AAPH) [34, 35]. It is seen (Fig. 3, a and b) that 0.5 µM SkQ1H2 (reduced form of SkQ1) strongly decreases chemiluminescence, oxidized SkQ1 being much less effective. As for MitoQH2, it showed lower efficiency than SkQH2. MitoQ proved to be completely ineffective.Fig. 2. Generation of diffusion electric potential on planar bilayer phospholipid membranes by SkQ1 and related compounds. In the right compartment, the concentration of the studied compound was 10-6 M. In the left compartment, this concentration is indicated by the abscissa. The incubation mixture contained 10 mM Tris-HCl, 10 mM Mes, 10 mM KCl, pH 4.0.
Prooxidant activities of SkQ1 and MitoQ in an aqueous solution are compared in Figs. 3c and 3d. As a measure of such activities, rate of reduction O2 to O2· was chosen. To this end, formations of quinones from corresponding quinols or O2· from O2 were followed with a spectrophotometer (Fig. 3c) or an ESR spectrometer (Fig. 3d), respectively. Both methods clearly showed much higher prooxidant activity of MitoQ compared to SkQ1.Fig. 3. Antioxidant (a, b, e) and prooxidant (c, d) effects of oxidized and reduced forms of SkQ1 and MitoQ in aqueous solutions (a-d) and BLM (e). a, b) Quenching of the AAPH-induced chemiluminescence of luminal. c, d) Autooxidation of SkQ1H2 and MitoQH2 by O2: rates of SkQ1 and MitoQ formation from SkQ1H2 and MitoQH2, respectively (c); rates of O2· formation (d). SkQ1 and MitoQ were dissolved in ethanol and reduced by NaBH4. Formation of superoxide radicals was measured in 50% ethanol-PBS reaction medium (pH 8.0) using an ESR spectrometer. TIRON (sodium 4,5-dihydrobenzene-1,3-disulfonate) was used as a spin trap. Final concentration of quinones in mixtures was 5 µM. e) SkQ1 and MitoQ defend gramicidin channels in BLM against photoinactivation in the presence of Methylene Blue. The BLM was formed from diphytanoyl phosphatidylserine dissolved in decane. Incubation medium: 100 mM KCl, 10 mM Tris, 10 mM Mes (pH 7.0), 0.5 µM Methylene Blue.
Antioxidant activity of the studied compounds was also analyzed using lipid micelles. In this case, peroxidation of methyl ester of linoleate in micelles of Triton X-100 was followed by measuring O2 consumption. This activity of SkQ1H2 and MitoQH2 was characterized by the rate constant k1 for the reaction between the peroxyl radical of oxygenated linoleate residue (LO2•) and a quinol (QH2):
LO2• + QH2 -> LOOH + QH•,
which competes with the reaction of the chain propagation (rate constant k2):
LO2• + LH -> LOOH + L•.
The k1/k2 value was determined from the kinetic curve for O2 consumption. The absolute k1 values were calculated from k1/k2 values assuming k2 = 60 M-1⋅sec-1. For more details, see [24, 25].
The values of k1 for SkQ1H2 and MitoQH2 were found to be 2.2⋅105 and 0.58⋅105 M-1⋅sec-1, respectively. Thus, the reactivity of SkQ1H2 towards LO2• was almost 4 times higher than that of MitoQH2. This is in line with data obtained for simpler analogs of SkQ1H2 and MitoQH2, namely trimethyl-1,4-hydroquinone and 2,3-dimethoxy-5-methyl-1,4-hydroquinone [24, 25]. It should be noted that oxidized forms SkQ1 and MitoQ were inactive in this system (not shown in the figures).
In a further series of experiments, we examined the antioxidant action of SkQ1 and MitoQ in liposomes. First, we used one of the most conventional methods to assess lipid peroxidation, i.e. TBARS assay. Lipid peroxidation in azolectin liposomes was induced by the addition of 100 µM FeSO4, 1 mM ascorbate, and 30 mM tert-butylhydroperoxide (tBOOH). Under these conditions, TBARS formation was mainly due to production of malondialdehyde. This process was found to be substantially slower in the presence of 10 µM SkQ1H2 as compared to the control, SkQ1 being much less effective (not shown in the figures).
To directly follow the kinetics of oxidative lipid destruction, we used C11-BODIPY(581/591), a fluorescent lipid peroxidation probe [36, 37]. It was revealed that the addition of 5 µM Fe2+ led to a very strong inhibition of the C11-BODIPY fluorescence in azolectin liposomes. The Fe2+-induced fluorescence changes were almost completely prevented in the presence of 0.5 µM SkQ1H2. Oxidized SkQ1 was without any effect (not shown in the figures).
To model membrane protein damage caused by ROS, a new method was developed, i.e. measuring ROS sensitivity of the BLM conductance created by gramicidin D [38]. Tryptophan residues of this channel-forming polypeptide were shown to be attacked by ROS, resulting in the inactivation of the channels. Ascorbate, FeSO4, and tert-butyl hydroperoxide were employed as a ROS-generating system. It was shown that the ROS-induced inactivation of the gramicidin-mediated current could be prevented by SkQ1 or MitoQ, with SkQ1 being more effective (Fig. S10). Another version of the gramicidin experiment is shown in Fig. 3e. Here light was used to generate ROS, Methylene Blue being a photosensitizer. It is seen that antioxidant effect of SkQ1 was revealed at lower concentrations than that of MitoQ (C1/2 values were 1.8 and 4.5 µM, respectively).
Interaction of SkQs with isolated mitochondria. Uptake of SkQ1 by mitochondria was monitored with a hydrophobic cation-sensitive electrode. Addition of uncoupler discharging Δψ initiated partial release of SkQs to the medium, the effect being larger with SkQ5 than with the more hydrophobic SkQ1 (Fig. S11). This was in line with octanol/water distribution coefficients which were found to be 13,000 : 1 and 500 : 1 for SkQ1 and SkQ5, respectively (cf. 3000 : 1 for MitoQ [14]).
Next, we tested whether SkQ1 and other plastoquinone derivatives could be reduced by the animal mitochondrial respiratory chain. Either NAD-linked substrates or succinate were found to be used as electron donors for SkQ1 reduction (Figs. 4a and S12), which was completely arrested by antimycin A but not myxothiazol (not shown). The relationships can be explained assuming that SkQ1, like plastoquinone [39-42], is reduced by endogenous CoQH2 bound in center i of Complex III. Oxidation of SkQ1H2 was found to be enzymatic (by myxothiazol-sensitive complex III of the respiratory chain) or non-enzymatic (by either lipid radicals or O2). The overall rate of SkQ1H2 oxidation was lower than that of SkQ1 reduction by the respiratory chain (Fig. S12). This means that in respiring mitochondria SkQ1 should be mainly in its reduced state, which is competent in antioxidant activity.
What are the relationships of the anti- and prooxidant effects of SkQ1 and related substances on mitochondria? To estimate antioxidant activity, we used prevention by these compounds of malondialdehyde (MDA) formation initiated by Fe2+ and ascorbate in rat heart mitochondria. Figure 4b shows that antioxidant activity of SkQ1 is measurable at much lower concentration than that of MitoQ. The efficiency of the various compounds in inhibiting MDA formation is compared in Table 1. It is seen that in this respect SkQ1 and SkQR1 are the most active, whereas MitoQ is the least active among the quinone-containing compounds bearing a cationic residue. Decylplastoquinone (DPQ) lacking a cation is even less active than MitoQ, whereas C12TPP lacking a quinone residue is quite inactive at the concentrations studied.Fig. 4. SkQ effects on isolated rat heart mitochondria. a) Reduction of SkQ1 and oxidation of formed SkQ1H2 by isolated rat heart mitochondria. The reduction and oxidation were measured by decrease and increase in optical density at 274 nm, respectively. Where indicated, 2.5 mM succinate and either 2 µM rotenone or 2.5 mM malonate were added at zero time. After 18-min incubation, 1 µM myxothiazol or 4 mM glutamate and 1 mM malate were added. The medium contained 250 mM sucrose, 10 mM Mops-KOH, 0.1 mM EGTA, pH 7.4, and mitochondria (0.05 mg protein/ml). b) Antioxidant activity of SkQ1, SkQ3, and MitoQ was measured as inhibition of MDA formation initiated by 10 mM ascorbate and 100 µM FeSO4 in mitochondria oxidizing 4 mM glutamate and 1 mM malate (other components as in (a)). Prooxidant activity was estimated as stimulation of H2O2 formation under similar conditions (glutamate + malate) but without ascorbate and FeSO4. Line segments below the abscissa show “windows” between concentrations of given quinone derivative causing 20% anti- and 20% prooxidant effects. c) SkQ1 specifically protects mitochondrial cardiolipin from damage by OH•. Mitochondria were incubated with ascorbate and FeSO4 as described above in (b). Where indicated, 100 nM SkQ1 was added. Chromatography of mitochondrial lipids on Silica gel-60 plates was performed with chloroform-methanol-water, 65 : 25 : 4 (horizontal) and chloroform-acetone-methanol-acetic acid-water, 6 : 8 : 2 : 2 : 1 (vertical). Lipid spot designations: 1) cardiolipin; 2) phosphatidylethanolamine; 3) phosphatidylcholine; 4) phosphatidic acid; 5) phosphatidylserine; 6) phosphatidylinositol; 7) lysophosphatidylinositol. d, e) Effects of SkQ1, SkQ3, MitoQ, and C12TPP on State 4 respiration (d) and membrane potential (e) of mitochondria. The medium contained succinate and rotenone as indicated in (a).
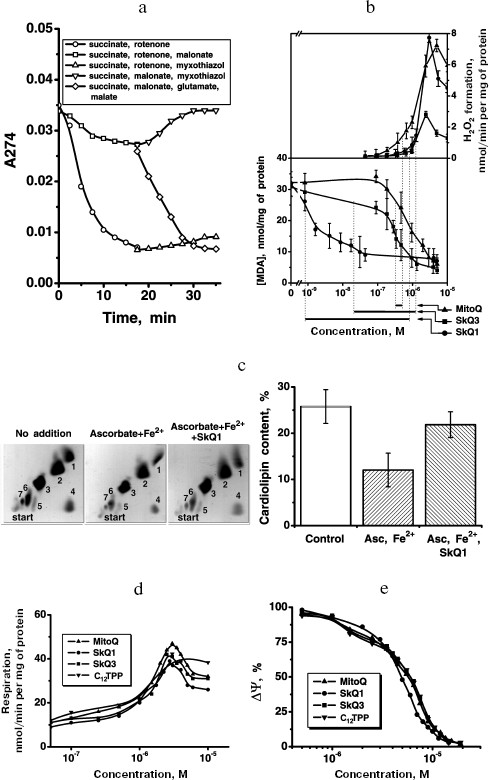
As further analysis revealed, it is cardiolipin that is first oxidized under conditions of OH• generation by the Fe2+ + ascorbate in heart mitochondria. The amount of cardiolipin was strongly decreased after the Fe2+ + ascorbate treatment, the effect being almost completely prevented by 100 nM SkQ1 (Fig. 4c). In other experiments, it was shown that SkQ1 and other hydrophobic cations remove N-nonyl acridine orange from complex with phospholipids (presumably with cardiolipin) in rat heart mitochondria, MitoQ being less efficient than SkQ1 and much less efficient than SkQR1 (Table 2; for method see [43]).
Table 1. Concentrations of compounds
decreasing two-fold the MDA formation in rat heart muscle mitochondria
treated with Fe2+ and ascorbate
Table 2. Hydrophobic cations compete with
N-nonyl acridine orange (NAO) for cardiolipin in rat heart
mitochondria. Ka, association constant of NAO with
mitochondria in the absence and in the presence of hydrophobic
cations
As prooxidant action of quinones, we measured stimulation by the same compounds of the H2O2 production in mitochondria oxidizing glutamate and malate in the absence of ADP (State 4). Uncouplers as well as respiratory chain inhibitors (rotenone, myxothiazol, and cyanide) strongly lowered the rate of H2O2 formation in the presence of micromolar concentrations of cationic quinones. The prooxidant effect was much smaller with C12TPP (Fig. S13, b and c). Prooxidant activity of SkQ1 becomes observable at slightly higher [SkQ1] than [MitoQ]. As a result, the “window” for the pure antioxidant effect not accompanied by a prooxidant action appears to be much larger for SkQ1 (from 0.9 to 850 nM), than for MitoQ (from 350 to 550 nM), SkQ3 occupying an intermediate position (from 25 to 1600 nM).
At concentrations of SkQ1, SkQ3, and MitoQ above 10-6 M, the uncoupling effect of these compounds was manifested. In particular, stimulation of respiration rate in State 4 and irreversible decrease in Δψ were observed (Figs. 4d and 4e, respectively). At concentrations above 5⋅10-6 M, all the quinone derivatives inhibited State 4 respiration (Fig. 4d), which explains some decrease in the rate of H2O2 formation (Fig. 4b). Uncoupled respiration was also inhibited by MitoQ, SkQ1, SkQ3, or C12TPP (which may be due to a damaging effect of these hydrophobic cations on respiratory chain enzymes), Ki values being around 2-15 µM (not shown in figures). The concentration range for the SkQ uncoupling effect was at least 1000 times higher than that for their antioxidant activity. For MitoQ, this “window” was again much smaller.
Thus, data on lipid micelles, liposomes, BLM, and isolated mitochondria indicate that SkQs are very effective antioxidants. As to their prooxidant, uncoupling, and respiratory enzyme-inhibiting activities, they are revealed at much higher concentrations.
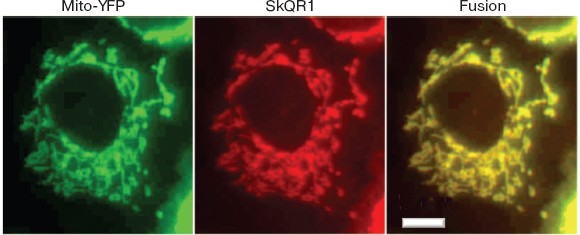
SkQs protect human cells in the culture from ROS-induced apoptosis and necrosis. In HeLa cells, SkQR1, a fluorescent SkQ derivative, was found to be specifically accumulated by mitochondria, showing the same intracellular localization as mitochondria-targeted jellyfish fluorescent protein YFP (Fig. 5; see color insert) or Mitotracker Green (not shown). As shown in Fig. 6a, the SkQR1 staining of mitochondria inside the living cell took about 1 h, and subsequent incubation of the cells in a medium without SkQR1 resulted in slow SkQR1 release (t1/2 = 2.5 h). Uncoupler FCCP (carbonyl cyanide p-trifluoromethoxyphenylhydrazone) prevented the SkQR1 staining and stimulated its efflux if added to non-stained and stained cells, respectively.
Fig. 5. Co-localization of SkQR1 (a fluorescent SkQ derivative) and mitochondria-targeted jellyfish yellow fluorescent protein YFP fused with the leader sequence of cytochrome oxidase subunit VIII. HeLa cells were transfected with Mito-YFP (Clontech) and incubated for 15 min with 100 nM SkQR1. Bar, 15 µm.
In the further study, we asked whether SkQ derivatives possess antiapoptotic and antinecrotic effects if cell death is induced by ROS. As the experiments showed, SkQs prevent ROS-linked cell death. Especially low concentrations of SkQ1 and SkQR1 were effective when human fibroblasts were pre-treated with SkQs for a week before initiation of apoptosis by H2O2 (following the protocol described by Saretzki et al. [16] for MitoQ). In this case, 0.2 nM SkQ1 completely abolished apoptosis of human fibroblasts induced by 400 µM H2O2. SkQR1 was more effective and MitoQ much less effective compared to SkQ1 (Fig. 6c). Dissipation of Δψ by uncoupler FCCP prevented the antiapoptotic effect of such a low SkQ1 concentration (Fig. 6b). The protective effect of small amounts of SkQ1 could be overcome by increasing [H2O2] to 500 µM (Fig. S14a). Low [SkQ1] prevented development of the main stages of H2O2-caused apoptosis, i.e. migration of proapoptotic protein BAX to mitochondria and cytochrome c release to cytosol (Fig. S14b). Neither DPQ nor C12TPP at nanomolar concentrations could substitute for SkQ1 (Fig. S14c). Toxic effect of SkQ1 was observed at micromolar concentrations and strengthened in the presence of low H2O2 concentrations (which were non-toxic without SkQ1; not shown). This effect is probably due to prooxidant effect of SkQ1 at micromolar concentrations.Fig. 6. Effects of SkQ1, SkQR1, and MitoQ on human cell cultures. a) Kinetics of SkQR1 uptake to and release from HeLa cells. At zero time, 50 nM SkQR1 was added to cells. Where indicated, 10 µM FCCP was added. The SkQR1 uptake and release were measured fluorimetrically with a Beckman-Coulter FC500 flow cytometer (USA). b) A 7-day pre-treatment of human fibroblasts with 20 nM SkQ1 arrests apoptosis induced by subsequent treatment with H2O2. Apoptotic cells were counted 24 h after adding H2O2. Additions: 1 µM FCCP, 400 µM H2O2. c) SkQ1 and SkQR1 are more efficient than MitoQ in arresting the H2O2-induced apoptosis in human fibroblasts. Conditions as in (b). d) A 7-day pre-treatment of HeLa cells with 20 nM SkQ1 prevents an increase in the intracellular H2O2 level induced by 45 min treatment with 200 µM H2O2. The cells were stained with 4 µM CM-DCF-DA for 15 min and then analyzed with a flow cytometer. e) Preventive effects of SkQR1, SkQ1, and MitoQ on H2O2-induced fission of elongated mitochondria. Human fibroblasts were preincubated with SkQR1, SkQ1, or MitoQ for 2 h and then treated with 400 µM H2O2 for 3 h. f) SkQ1 prevents necrosis induced by a photodynamic treatment of HeLa cells. The cells stained for 15 min with 200 nM Mitotracker Red were illuminated for 15 min with green light (545 nm, 34.8 J/cm2). Necrosis was measured 5 h after illumination. The cells were pre-treated for 1 h with 1 µM SkQ1, mixture of 1 µM TPP (tetraphenylphosphonium) and 1 µM DPQ (decylplastoquinone), 20 mM NAC (N-acetylcysteine), or 1 mM Trolox.
Addition of small amount of H2O2 to HeLa cells was found to induce a burst in endogenous ROS formation. Earlier we showed that ROS formation under these conditions is determined by the activity of the respiratory chain and stimulated by respiration inhibitors rotenone (Complex I) and myxothiazol (Complex III) [44]. This phenomenon described in our group as a ROS-induced ROS release [45] was completely abolished by pre-treatment of the cells with 20 nM SkQ1 (Fig. 6d).
In other experiments, the level of reduced glutathione was measured in HeLa cells (Fig. 7), and it was found to be lowered by adding H2O2, which pointed to development of oxidative stress [46]. Glutathione oxidation was prevented by SkQ1, the C1/2 being around 2⋅10-12 M. FCCP prevented the SkQ1 effect (Fig. 7). These data confirm that mitochondria are the origin of endogenous ROS and suggest that it is the ROS production that causes the oxidative stress and apoptosis.
Pre-treatment with very low [SkQ1] or [SkQR1] prevented decomposition of mitochondrial filaments into small mitochondria (the thread-grain transition, an early consequence of the action of apoptogens [47]) (Fig. 8). In this case, preincubation of fibroblasts with the cationic quinones for 2 h was sufficient to observe the protective effect, which increased as follows: MitoQ < SkQ1 < SkQR1. Measurable activity was observed at 2⋅10-13 M SkQR1. C12TPP was ineffective (Fig. 6e). Such variations in the quinone efficiencies could be explained by different permeability of membranes to various cationic quinone derivatives, by different size of the “antioxidant window”, and/or by various affinities of the cations to cardiolipin. An increase in the quinone concentrations abolished the protective action (Fig. 6e), which was most probably due to their pro-oxidant action. This finding was confirmed in experiments on HeLa cells (Fig. S15), which showed that (i) antioxidant Trolox inhibits decomposition of mitochondrial filaments by H2O2 in the presence of high concentrations of SkQ1, and (ii) micromolar SkQ1 added without H2O2 produces partial decomposition of mitochondrial filaments.Fig. 7. Effect of SkQ1 on the content of SH-compounds (mainly reduced glutathione) in HeLa cells. The cells were preincubated with or without SkQ1 for 4 h and then treated with 1 mM H2O2 for 2 h. Where indicated, 5 µM FCCP was added to the preincubation medium.
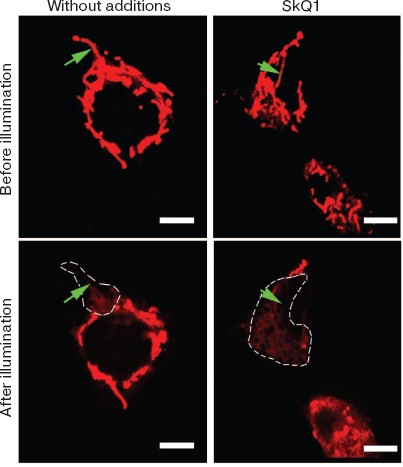
Low concentration SkQ1 without H2O2 stimulated formation of the mitochondrial network (Fig. 9; see color insert). Local damage to this network by a very narrow laser beam resulted in Δψ collapse over the entire mitochondrial reticulum. Under the same conditions but without SkQ1, Δψ was found to be discharged in a small part of the cell only. This suggests that the SkQ1-induced decrease in the endogenous ROS level stimulates fusion of the majority of mitochondria into an electrically-united mitochondrial reticulum [48].Fig. 8. Effect of SkQ1 on mitochondrial morphology in HeLa cells. a, b, c-f) Confocal and electron microscopy, respectively; a, c, d) without SkQ1; b, e, f) after 7-day treatment with 20 nM SkQ1. After 7-day preincubation, the cells were kept without (a-c, e) or with (d, f) 100 µM H2O2. In (a, b) mitochondria were visualized with Mitotracker Green.
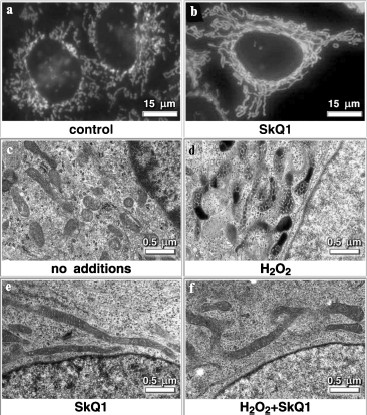
In other experiments, pre-treatment of HeLa cell with 1 µM SkQ1 for 1 h arrested necrosis caused by illumination-induced ROS (Fig. 6f) (mitochondria-targeted fluorescent dye Mitotracker Red was used as a photosensitizer). Complete protection against necrosis was observed at 0.5-1.0 µM SkQ1 and 1-h preincubation, and half-maximal effect was achieved at about 200 nM (Fig. S16). Under the same conditions, a mixture of 1 µM TPP and 1 µM DPQ was inefficient, whereas NAC (N-acetylcysteine) and Trolox could substitute for SkQ1 but at much higher concentrations (20 and 1 mM, respectively) (Fig. 6f).Fig. 9. SkQ1 initiates formation of a united mitochondrial electric network in HeLa cells. Arrow shows the place of illumination of a mitochondrion with a narrow argon laser beam of a Zeiss LSN 510 confocal microscope (488 nm; 50 sec; light spot, 6 × 60 pixels). Cells were stained with 100 nM TMRE for 15 min and analyzed 15 min after the laser illumination. Where indicated, cells were pre-treated with 20 nM SkQ1 for 7 days. Bar, 15 µm.
The data of this section suggest that SkQs effectively operate as antioxidants at the cell level, preventing ROS-induced apoptosis and necrosis.
DISCUSSION
Our results confirmed the original suggestion that cationic plastoquinone derivatives (SkQs) are of high mitochondria-targeted antioxidant activity. This suggestion initially based on some theoretical conjectures is supported by data on model membranes, isolated mitochondria, and human cell cultures. Screening of the synthesized compounds in planar membranes identified those that are readily permeable through lipid barriers. This property was found to be inherent in SkQ1, SkQ3, and SkQR1 (as well as in MitoQ introduced by Murphy and co-workers [13]) (Fig. 2). On the other hand, BLM was of lower permeability for SkQ4, SkQ5, and SkQ2M. This is why SkQ1, SkQ3, and SkQR1 were chosen for further studies. It was found that in BLM inlaid with gramicidin D, SkQ1 protects gramicidin channels from being inactivated by ROS. In water solution and all the model systems studied (methyllinoleate micelles, liposomes, and BLM), antioxidant activity of SkQ1 was significantly higher than that of MitoQ (Figs. 3 and S10).
As experiments on mitochondria showed, SkQ1, like MitoQ, can be reduced by the mitochondrial respiratory chain (Fig. 4a). As to the SkQ1H2 oxidation, it proved to be slower than SkQ1 reduction (Fig. S12), indicating that in mitochondria SkQ1 should be mainly in its reduced form. Thus, SkQ1 can be regarded as a rechargeable antioxidant. Measurable antioxidant effect was observed at [SkQ1] as low as 1 nM. Increase in [SkQ1] to about 1 µM resulted in appearance of its prooxidant activity (Fig. 4b). MitoQ started to operate as antioxidant at much higher concentrations than SkQ1 (0.3 µM), which was only slightly lower than the level when its prooxidant activity becomes measurable (0.5 µM).
It should be stressed that the prooxidant effect of micromolar concentrations of cationic quinone derivatives is very strong. In fact, the rate of H2O2 production by mitochondria in the presence of micromolar MitoQ or SkQ1 was much higher than that in State 4 with succinate or in the presence of an uncoupler and antimycin A, i.e. under conditions which are regarded as optimal for mitochondrial ROS production (Figs. 4b and S13, b and c). It is the prooxidant activity of cationic quinones that determines their toxic effect on cells at micromolar concentrations under oxidative stress conditions. Thus, our study revealed a new requirement for a cationic quinone derivative to be used as a mitochondria-targeted antioxidant. It is that the “window” between quinone concentrations causing anti- and pro-oxidant effects must be large enough to minimize risk of enhancing mitochondrial ROS level instead of lowering it. Such a risk is much lower with SkQ1 (antioxidant effect becomes measurable at about 1000 times lower quinone concentration than prooxidant) compared with MitoQ, for which this value is less than 2 times. These relationships should be taken into account in attempts to apply cationic quinones as antioxidants in medicine or biotechnology. (For role of prooxidant activity of quinones and their toxicology, see [49].)
An antioxidant effect of SkQ1 consists in preventing peroxidation of cardiolipin, a phospholipid specific for the inner mitochondrial membrane (Fig. 4c). In fact, it is cardiolipin, which is peroxidized in mitochondria under oxidative stress, whereas other phospholipids remain more or less intact. Such specificity is due to much higher content of polyunsaturated fatty acid residues in cardiolipin than in any other type of mitochondrial phospholipids. Polyunsaturated fatty acids are extremely sensitive to peroxidation; they easily form peroxyl radicals (LO2•) as a result of oxygenation of a methylene group localized between two double bond-containing moieties of the fatty acid hydrocarbon chain (-CH=CH-CH2-CH=CH-). SkQ1H2 most probably interrupts the chain reaction of lipid peroxidation reacting with LO2• [50], thereby effectively protecting cardiolipin from oxidation. Complex formation between hydrophobic cationic quinones and cardiolipin (which appeared to be tighter for SkQ1 and particularly for SkQR1 compared to MitoQ) may take part in this process.
There are several reasons why cardiolipin peroxidation appears to be a key event in mitochondrial oxidative stress. First, it is the most sensitive to the ROS-induced peroxidation and its peroxidation initiates a chain reaction “setting on fire” other membrane constituents. Second, oxidized cardiolipin fails to bind cytochrome c to the mitochondrial membrane [51]. As a result, cytochrome c releases to the mitochondrial intermembrane space and gains cardiolipin-peroxidase activity, initiating a vicious cycle of further cardiolipin peroxidation [52]. Third, the loss of cardiolipin inactivates all the respiratory chain complexes, H+-ATP-synthase, ATP/ADP-antiporter, etc. and induces an increase in permeability of the inner mitochondrial membrane and, as a consequence, Δψ collapse, swelling of matrix, disruption of the outer mitochondrial membrane, and release of cytochrome c and other intermembrane proapoptotic proteins into the cytosol. Thus, cardiolipin oxidation initiates apoptosis [53], and SkQ1 blocking this oxidation can prevent cell death.
In human cell cultures, very low (nanomolar and even picomolar) [SkQ] were found to prevent ROS-induced apoptosis. Even more effectively, plastoquinone derivatives block such an early apoptotic event as fission of elongated mitochondria. In this case, the measurable protective effect is observed at 8⋅10-13 M SkQR1 or 1⋅10-11 M SkQ1 on intact cells (Figs. 6e and S15). To explain such extremely high efficiency, one should take into account that (i) SkQs are rechargeable antioxidants and (ii) they are specifically accumulated in mitochondria. The accumulation coefficient can be estimated taking into account Δψ on the outer cell membrane (about 60 mV, with negative charging of the cytoplasm) and on mitochondrial membrane (about 180 mV, with negative charging of the matrix), resulting in 104-fold SkQ gradient between extracellular medium and mitochondrial matrix. Then, membrane/water distribution coefficient, which is of about 1⋅104 for SkQ, should be taken into account. Thus, the concentration gradient of SkQ between the inner leaflet of mitochondrial membrane and extracellular medium may reach a value as high as 108-fold (Fig. 10).
It is not clear why substitution of phosphonium group by rhodamine as the cationic moiety of SkQ results in an increase in the SkQ efficiency in experiments on cell cultures (see Fig. 6, c and e), in spite of the fact that in isolated mitochondria for SkQ1 and SkQR1 the antioxidant C1/2 values are similar (Table 1). As our experiments showed, SkQR1 is a substrate of ABC ATPase, a nonspecific pump of the outer cell membrane ejecting hydrophobic cations and some non-charged compounds of high hydrophobicity (this pump is responsible for the phenomenon known as multidrug resistance). Most probably, SkQ1 can also be expelled from the cell by ABC ATPase. The higher efficiency of SkQR1 than SkQ1 might be accounted for by assuming that SkQ1 is better substrate of ABC ATPase. Such an assumption predicts that inhibition of ABC ATPase should make SkQ1 as efficient as SkQR1. This possibility in now under investigation within the framework of our project.Fig. 10. Scheme illustrating accumulation of SkQ in inner leaflet of the inner mitochondrial membrane. The Δψ values on the plasma membrane and the inner mitochondrial membrane are assumed to be 60 and 180 mV, respectively. Membrane/water distribution coefficient for SkQ is assumed to be 10,000 : 1.
Effective accumulation of cationic quinones in mitochondria results in that already at micromolar concentrations they demonstrate prooxidant activity and stimulate apoptosis under oxidative stress conditions. In case of MitoQ, the protective effect is replaced by the opposite effect if the quinone concentration is increased slightly. The experiments showed that SkQs are significantly more efficient antioxidants compared to others presently known. Apoptosis caused by oxidative stress seems to play a crucial role in both cellular [54] and organism [55, 56] senescence. The results obtained give hope that SkQs could become an effective remedy for curing senescence pathologies and for extending the healthy period of life.
Results on in vivo and ex vivo effects of SkQs will be described in accompanying papers [57-60].
We are very grateful to Professor V. A. Sadovnichii, Rector of Moscow State University, for his interest in the project and encouragement. We thank M. L. Domninskaya, E. A. Litmanovich, A. A. Zaspa, and E. M. Zubin for participation in certain experiments. We would like to express our sincere gratitude for valuable advice from Professors G. Blobel, M. P. Murphy, and A. D. Vinogradov. Generous support of Mr. O. V. Deripaska, which in fact made possible this study, is greatly appreciated.
This study is supported by Mitotechnology LLC, Lomonosov Moscow State University, the Vol'noe Delo Foundation (grant No. 99F-06), the Russian Foundation for Basic Research (grant Nos. 07-04-01545 and 07-04-00335), and the Russian Ministry of Education and Science (grant “Leading Scientific Schools” No. 5762.2008.4).
Note in proof: Quite recently, a paper by A. B. Salmon, A. A. Sadighi Akha, R. Buffenstein, and R. A. Miller appeared in J. Gerontol. A. Biol. Sci. Med. Sci., 63, 232-241 (2008). In this paper, it is reported that very low proapoptotic activity of H2O2 of naked mole-rat cells may be a tissue-specific feature. An H2O2 resistance was observed in cultured arteria (see ref. [35]) but could not be observed in the culture of isolated fibroblasts. Alternatively, it seems possible that the low H2O2 sensitivity might be detected at the level of naked mole-rat tissue rather than isolated cells. One more possibility is that the number of studied animals was too small.
REFERENCES
1.Skulachev, V. P. (2005) IUBMB-Life,
57, 305-310.
2.Liberman, E. A., Topali, V. P., Tsofina, L. M.,
Jasaitis, A. A., and Skulachev, V. P. (1969) Nature, 222,
1076-1078.
3.Grinius, L. L., Jasaitis, A. A., Kadziauskas, Yu.
L., Liberman, E. A., Skulachev, V. P., Topali, V. P., Tsofina, L. M.,
and Vladimirova. M. A. (1970) Biochim. Biophys. Acta,
216, 1-12.
4.Bakeeva, L. E., Grinius, L. L., Jasaitis, A. A.,
Kuliene, V. V., Levitsky, D. O., Liberman, E. A., Severina, I. I., and
Skulachev, V. P. (1970) Biochim. Biophys. Acta, 216,
12-21.
5.Isaev, I. I., Liberman, E. A., Samuilov, V. D.,
Skulachev, V. P., and Tsofina, L. M. (1970) Biochim. Biophys.
Acta, 216, 22-29.
6.Liberman, E. A., and Skulachev. V. P. (1970)
Biochim. Biophys. Acta, 216, 30-42.
7.Skulachev, V. P. (1988) Membrane
Bioenergetics, Springer-Verlag, Berlin-Heidelberg.
8.Green, D. (1974) Biochim. Biophys. Acta,
346, 27-78.
9.Severin, S. E., Skulachev, V. P., and Yaguzhinsky,
L. S. (1970) Biokhimiya, 35, 1250-1257.
10.Levitsky, D. O., and Skulachev, V. P. (1972)
Biochim. Biophys. Acta, 275, 33-50.
11.Burns, R. J., Smith, R. A. J., and Murphy, M. P.
(1995) Arch. Biochem. Biophys., 322, 60-68.
12.Smith, R. A., Porteous, C. M., Coulter, C. V.,
and Murphy, M. P. (1999) Eur. J. Biochem., 263,
709-716.
13.Kelso, G. F., Porteous, C. M., Coulter, C. V.,
Hughes, G., Porteous, W. K., Ledgerwood, E. C., Smith, R. A., and
Murphy, M. P. (2001) J. Biol. Chem., 276, 4588-4596.
14.James, A. M., Cocheme, H. M., Smith, R. A., and
Murphy, M. P. (2005) J. Biol. Chem., 280,
21295-21312.
15.Kelso, G. F., Porteous, C. M., Hughes, G.,
Ledgerwood, E. C., Gane, A. M., Smith, R. A., and Murphy, M. P. (2002)
Ann. NY Acad. Sci., 959, 263-274.
16.Saretzki, G., Murphy, M. P., and von Zglinicki,
T. (2003) Aging Cell, 2, 141-143.
17.Jauslin, M. L., Meier, T., Smith, R. A., and
Murphy, M. P. (2003) FASEB J., 17, 1972-1974.
18.Murphy, M. P., and Smith, R. A. (2007) Annu.
Rev. Pharmacol. Toxicol., 47, 629-656.
19.O'Malley, Y., Fink, B. D., Ross, N. C.,
Prisinzano, T. E., and Sivitz, W. I. (2006) J. Biol. Chem.,
281, 39766-39775.
20.Doughan, A. K., and Dikalov, S. I. (2007)
Antioxid. Redox Signal, 9, 1825-1836.
21.Vlachantoni, D., Tulloch, B., Taylor, R. W.,
Turnbull, D. M., Murphy, M. O., and Wright, A. F. (2006) Invest.
Ophthalmol. Vis. Sci., E-5773.
22.Tauskela, J. S. (2007) IDrugs, 10,
399-412.
23.Kruk, J., Jemiola-Rzeminska, M., and Strzalka, K.
(1997) Chem. Phys. Lipids, 87, 73-80.
24.Loshadkin, D., Roginsky, V., and Pliss, E.
(2002) Int. J. Chem. Kinetics, 34, 162-171.
25.Roginsky, V., Barsukova, T., Loshadkin, D., and
Pliss, E. (2003) Chem. Phys. Lipids, 125, 49-58.
26.Skulachev, V. P. (2007) Biochemistry
(Moscow), 72, 1385-1396.
27.Severina, I. I. (1982) Biochim. Biophys.
Acta, 681, 311-317.
28.Palmer, J. W., Tandler, B., and Hoppel, C. L.
(1977) J. Biol. Chem., 252, 8731-8739.
29.Grieff, D., and Meyer, S. (1961) Biochim.
Biophys. Acta, 50, 232-242.
30.Yagi, K., Nishigaki, I., and Ohama, H. (1968)
Vitamins, 37, 105-112.
31.Jentzsch, A. M., Bachmann, H., Furst, P., and
Biesalski, H. K. (1996) Free Rad. Biol. Med., 20,
251-256.
32.Akerman, K. E. O., and Wikstrom, M. K. F. (1976)
FEBS Lett., 68, 191-197.
33.Shchepina, L. A., Pletjushkina, O. Yu.,
Avetisyan, A. V., Bakeeva, L. E., Fetisova, E. K., Izyumov, D. S.,
Saprunova, V. B., Vyssokikh, M. Yu., Chernyak, B. V., and Skulachev, V.
P. (2002) Oncogene, 21, 8149-8157.
34.Lissi, E., Pascual, C., and del Castillo, M. D.
(1992) Free Rad. Res. Commun., 17, 299-311.
35.Krasowska, A., Rosiak, D., Szkapiak, K., and
Lukaszewicz, M. (2000) Curr. Top. Biophys., 24,
89-95.
36.Naguib, Y. M. (1998) Analyt. Biochem.,
265, 290-298.
37.Drummen, G. P., van Liebergen, L. C., Op den
Kamp, J. A., and Post, J. A. (2002) Free Rad. Biol. Med.,
33, 473-490.
38.Sobko, A. A., Vigasina, M. A., Rokitskaya, T. I.,
Kotova, E. A., Zakharov, S. D., Cramer, W. A., and Antonenko, Y. M.
(2004) J. Membr. Biol., 199, 51-62.
39.Von Jagow, G., and Bohrer, C. (1975) Biochim.
Biophys. Acta, 387, 409-424.
40.Weiss, H., and Wingfield, P. (1979) Eur. J.
Biochem., 99, 151-160.
41.Chen, M., Liu, B.-L., Gu, L.-Q., and Zhu, Q.-S.
(1986) Biochim. Biophys. Acta, 851, 469-474.
42.Gu, L.-Q., Yu, L., and Yu, C.-A. (1990)
Biochim. Biophys. Acta, 1015, 482-492.
43.Gohil, V. M., Gvozdenovic-Jeremic, J.,
Schlame, M., and Greenberg, M. L. (2005) Analyt. Biochem.,
343, 350-352.
44.Chernyak, B. V., Izyumov, D. S., Lyamzaev, K. G.,
Pashkovskaya, A. A., Pletjushkina, O. Y., Antonenko, Y. N., Sakharov,
D. V., Wirtz, K. W., and Skulachev, V. P. (2006) Biochim. Biophys.
Acta, 1757, 525-534.
45.Zorov, D. B., Filburn, C. R., Klotz, L. O.,
Zweier, J. L., and Sollott, S. J. (2000) J. Exp. Med.,
192, 1001-1014.
46.Schulz, J. B., Lindenau, J., Seyfried, J., and
Dichgans, J. (2000) Eur. J. Biochem., 267, 4904-4911.
47.Skulachev, V. P., Bakeeva, L. E., Chernyak, B.
V., Domnina, L. V., Minin, A. A., Pletjushkina, O. Yu., Saprunova, V.
B., Skulachev, I. B., Tsyplenkova, V. G., Vasiliev, J. M., Yaguzhinsky,
L. S., and Zorov, D. B. (2004) Mol. Cell. Biochem.,
256/257, 341-358.
48.Amchenkova, A. A., Bakeeva, L. E., Chentsov, Yu.
S., Skulachev, V. P., and Zorov, D. B. (1988) J. Cell Biol.,
107, 481-495.
49.Bolton, J. L., Trush, M. A., Penning, T. M.,
Dryhurst, G., and Monks, T. J. (2000) Chem. Res. Toxicol.,
13, 135-160.
50.Antonenko, Y. N., Roginsky, V. A., Pashkovskaya,
A. A., Rokitskaya, T. I., Kotova, E. A., Zaspa, A. A., Chernyak, B. V.,
and Skulachev, V. P. (2008) J. Membr. Biol., 222,
141-149.
51.Tyurin, V. A., Tyurina, Y. Y., Osipov, A. N.,
Belikova, N. A., Basova, L. V., Kapralov, A. A., Bayir, H., and Kagan,
V. E. (2007) Cell Death Differ., 14, 872-875.
52.Basova, L. V., Kurnikov, I. V., Wang, L., Ritov,
V. B., Belikova, N. A., Vlasova, I. I., Pacheco, A. A., Winnica, D. E.,
Peterson, J., Bayir, H., Waldeck, D. H., and Kagan, V. E. (2007)
Biochemistry, 46, 3423-3434.
53.Choi, S. Y., Gonzalvez, F., Jenkins, G. M.,
Slomianny, C., Chretien, D., Arnoult, D., Petit, P. X., and Frohman, M.
A. (2007) Cell Death Differ., 14, 597-606.
54.Lee, S., Jeong, S. Y., Lim, W. C., Kim, S., Park,
Y. Y., Sun, X., Youle, R. J., and Cho, H. (2007) J. Biol. Chem.,
282, 22977-22983.
55.Chen, H., McCaffery, J. M., and Chan, D. C.
(2007) Cell, 130, 548-562.
56.Scheckhuber, C. Q., Erjavec, N., Tinazli, A.,
Hamann, A., Nystrom, T., and Osiewacz, H. D. (2007) Nat. Cell
Biol., 9, 99-105.
57.Bakeeva, L. E., Barskov, I. V., Egorov, M. V.,
Isaev, N. K., Kapelko, V. I., Kazachenko, A. V., Kirpatovsky, V. I.,
Kozlovsky, S. V., Lakomkin, V. L., Levina, S. V., Pisarenko, O. I.,
Plotnikov, E. Y., Saprunova, V. B., Serebryakova, L. I., Skulachev, M.
V., Stelmashook, E. V., Studneva, I. M., Tskitishvili, O. V.,
Vasil'eva, A. K., Victorov, I. V., Zorov, D. B., and Skulachev, V. P.
(2008) Biochemistry (Moscow), 73, 1288-1299.
58.Agapova, L. S., Chernyak, B. V., Domnina, L. V.,
Dugina, V. B., Efimenko, A. Yu., Fetisova, E. K., Ivanova, O. Yu.,
Kalinina, N. I., Khromova, N. V., Kopnin, B. P., Kopnin, P. B.,
Korotetskaya, M. V., Lichinitser, M. R., Lukashov, A. L., Pletjushkina,
O. Yu., Popova, E. N., Skulachev, M. V., Shagieva, G. S., Stepanova, E.
V., Titova, E. V., Tkachuk, V. A., Vasiliev, J. M., and Skulachev, V.
P. (2008) Biochemistry (Moscow), 73, 1300-1316.
59.Neroev, V. V., Archipova, M. M., Bakeeva, L. E.,
Fursova, A. Zh., Grigorian, E. N., Grishanova, A. Yu., Iomdina, E. N.,
Ivashchenko, Zh. N., Katargina, L. A., Khoroshilova-Maslova, I. P.,
Kilina, O. V., Kolosova, N. G., Kopenkin, E. P., Korshunov, S. S.,
Kovaleva, N. A., Novikova, Yu. P., Philippov, P. P., Pilipenko, D. I.,
Robustova, O. V., Saprunova, V. B., Senin, I. I., Skulachev, M. V.,
Sotnikova, L. F., Stefanova, N. A., Tikhomirova, N. K., Tsapenko, I.
B., Shchipanova, A. I., Zinovkin, R. A., and Skulachev, V. P. (2008)
Biochemistry (Moscow), 73, 1317-1328.
60.Anisimov, V. N., Bakeeva, L. E., Egormin, P. A.,
Filenko, O. F., Isakova, E. F., Manskikh, V. N., Mikhelson, V. M.,
Panteleeva, A. A., Pasyukova, E. G., Pilipenko, D. I., Piskunova, T.
S., Popovich, I. G., Roshchina, N. V., Rybina, O. Yu., Samoylova, T.
A., Saprunova, V. B., Semenchenko, A. V., Skulachev, M. V., Spivak, I.
M., Tsybul'ko, E. A., Tyndyk, M. L., Vyssokikh, M. Yu., Yurova, M. N.,
Zabezhinsky, M. A., and Skulachev, V. P. (2008) Biochemistry
(Moscow), 73, 1329-1342.
SUPPLEMENTARY INFORMATION
Download (PDF)
S1: Structures, Methods of Synthesis, and Certain Physicochemical Properties of Cationic Quinone Derivatives
Figures S1 and S2 show formulas of CoQH2, plastoquinol, vitamin E, vitamin K1, and compounds synthesized in our group, respectively. It is noteworthy that plastoquinol and vitamin K1 inherent in chloroplasts, as well as the “professional” antioxidant vitamin E, in contrast to CoQ, contain no methoxy groups.
Fig. S1. Formulas of CoQH2, plastoquinol, vitamins K1, and E.
Plastoquinone differs from ubiquinone by (i) substitution of methyl for methoxy groups and (ii) absence of methyl group at fifth position of the quinone ring. SkQ3 contains no methoxy groups but retains, like ubiquinone, methyl at the fifth position. In SkQ2M, methylated carnitine substitutes for the phosphonium cation. In SkQ4 and SkQR1, decyltriphenylphosphonium cation was replaced by cations of decyltributylammonium and rhodamine 19, respectively. As shown in our group, the cation of ethyl rhodamine can penetrate through the lipid bilayer [1]. SkQR1 is unique among other SkQs since it is strongly fluorescing, so its fate in mitochondria, cells and the organism can be easily followed. SkQ5, containing a C5 linker instead of C10, was used as an example of a compound of lower hydrophobicity than the others. As to DMQ, it was tried as a compound, which, like SkQ3, has a structure intermediate between ubi- and plastoquinone (one methoxy group instead of two in ubiquinone). This compound was of certain interest since partial substitution of demethoxy-CoQ for CoQ was shown to prolong life of C. elegans and mice [2].Fig. S2. Formulas of certain compounds synthesized in our group. Reduced forms of quinones are shown.
A number of antioxidative lipophilic compounds (SkQ1 (3a), SkQ3 (3b), MitoQ (3c), DMQ (3d), and SkQ5 (3e) in Fig. S3) were synthesized. In all of them, triphenylposphonium cation was covalently attached to the substituted 1,4-benzoquinone via an aliphatic carbon chain of 10 (or 5) methylene groups. Benzoquinones (1a, 1b) were prepared from corresponding benzoquinols by their oxidation by aqueous solution of KBrO3.
General procedure of synthesis of alkyl-1,4-benzoquinones (1a-1d). Alkylhydroquinone (9 mmol), KBrO3 (3 mmol), 9 ml H2O, and 0.45 ml 5 N H2SO4 were stirred at 40-50°C for 30 min. The solution was extracted with diethyl ether. The organic extracts were dried over Na2SO4 and evaporated in vacuo. The yellow solid was purified by column chromatography on silica gel using chloroform as the eluent. 2,3-Dimethyl-1,4-benzoquinone (1a): the yield, 63%; TLC: Rf (CHCl3) 0.46; HPLC: tR = 17.4 min (4.6 × 250 mm column Luna 5 µm C18(2), 1 ml/min, 25°C, 0-90% B for 26.4 min; A: 10 mM H3PO4 in water; B: 10 mM H3PO4 in MeCN), m. p. 58°C (56.5-57.5°C) [3]; UV (CH3OH): λmax - 209, 256, and 344 nm; ESI MS: m/z calculated for C8H8O2 136.15; found 136.2.Fig. S3. Method used for synthesis of cationic derivatives of quinones.
2,3,5-Trimethyl-1,4-benzoquinone (1b), yield, 74%; TLC: Rf (CH2Cl2) 0.67; HPLC: tR = 7.8 min (4.6 × 150 mm column Luna 5 µm C18(2), 1.5 ml/min, 25°C, 5-95% B for 11 min; A: 0.05% aqueous TFA; B: 0.05% TFA in MeCN). UV (CH3OH): λmax - 198, 258, and 344 nm; ESI MS: m/z calculated for C9H10O2 150.18; found 150.4.
2,3-Dimethoxy-5-methyl-1,4-benzoquinone (1c) was from Aldrich (USA).
2-Methoxy-5-methyl-1,4-benzoquinone (1d) was obtained by refluxing methanol solution of p-toluquinone and ZnCl2 [4]. Yield, 27.8%, m.p. 172°C.
Radical alkylation of the quinones (1a-1d) was done using the bromoalcanoic acid-ammonium persulfate-silver nitrate system [5].
General procedure of the synthesis of bromoalkylquinones (2a-2e). 11-Bromoundecanoic acid (2.1 mmol), 1a-1d (2 mmol), AgNO3 (1 mmol) were dissolved in 7 ml of AcCN and H2O (2 : 1) mixture at 80°C. Solution of (NH4)2S2O8 (2 mmol) in 3 ml of H2O was added drop-wise with stirring at 70-89°C for 1.5 h. After dilution with water, the mixture was extracted with ether. The ether layer was washed with water, dried over Na2SO4 and evaporated in vacuo. The residue was applied to a silica gel column (225 × 35 mm) using chloroform as eluent. 10-(4,5-Dimethyl-3,6-dioxocyclohexa-1,4-dien-1-yl)decylbromide (2a): yield, 29.7%; TLC: Rf (CHCl3) 0.62; HPLC: tR = 23 min (4.6 × 250 mm column Luna 5 µm C18(2), 1 ml/min, 25°C, 0-90% B for 26.4 min; A: 10 mM H3PO4 in water; B: 10 mM H3PO4 in MeCN); UV (CH3OH): λmax - 214, 258, and 344 nm. ESI MS: m/z calculated for C18H27O2Br (M+ + H) 356.3; found 356.1. IR: 2928, 2336, 1600, 1496, and 1304 cm-1.
10-(2,4,5-Trimethyl-3,6-dioxocyclohexa-1,4-dien-1-yl)decylbromide) (2b): yield, 42%; TLC: Rf (CHCl3) 0.79, Rf (CHCl3-hexane, 3 : 1) 0.45. HPLC: tR = 14.9 min (4.6 × 150 mm column Luna 5 µm C18(2), 1.5 ml/min, 25°C, 35-95% B for 18 min; A: 10 mM H3PO4 in water; B: 10 mM H3PO4 in MeCN); UV (CH3OH): λmax - 214, 262, 268, and 352 nm; ESI MS: m/z calculated for C19H29O2Br 369.34; found 369.6.
10-(4,5-Dimethoxy-2-methyl-3,6-dioxocyclohexa-1,4-dien-1-yl)decybromide (2c): yield, 26%; TLC: Rf (CH2Cl2-Et2O, 20 : 1) 0.45; HPLC: tR = 12.7 min (4.6 × 150 mm column Luna 5 µm C18(2), 1.5 ml/min, 25°C, 35-95% B for 26.4 min; A: 10 mM H3PO4 in water; B: 10 mM H3PO4 in MeCN); UV (CH3OH): λmax 278 nm; ESI MS: m/z calculated for C19H29O4Br 401.34; found 402.
10-(5-Methoxy-2-methyl-3,6-dioxocyclohexa-1,4-dien-1-yl)decylbromide (2d): yield, 37%; TLC: Rf (CHCl3) 0.59. Compound 2d was used for the next step without further purification.
5-(4,5-Dimethyl-3,6-dioxocyclohexa-1,4-dien-1-yl)pentylbromide (2e) was prepared as described for 2a with use of 1a (1 mmol), 6-bromhexanoic acid (1 mmol), AgNO3 (1 mmol), and (NH4)2S2O8 (1 mmol) in aqueous AcCN. Yield, 30%. Compound 2e was used for the next step without further purification.
Compounds 3a-3e were synthesized from triphenylphosphine and corresponding bromoalkylquinones (2a-2e).
General procedure for the synthesis of the triphenylphosphonium bromides (3a-3e). Triphenylphosphine (0.2 mmol), 2a-2e (0.2 mmol), and benzene or ethanol (0.3 ml) were sealed under argon in glass tube and kept at 85-95°C for 72 h. The residue after removing the solvent was precipitated by diethyl ether from CH2Cl2. The crude product was purified by column chromatography on silica gel with the mixture of CHCl3-CH3OH (at different ratio) as eluent. [10-(4,5-Dimethyl-3,6-dioxocyclohexa-1,4-dien-1-yl)decyl]triphenylphosphonium bromide, SkQ1 (3a): yield, 24%; TLC: Rf (CHCl3-CH3OH, 4 : 1) 0.66; HPLC: tR = 10.1 min (4.6 × 150 mm column Luna 5 µm C18(2), 1.5 ml/min, 25°C, 5-95% B for 11 min; A: 0.05% aqueous TFA; B: 0.05% TFA in MeCN); UV (CH3OH): λmax - 198, 226, and 260 nm (ε260 = 18.652 cm-1⋅M-1), 352 nm; ESI MS: m/z calculated for C36H42O2P, 537.69; found, 537.3; 1H-NMR: (CDCl3, 300K, AC-200) 1.12-1.29 ppm (br. m, 12H, 3, 4, 5, 6, 7, 8 - (CH2)6); 1.34 ppm (quintet, Jq = 7 Hz, 2H, 2-CH2); 1.48-1.56 ppm (m, 2H, 9-CH2); 1.91 ppm (s, 6H, 4′,5′-(CH3)2); 2.33 ppm (t, Jt = 7.6 Hz, 2H, 10-CH2); 3.31 ppm (m, 2H, 1-CH2); 6.37 ppm (s, 1H, H(2′)); 7.57-7.82 ppm (m, 15H, Ph); 13C-NMR: (CD3OD, 303K): 11.90 and 12.29 ppm (4′ and 5′-(CH3)2); 22.48 ppm (d, J = 4.6 Hz, 2-CH2); 23.67 ppm (d, J = 49.8 Hz, 1-CH2); 27.64 (10-CH2); 28.87, 28.97, 28.99, 29.04, 28.09, and 29.14 ppm (4, 5, 6, 7, 8, and 9-(CH2)6); 30.28 ppm (d, J = 15.6 Hz, 3-CH2); 118.11 ppm (d, J = 86.4 Hz, Ci of Ph); 130.44 ppm (d, J = 12.7 Hz, Cm of Ph); 131.89 ppm (C2′); 133.49 ppm (d, J = 10.0 Hz, Co of Ph); 134.98 ppm (d, J = 2.3 Hz, Cp of Ph); 140.32 and 140.86 ppm (C4′ and C5′); 148.95 ppm (C1'); 187.43 and 187.57 ppm (C3' and C6').
[10-(2,4,5-Trimethyl-3,6-dioxocyclohexa-1,4-dien-1-yl)decyl]triphenylphosphonium bromide, SkQ3 (3b): yield, 18%; TLC: Rf (CHCl3-CH3OH, 4 : 1) 0.60, Rf (CHCl3-C2H5OH-CH3COOH, 85 : 10 : 5) 0.29; HPLC: tR = 10.2 min (4.6 × 150 mm column Luna 5 µm C18(2), 1.5 ml/min, 25°C, 5-95% B for 11 min; A: 0.05% aqueous TFA; B: 0.05% TFA in MeCN); UV (CH3OH): λmax - 200, 226, and 268 nm (ε268 = 18,006 cm-1⋅M-1); ESI MS: m/z calculated for C37H44O2P, 551.72; found, 551.3; 1H-NMR: (CD3OD, 300K, AV-600) 1.26-1.40 ppm (br. m, 12H, 4, 5, 6, 7, 8, 9 - (CH2)6); 1.548 ppm (quintet, Jq = 7.58 Hz, 2H, 3-CH2); 1.671 ppm (sextet, Jsx = 8.0 Hz, 2H, 2-CH2); 1.971 ppm (quintet, Jq = 1.07 Hz, 3H, 4′(5′)-CH3); 1.985-1.989 ppm (m, 6H, 5′(4′)-CH3 and 2′-CH3); 2.461 ppm (t, Jt = 7.67 Hz, 2H, 10-CH2); 3.350-3.405 ppm (m, 2H, 1-CH2); 7.71-7.81 ppm (m, 12H, Ho and Hm of Ph); 7.87-7.90 ppm (m, 3H, Hp of Ph); 13C-NMR: (CD3OD, 303K): 12.21, 12.31, and 12.33 ppm (2′,4′, and 5′-(CH3)3); 22.78 ppm (d, J = 50.9 Hz, 1-CH2); 23.56 ppm (d, J = 4.6 Hz, 2-CH2); 27.40 (10-CH2); 29.74 ppm (8-CH2); 29.82 ppm (d, J = 1.2 Hz, 4-CH2); 30.28, 30.33, and 30.35 ppm (5, 6, and 7-(CH2)3); 30.82 ppm (9-CH2); 31.56 ppm (d, J = 16.0 Hz, 3-CH2); 120.05 ppm (d, J = 86.5 Hz, Ci of Ph); 131.56 ppm (d, J = 13.1 Hz, Cm of Ph); 134.85 ppm (d, J = 9.9 Hz, Co of Ph); 136.31 ppm (d, J = 3.0 Hz, Cp of Ph); 141.35, 141.57, and 141.66 ppm (C2', C4', and C5'); 145.58 ppm (C1′); 188.36 and 188.55 ppm (C3' and C6').
[10-(4,5-Dimethoxy-2-methyl-3,6-dioxocyclohexa-1,4-dien-1-yl)decyl]triphenylphosphonium bromide, MitoQ (3c) was described earlier [6]: the yield, 21%; HPLC: tR = 9.32 min (4.6 × 150 mm column Luna 5 µm C18(2), 1.5 ml/min, 25°C, 5-95% B for 11 min; A: 0.05% aqueous TFA; B: 0.05% TFA in MeCN); UV (C2H5OH): 275 nm (ε275 = 15,950 cm-1⋅M-1 proved to be slightly higher than that reported by Murphy [6] (10,400 cm-1⋅M-1); ESI MS: m/z calculated for C37H44O4P, 583.3; found, 583.3; IR: 3357, 2927, 2857, 1650, 1609, 1438, 1266, 1113 cm-1; 1H-NMR: (CDCl3, 303K, AV-600) 1.15-1.28 ppm (br. m, 14H, 2, 3, 4, 5, 6, 7, 8 - (CH2)8); 1.320 ppm (qt., 2H, J = 7.7 Hz, 9-CH2); 1.964 ppm (s. 3H, 2′-CH3); 2.389 ppm (t., Jt = 7.70 Hz, 2H, 10-CH2); 3.66-3.76 ppm (m., 2H, 1-CH2); 3.946, 3.949 ppm (s, s, 6H, (OCH3)2); 7.66-7.83 ppm (m., 15H, Ph). 13C-NMR: (CDCl3, 303K, AV-600): 11.82 ppm (CH3); 22.61 ppm (d, J = 4.7 Hz, 2-CH2); 22.76 ppm (d, J = 49.4 Hz, 1-CH2); 26.28 (10-CH2); 28.58, 29.04, 29.05, 29.13, 29.20, and 29.64 ppm (4, 5, 6, 7, 8, 9-(CH2)6); 30.31 ppm (d, J = 15.5 Hz, 3-CH2); 61.04 and (4′, 5′-(OCH3)2); 118.38 ppm (d, J = 85.3 Hz, Ci of Ph); 130.44 ppm (d, J = 12.8 Hz, Cm of Ph); 133.63 ppm (d, J = 9.9 Hz, Co of Ph); 134.94 ppm (d, J = 2.8 Hz, Cp of Ph); 138.62 ppm (C2'); 142.97 ppm (C1'); 144.28 and 144.31 ppm (C4' and C5'); 184.07 and 184.60 ppm (C3' and C6').
[10-(5-Methoxy-2-methyl-3,6-dioxocyclohexa-1,4-dien-1-yl)decyl]triphenylphosphonium bromide, DMQ (3d): yield, 25%; TLC: Rf (CHCl3-CH3OH-H2O, 65 : 25 : 4) 0.61; HPLC: tR = 9.11 min (4.6 × 150 mm column Luna 5 µm C18(2), 1.5 ml/min, 25°C, 5-95% B for 11 min; A: 0.05% aqueous TFA; B: 0.05% TFA in MeCN); UV (CH3OH): λmax - 224, 274, and 374 nm; ESI MS: m/z calculated for C36H42O3P, 553.69; found, 554.2; 1H-NMR: (CDCl3, 303K, DRX-500) 1.08-1.32 ppm (br. m, 12H, 4, 5, 6, 7, 8, 9 - (CH2)6); 1.58-1.69 ppm (br. m, 12H, 2, 3 - (CH2)2); 1.93 ppm (s, 3H, 2′-CH3); 2.47 ppm (t, Jt = 7.7 Hz, 2H, 10-CH2); 3.58-3.63 ppm (m, 2H, 1-CH2); 5.80 ppm (s, 3H, H4'); 7.62-7.79 ppm (m, 15H, Ph); 13C-NMR: (CD3OD, 303K): 12.17 ppm (2′-CH3); 22.68 ppm (d, J = 4.5 Hz, 2-CH2); 22.87 ppm (d, J = 49.2 Hz, 1-CH2); 26.26 (10-CH2); 28.46, 29.12, 29.20, 29.27, 29.30, and 29.67 ppm (4, 5, 6, 7, 8, and 9-(CH2)6); 30.40 ppm (d, J = 15.3 Hz, 3-CH2); 107.05 ppm (C2'); 118.47 ppm (d, J = 86.0 Hz, Ci of Ph); 130.49 ppm (d, J = 12.3 Hz, Cm of Ph); 133.74 ppm (d, J = 10.1 Hz, Co of Ph); 134.98 ppm (d, J = 2.7 Hz, Cp of Ph); 141.22 and 143.04 ppm (C1' and C2'); 158.29 ppm (C5'); 182.09 (C6'); 187.73 ppm (C3').
The compound SkQ5 (3e) was identified as the corresponding quinol, [5-(3,6-dioxy-4,5-dimethyl-phen-1-yl)pentyl]triphenylphosphonium bromide (4), and prepared by reduction of 3e with NaBH4 in CH3OH. The yield (of 4) 18%; TLC: Rf (CHCl3-CH3OH-H2O, 65 : 25 : 4) 0.59. HPLC; tR = 7.0 min (4.6 × 150 mm column Luna 5 µm C18(2), 1.5 ml/min, 25°C, 5-95% B for 11 min; A: 0.05% aqueous TFA; B: 0.05% TFA in MeCN); UV: λmax - 268, 276, and 290 nm; ESI MS: m/z calculated for C31H34O2P, 469.57; found, 470.2; 1H-NMR: (DMSO-D6, 303K, AC-200) 1.45-1.62 ppm (br. m, 6H, 2, 3, and 4 - (CH2)3); 1.97 and 2.04 ppm (s and s, 3H and 3H, 4′- and 5′-(CH3)2); 2.41 ppm (br. t, Jt = 7 Hz, 2H, 5-CH2); 3.46-3.53 ppm (m, 2H, 1-CH2); 6.37 ppm (s, 1H, H2'); 7.06 (br. s, 1H, OH); 7.69-7.92 ppm (m, 15H, Ph); 8.13 ppm (br. s, 1H, OH); 13C-NMR: (DMSO-D6, 303K): 11.89 and 12.72 ppm (4′ and 5′-(CH3)2); 20.34 ppm (d, J = 49.5 Hz, 1-CH2); 21.74 ppm (d, J = 4.3 Hz, 2-CH2); 28.75 and 29.56 (4- and 5-CH2); 29.51 ppm (d, J = 16.4 Hz, 3-CH2); 113.01 ppm (C2'); 118.46 ppm (d, J = 85.6 Hz, Ci of Ph) 120.22 ppm (C1'); 124.84 and 126.61 ppm (C4' and C5'); 130.09 ppm (d, J = 12.5 Hz, Cm of Ph); 133.41 ppm (d, J = 10.1 Hz, Co of Ph); 134.71 ppm (d, J = 2.7 Hz, Cp of Ph); 144.65 and 147.83 ppm (C3' and C6').
Triphenyl(dodecyl)phosphonium iodide (5a) was synthesized from triphenylphosphine and 1-iodododecane by a similar procedure with 3a, the treatment of 5a by HCl/dioxane solution gave corresponding chloride (5b, C12TPP): yield, 62.5%; TLC: Rf (CHCl3-CH3OH, 4 : 1) 0.73, Rf (CHCl3-CH3OH, 9 : 1) 0.55; HPLC: tR = 10.5 min (4.6 × 150 mm column Luna 5 µm C18(2), 1.5 ml/min, 25°C, 5-95% B for 11 min; A: 0.05% aqueous TFA; B: 0.05% TFA in MeCN); UV (CH3OH): λmax - 200, 224, and 268 nm; ESI MS: m/z calculated for C30H40P, 431.6; found, 431.4; 1H-NMR: (CD3OD, 303K, AV-600) 0.883 ppm (t, Jt = 7.07 Hz); 1.23-1.36 ppm (br. m, 16H, 4, 5, 6, 7, 8, 9, 10, 11 - (CH2)8); 1.569 ppm (quintet, Jq = 7.50 Hz, 2H, 3-CH2); 1.671 ppm (sextet, Jsx = 8.0 Hz, 2H, 2-CH2); 3.41-3.48 ppm (m, 2H, 1-CH2); 7.74-7.78 ppm (m, 6H, Hm of Ph); 7.80-7.85 ppm (m., 6H, Ho of Ph); 7.87-7.90 ppm (m., 3H, Hp of Ph); 13C-NMR: (CD3OD, 303K): 14.43 ppm (CH3); 22.84 ppm (d, J = 50.9 Hz, 1-CH2); 23.55 ppm (d, J = 4.3 Hz, 2-CH2); 29.89 (4-CH2); 30.34, 30.39, 30.51, 30.66, and 30.67 ppm (5, 6, 7, 8, and 9-(CH2)5); 31.55 ppm (d, J = 16.0 Hz, 3-CH2); 33.01 ppm (10-CH2); 119.98 ppm (d, J = 86.2 Hz, Ci of Ph); 131.52 ppm (d, J = 12.7 Hz, Cm of Ph); 134.84 ppm (d, J = 9.9 Hz, Co of Ph); 136.21 ppm (d, J = 2.8 Hz, Cp of Ph).
The synthesis of [10-(4,5-dimethyl-3,6-dioxocyclohexa-1,4-dien-1-yl)decyl]tributylammonium trifluoroacetate, SkQ4, (6) is outlined in Fig. S4.
11-Bromoundecanoic acid (7) was esterified with tert-butanol in the presence of N,N′-dicycloxehylcarbodiimide and N,N-dimethylaminopyridine to give tert-butyl ester (8), which was used for the synthesis of (9) followed by acid hydrolysis giving (10). Alkylation of 2,3-dimethyl-1,4-benzoquinone (1a) under the conditions described for 2a afforded crude SkQ4 (6), which was purified using a semi-preparative HPLC 10 × 250 mm column Ultrasphere 5 µm ODS, 5 ml/min, 25°C, 40-70% B for 20 min (A: 0.05% aqueous TFA; B: 0.05% TFA in MeCN): yield 5.4%; TLC: Rf (n-C4H9OH-H2O-CH3COOH, 4 : 1 : 1) 0.55; HPLC: tR = 10.06 min (4.6 × 150 mm column Luna 5 µm C18(2), 1.5 ml/min, 25°C, 5-95% B for 11 min; A: 0.05% aqueous TFA; B: 0.05% TFA in MeCN); UV (CH3OH): λmax - 202, 260, and 242 nm; ESI MS: m/z calculated for C30H54NO2, 460.75; found, 460.7; 1H-NMR: (CD3OD, 300K, AV-600): 1.019 ppm (t, JT = 7.42 Hz, 9H, CH3 of Bu); 1.27-1.40 ppm (m, 12H, 3, 4, 5, 6, 7, and 8-(CH2)6); 1.416 ppm (sextet, Jsx = 7.41 Hz, 6H, 3′′-CH2 of Bu); 1.502 ppm (quintet Jqt = 7.46 Hz, 2H, 9-CH2); 1.70-1.63 ppm (m, 8H, 2′′-CH2 of Bu and 2-CH2); 1.992-2.013 ppm (m, 6H, 4′ and 5′-(CH3)2); 2.402 ppm (dt, Jd = 1.36; Jt = 7.70 Hz, 2H, 10-CH2); 3.233 ppm (m, 8H, 1′′-CH2 of Bu and 1-CH2); 6.510 ppm (t, Jt = 1.40 Hz, 1H, H(2')); 13C-NMR: (CD3OD, 300K): 11.93 and 12.33 ppm (4′ and 5′-(CH3)2); 13.93 ppm (4′′-CH3 of Bu); 20.73 ppm (3′′-CH2 of Bu); 22.76 ppm (2-CH2); 24.83 ppm (2′′-CH2 of Bu); 27.33 ppm (3-CH2); 29.17 ppm (9-CH2), 30.05 and 30.07 ppm (8- and 10-(CH2)2); 30.31, 30.36, 30.37, and 30.39 ppm (4, 5, 6, and 7-(CH2)4); 59.55 ppm (1′-CH2 of Bu); 59.75 ppm (1-CH2); 133.18 ppm (C2'); 141.64 and 142.30 ppm (C4' and C5'); 150.56 ppm (C1'); 188.97 and 188.65 ppm (C3' and C6').Fig. S4. Synthesis of SkQ4.
Synthesis of lipophilic methyl carnitine-containing cation 2-{[11-(4,5-dimethyl-3,6-dioxocyclohexa-1,4-dien-1-yl)undecanoyl]oxy}-N,N,N-trimethyl-4-oxobutan-1-aminium chloride, SkQ2M (11) is shown in Fig. S5.
1,10-Decanedicarbonic acid (14) reacted with the oxalyldichloride to give (15), which was used for acylation of hydroxyl group of carnitine methyl ester. The derivative obtained (16) reacted with 1a under the conditions described above for the synthesis of 2a to afford SkQ2M (11). The product 11 was purified by silica gel column chromatography with CHCl3-CH3OH-H2O (65 : 25 : 4) as eluent, the final purification was done with a preparative HPLC; SkQ2M (11): the yield, 6.2%; TLC: Rf (CHCl3-CH3OH-H2O, 65 : 25 : 4) = 0.41; tR = 9.59 min (4.6 × 150 mm column Luna 5 µm C18(2), 1.5 ml/min, 25°C, 5-95% B for 11 min; A: 0.05% aqueous TFA; B: 0.05% TFA in MeCN); UV (CH3OH): λmax - 204, 260, and 346 nm; ESI MS: m/z calculated for C27H44NO6, 478.64; found, 478.4; 1H-NMR (CD3OD, 303K, AV-600): 1.27-1.35 ppm (br. m, 12 H, 4, 5, 6, 7, 8, and 9 - (CH2)6); 1.495 ppm (quintet, Jqt = 7.0 Hz, 2H, 10-CH2); 1.615 ppm (quintet, Jqt = 7.0 Hz, 2H, 3-CH2); 1.987 ppm (quartet, J = 1.14 Hz, 3H, 5′-CH3); 2.015 ppm (q, Jq = 1.12 Hz, 3H, 4′-CH3); 2.381 ppm (t, Jt = 7.57 Hz, 2H, 2-CH2); 2.397 ppm (dt, Jd = 1.36, Jt = 7.96, 2H, 11-CH2); 2.771 and 2.806 ppm (m [AB-part of ABMXY-system: JAB = 16.76 Hz, JAM = 6.96 Hz, JBM = 5.44 Hz]; 2H, 3′′-CH2); 3.196 ppm (s, 9H, -+N(CH3)3); 3.689 ppm (m [X-part ABMXY-system: JMX = 1.07 Hz, JXY = 14.46 Hz], 1H, H(1''X)); 3.860 ppm (m [Y-part ABMXY-system: JMY = 8.51 Hz, JXY = 14.46 Hz], 1H, H(1''Y)); 5.639 ppm (q [M-part of ABMXY-system: Jq = 6.80 Hz], 1H, H(2'')); 6.513 ppm (t, Jt = 1.36 Hz, 1H, H(2')).Fig. S5. Synthesis of SkQ2M.
Rhodamine derivative N-[(3Z)-9-[2-({[10-(4,5-dimethyl-3,6-dioxo-cyclohexa-1,4-dien-1-yl)decyl]oxy}carbonyl)phenyl]-6-(ethylamino)-2,7-dimethyl-3H-xanten-3-ylidene]ethanaminium chloride, SkQR1 (12), was obtained starting from 2a and Cs-salt of rhodamine 19 (12a) and then converted to chloride by aqueous HCl treatment as indicated in Fig. S6. Yield, 65%; TCL: Rf (CH3Cl-CH3OH, 4 : 1) 0.68; Rf (CHCl3-CH3OH-H2O, 65 : 25 : 4) 0.80; HPLC: tR = 24.4 min (4.6 × 250 mm column Luna 5 µm C18(2), 1 ml/min, 25°C, 0-90% B for 26.4 min; A: 100 mM H3PO4 in water; B: 100 mM H3PO4 in MeCN); M. p. 178-180°C (degr.); element anal.: calculated for C44H53ClN2O5: C, 72.86; H, 7.36; Cl, 4.89; N, 3.86; found: C, 72.53; H, 7.21; Cl, 4.22; N, 3.61; UV (C2H5OH): λmax - 250, 350, and 535 nm (ε = 80,000 cm-1⋅M-1); ESI MS: m/z (MH+) calculated for C44H51N2O5, 688.89; found, 689.4; IR(film): 3200, 2928, 2336, 1700, 1685, 1600, 1496, 1304 cm-1; 1H-NMR (DMSO-D6, 303K, AV-400): 0.95-1.25 ppm (br. m, 14H, 2, 3, 4, 5, 6, 7, 8 - (CH2)7); 1.24 ppm (t, Jt = 6.8 Hz, 6H, CH3 of -NHEt); 1.41 ppm (quintet, Jqt = 7.5 Hz, 2H); 1.92 and 1.94 (s and s, 3H and 3H, 4′ and 5′-(CH3)2); 2.09 ppm (s, 6H, 2, 7-(CH3)2); 3.48 ppm (quintet, Jq ~ 7 Hz, 4H, CH2 of -NHEt); 3.85 ppm (t, Jt = 6.3 Hz, 2H, 1-CH2); 6.57 ppm (s, 1H, H3); 6.80 and 6.91 ppm (s and s, 2H and 2H, H(1'''), H(4'''), H(5'''), and H(8''')); 7.44 ppm (dd, Jd = 7.8 Hz, Jd = 1.0 Hz; 1H, H(6'')); 7.74 ppm (t, Jt = 5.8 Hz, 2H, NH of -NHEt); 8.60-8.70 ppm (m, 2H, H(4'') and H(5'')); 8.22 ppm (dd, 1H, Jd = 8.2 Hz, Jd = 1.1 Hz, H(3'')); 13C-NMR (δ, ppm, DMSO-D6, 303K): 11.59 and 11.98 (4′ and 5′ - (CH3)2); 13.45 (CH3 of -NHEt); 17.29 (2′ and 7′-(CH3)2); 25.07, 27.29, 27.57, 28.25, 28.39, 28.51, 28.55, 28.56, and 28.65 (2, 3, 4, 5, 6, 7, 8, 9, and 10 - (CH2)9); 37.86 (CH2 of -NHEt); 64.96 (1-CH2); 93.45 (C(4''')-C(5''')); 112.78 (C(1''')-C(8''')); 125.32 (C(4'')); 128.38 (C(6'')); 129.78 and 130.75 (C(1'') and C(2'')); 130.20 and 130.22 (C(5'') and C(8a''')-C(9a''')); 131.77 (C(2''') and C(7''')); 132.85 (C(9''')); 132.88 (C(3'')); 139.79 and 140.36 (C(4') and C(5')); 148.40 (C(1')); 155.71 and 156.6 (C(4a''')-C(10a''') and C(3''')-C(6''')); 164.98 (-COO-); 186.91 and 187.000 (C(3') and C(6')).
Stability of synthesized compounds in water solution at pH 6.5 and 37°C was found to decrease in the range MitoQ < SkQ3 < SkQ1 < SkQR1. A 50% decomposition of 0.1 mM SkQ1 took 54 h. For SkQR1, this value was 3.5 h. The stability decreased with increasing pH. All the compounds studied were stable in ethanol solution as well as in the solid state. In the latter case, t1/2 for SkQ1 decomposition at 20°C was 4 months. Concentration of diluted water solution of all the above compounds was strongly affected by their sorption on the surface of some kinds of glass or plastic vessels where they were stored. Such an effect was absent if ethanol substituted for water by not less than 50%. Moreover, like other hydrophobic cations, decyltriphenylphosphonium derivatives of quinones are prone to occupy the air/water interface, so their solutions should be strongly shaken before use. The critical concentration for SkQ1 micelle formation measured with a Photocor Complex scattered laser goniometer (Photocor Instr., USA) was shown to be about 1.1 µM (Fig. S7).Fig. S6. Synthesis of SkQR1.
Electronic spectra of oxidized and reduced SkQ1 are shown in Fig. S8a. The extinction coefficient for SkQ1 in ethanol at 267 nm was 21,730 cm-1⋅M-1.Fig. S7. Estimation of critical micelle formation concentration for SkQ1.
In the next series of experiments, we compared the ESR spectra of semiquinone species of different ubiquinone and plastoquinone derivatives: MitoQ, CoQ1, SkQ1, decyl-PQ, PQ0, SkQ3, and 2,3,5-trimethyl-1,4-benzoquinone. Some of these spectra are shown on Fig. S8b. The quinones were dissolved in ethanol and reduced by NaBH4. The semiquinones were formed due to autooxidation of the corresponding quinols by O2 at pH 8.Fig. S8. Light absorption spectra of SkQ1 and SkQ1H2 (a) and EPR spectra of semiquinones of MitoQ, SkQ1, and SkQ3 (b).
The EPR spectra of radical ions of MitoQ and short-chain analog of ubiquinol (CoQ1) were found to be very similar. In both cases, the unpaired electron interacted with three protons of the methyl group at C5 and two protons of the methylene group at C6. However, hyperfine splitting due to methyl protons was about two times greater than hyperfine splitting due to methylene protons, i.e. a(3H) = 0.19 mT, a(2H) = 0.097 mT. This means that unpaired electron density at C5 and C6 atoms of the quinone ring of both MitoQ and CoQ1 differed also about twofold. In the case of Q0, unpaired electron density at C5-C6 atoms was shown to be equal to a(3H) = 0.236 mT and a(1H) = 0.197 mT.
The ESR spectra of SkQ1 and decyl-PQ can be characterized by almost identical interaction of unpaired electron with all nine protons of the quinone ring: six methyl group protons at C2 and C3, one proton at C5 and two protons of methylene group at C6: a(9H) = 0.18 mT. The ESR spectrum of decyl-PQ was practically the same. Consequently, in both cases all carbon atoms of the quinone ring equally shared the unpaired electron.
The hyperfine structure of the ESR spectra mentioned above clearly demonstrates that the semiquinones of both MitoQ and SkQ1 exist predominantly in the form of anion radicals, which could be stabilized by hydrogen bonding.
The ESR spectrum of SkQ3 was more complicated than that of SkQ1. Replacement of the proton at C5 with a methyl group resulted in a situation when the unpaired electron became more unequally shared by the carbon atoms of the quinone ring: a(9H) = 0.18 mT, a(2H) = 0.09 mT. A similar result was observed in the case of PQ0 and 2,3,5-trimethyl-1,4-benzoquinone. The ESR spectra of these short-chain analogs of SkQ1 and SkQ3, respectively, demonstrated that unpaired electron density at C1-C6 atoms of the quinone ring were quite different (for PQ0, a(6H) = 0.18 mT, a(2H) = 0.27 mT; for 2,3,5-trimethyl-1,4-benzoquinone, a(6H) = 0.181 mT, a(3H) = 0.225 mT, a(1H) = 0.191 mT).
S2: SkQs in BLM and Isolated Mitochondria
When studied in BLM, the SkQ derivatives synthesized were found to destabilize the membrane at concentrations higher than about 5.10-5 M. To study such high concentrations, thick planar phospholipid membrane (which is more stable than BLM) was used (Fig. S9). On such membranes, the SkQ concentrations could be increased to 10-3 M. Under these conditions, Nernstian diffusion potentials were obtained with SkQ1, SkQ3, MitoQ, C12TPP, and DMQ. As to SkQR1 (Fig. S9a), diffusion potential decreased below Nernstian at its concentrations above 5⋅10-5 M (most probably due to protonophorous activity of SkQR1. For SkQ2M and SkQ4, Nernstian potential was not observed even at high concentrations of these cations. However, it was increased in the presence of a penetrating anion, tetraphenyl borate (Fig. S9c).
In BLMs modified by gramicidin D, SkQ1 was shown to prevent inactivation of the gramicidin channels in the presence of a FeSO4, ascorbate, and tert-butyl hydroperoxide (Fig. S10).Fig. S9. Diffusion potentials generated across thick planar phospholipid membrane by some SkQ derivatives. For conditions, see Fig. 2, but pH 7.0.
Accumulation of SkQ1 by mitochondria in vitro is shown in Fig. S11. The SkQ1 concentration was measured by a TPP electrode [7]. One can see that the SkQ1 import by mitochondria takes about 15-20 min. Subsequent addition of uncoupler FCCP induces rather small but measurable release of SkQ1. Since the octanol/water partition coefficient for SkQ1 was about 13,000 : 1, a large portion of the SkQ1 uptake could be explained by a Δψ-independent, uncoupler-insensitive, passive sorption of SkQ1 by mitochondrial membranes, whereas the rest (uncoupler-sensitive portion) was due to the electrophoretic SkQ1 accumulation inside mitochondria. In line with this reasoning, substitution of SkQ1 by less hydrophobic SkQ5 (pentane instead of decane as a linker between triphenylphosphonium and plastoquinone; octanol/water partition coefficient about 500) decreased energy-independent uptake whereas energy-dependent uptake was increased (cf. Fig. S11, a and b).Fig. S10. Protective effects of SkQ1, SkQ3, and MitoQ upon inactivation of gramicidin channel by Fe2+, ascorbate, and tert-butyl hydroperoxide. BLM was formed from a decane solution of diphytanoyl phosphatidylcholine and diphytanoyl phosphatidylglycerol (70 and 30%, respectively). Incubation mixture (see Fig. 3a) was supplemented with 0.5 mM ascorbate and 0.5 mM tert-butyl hydroperoxide. Additions: 5 µM SkQ1 or MitoQ and 20 µM FeSO4.
Experiments showed that SkQ1 can be reduced by the mitochondrial respiratory chain. In the cases of succinate as reductant (Fig. S12), malonate added 15 min after succinate induced oxidation of SkQ1H2, which was much slower than the preceding reduction of SkQ1 by succinate. This oxidation was inhibited by myxothiazol, indicating that Complex III is competent in the SkQ1H2 oxidation, the rate of oxidation being lower than the rate of SkQ1 reduction by succinate.Fig. S11. Uptake of SkQ1 (a) and SkQ5 (b) by rat liver mitochondria. Incubation mixture, 250 mM sucrose, 5 mM Mops-KOH, 1 mM EGTA, BSA (0.2 mg/ml), 5 mM succinate, pH 7.4. Additions: each addition of SkQ1 or SkQ5 was 0.25 µM; mitochondria, 1.2 mg protein/ml; 100 nM FCCP (each addition).
Similar relationships were revealed when glutamate and malate substituted for succinate as the SkQ1 reductant (Fig. 4a (main text; here and further figures designated without “S” refer to the main article)). Rates of reduction of SkQ1 and MitoQ by succinate were found to be similar (not shown). The data of Fig. S12 indicate that SkQ1 added to mitochondria should be maintained mainly in the quinol form, a feature favorable for antioxidant activity of this compound. In line with such a conclusion, we found that addition of myxothiazol, preventing quinol oxidation by the respiratory chain, increased only slightly the antioxidant activity of SkQ1 under the Fenton reaction conditions (Fig. S13a).Fig. S12. SkQ1 can be reduced and oxidized by the mitochondrial respiratory chain. Reduction of SkQ1 was followed by measuring decrease in the light absorbance at 274 nm. For incubation mixture, see Fig. 4a. Additions: rat heart muscle mitochondria, 0.25 mg protein/ml; 2 mM malonate, 1 µM myxothiazol.
Results of a study of prooxidant activity of the cationic quinones are shown in Fig. S13, b-d. As follows from the data (Fig. S13, b and c), addition of µmolar MitoQ, SkQ1, or SkQ3 to mitochondria oxidizing glutamate and malate or succinate in State 4 strongly stimulates H2O2 production. C12TPP fails to reproduce such an effect. The H2O2 generation is strongly inhibited by rotenone (Fig. S13, b and c) or uncoupler SF6847 (Fig. S13d). In the latter case, very low (C1/2 = 6⋅10-9 M) concentration of uncoupler is required. This value is close to that for inhibiting reverse electron transfer in Complex I and much smaller than that inducing half-maximal decrease in the Δψ level. This fact as well as the complete inhibition by rotenone of H2O2 formation with succinate indicate that ROS generation induced by cationic quinones is coupled to reverse electron transfer via Complex I. As to partial rotenone inhibition of H2O2 formation with NAD-substrates, it can be explained by a Δψ collapse (due to arrest of respiration), which prevents accumulation of cationic quinones in mitochondria.Fig. S13. Anti- and prooxidant effects of SkQ and MitoQ. a) Myxothiazol is without effect on antioxidant activity of SkQ1. For incubation mixture, see Fig. 4a. Substrate, 2.5 mM succinate. Addition, 1 µM myxothiazol. b-d) Effects of MitoQ, SkQ1, SkQ3, and C12TPP on the H2O2 production by rat heart muscle mitochondria under various conditions. Incubation mixture as in Fig. 4b. Additions: 4 mM glutamate, 1 mM malate, 2 µM rotenone, 2 mM succinate, 1 µM antimycin A, 1 µM myxothiazol, and 1 µM MitoQ, SkQ1, SkQ3, and C12TPP.
S3: SkQ1 in Human Cell Cultures
As shown in the present paper, SkQ1 arrests apoptosis induced by low [H2O2] in cell cultures (Fig. 6, b and c). However, addition of large H2O2 amounts was shown to overcome the SkQ1-induced inhibition of apoptosis (Fig. S14a). As to a SkQ1-sensitive apoptosis induced by low [H2O2], it can be accounted for by the principle of ROS-induce ROS release when small amounts of ROS stimulate formation of large ROS amounts (Fig. 6d). Quite recently, Pinton et al. described a molecular mechanism of such kind of event [8]. They reported that added H2O2 stimulates phosphorylation of p66shc, a “lifespan-shortening protein”, by protein kinase Cβ. Phosphorylated protein (P-p66shc) becomes a target for proline isomerase Pin1, which converts P-p66shc to a conformer imported by mitochondria. In the mitochondrial intermembrane space, P-p66shc combines with cytochrome c, an event most probably resulting in that cytochrome c acquires ability to reduce O2 to O2-. [9]. This, in turn, increases mitochondrial [ROS] and opens the permeability transition pore in the inner mitochondrial membrane. The latter event leads to release of cytochrome c and other pro-apoptotic proteins from mitochondria to cytosol, thereby initiating apoptosis.
One of steps of the above cascade, namely, H2O2-induced cytochrome c release, was already confirmed in our group (Fig. S14b). In the same experiment, the proapoptotic protein BAX was shown to migrate to mitochondria in the H2O2-treated cells. Both processes were arrested by SkQ1. Identification of p66shc as a possible player in this episode is now under investigation.Fig. S14. a) Dependence of apoptosis of human fibroblasts upon the H2O2 concentration with and without SkQ1 pre-treatment. Where indicated, cells were pre-treated with 20 nM SkQ1 for 7 days. b) Effect of SkQ1 pre-treatment on localization of cytochrome c (green) and BAX (red) in HeLa cells treated with 200 µM H2O2 for 7 h. SkQ1 as in (a). Cytochrome c and BAX were stained with specific antibodies (Pharmingen). Arrows indicate apoptotic cells. c) Effect of 20 nM SkQ1, DPQ, and C12TPP on the H2O2-induced apoptosis of human fibroblasts. Cells were pre-treated with SkQ1, C12TPP, or DPQ for 7 days. Where indicated, 400 µM H2O2 was added. Apoptosis was measured after 24 h.
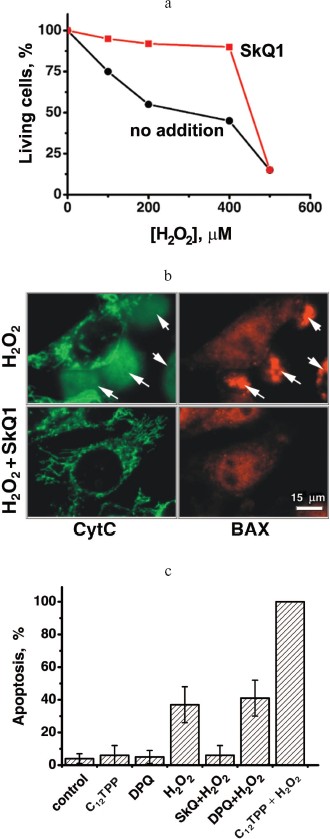
Figure S14c shows that antiapoptotic effect of SkQ1 on the H2O2-treated cells cannot be reproduced by C12TPP and decylplastoquinone (DPQ), compounds of similar hydrophobicity but lacking either quinone or cationic residue. Even more, C12TPP proved to stimulate the H2O2-induced apoptosis.
Figure S15 shows that SkQ1 is more effective than MitoQ in protection against H2O2-induced fragmentation of mitochondria in HeLa cells. Prooxidant effect of SkQ1 was observed at higher concentrations and was prevented by Trolox.
In Fig. S16, concentration dependence of anti-necrotic SkQ1 effect is seen, C1/2 being within (2-5)⋅10-7 M SkQ1.Fig. S15. H2O2-induced fission of elongated mitochondria in HeLa cells. SkQ1, MitoQ, or 0.1 mM Trolox was added 2 h before the 350 µM H2O2 treatment. Number of cells with small mitochondria was measured 20 h after the H2O2 treatment.
Fig. S16. SkQ1 protects against a light-induced necrosis. SkQ1 was added 1 h before illumination. Conditions as in Fig. 6f.
REFERENCES
1.Severina, I. I., and Skulachev, V. P. (1984)
FEBS Lett., 165, 67-71.
2.Liu, X., Jiangs, N., Hughes, B., Bigras, E.,
Shoubrudge, E., and Hekimi, S. (2005) Genes Dev., 19,
2424-2434.
3.Arnold, R. T., and Zaugg, H. E. (1941) J. Am.
Chem. Soc., 63, 1317-1320.
4.Gu, L. Q., and Yu, C. A. (1983) Biochem.
Biophys. Res. Commun., 113, 477-482.
5.Jacobsen, N., and Torsell, K. (1973) Acta Chem.
Scand., 27, 3211-3216.
6.Kelso, G. F., Porteous, C. M., Coulter, C. V.,
Hughes, G., Porteous, W. K., Ledgerwoodj, E. C., Smith, R. A. J., and
Murphy, M. P. (2001) J. Biol. Chem., 276, 4588-4596.
7.Hockings, P. D., and Rogers, P. J. (1996)
Biochim. Biophys. Acta, 1282, 101-106.
8.Pinton, P., Rimessi, A., Marchi, S., Orsini, F.,
Migliaccio, E., Giorgio, M., Contursi, C., Minucci, S., Mantovani, F.,
Wieckowski, M. R., del Sal, G., Pelicci, P., and Rizzuto, R. (2007)
Science, 315, 659-663.
9.Markova, O. V., Evstafieva, A. G., Mansurova, S.
E., Moussine, S. S., Palamarchuk, L. A., Pereverzev, M. O.,
Vartapetian, A. B., and Skulachev, V. P. (2003) Biochim. Biophys.
Acta, 1557, 109-117.