Enhanced Production and Characterization of a β-Glucosidase from Bacillus halodurans Expressed in Escherichia coli
S. Naz1, N. Ikram1, M. I. Rajoka2, S. Sadaf1,3, and M. W. Akhtar1*
1School of Biological Sciences, University of the Punjab, Lahore 54590, Pakistan; fax: +92(42)923-0980; E-mail: mwapu@brain.net.pk2National Institute of Biotechnology and Genetic Engineering, Jang Road, Faisalabad, Pakistan
3Institute of Biochemistry and Biotechnology, University of the Punjab, Lahore 54590, Pakistan
* To whom correspondence should be addressed.
Received August 25, 2009; Revision received October 3, 2009
A putative β-glucosidase gene from the genome of Bacillus halodurans C-125 was expressed in E. coli under the regulation of T7lac promoter. On induction with isopropyl-β-D-1-thiogalactopyranoside, the enzyme expressed at ~40% of the cell protein producing 238 mg/liter culture. With increase in culture cell density to A600 12 in auto-inducing M9NG medium, β-glucosidase production increased 3-fold. Approximately 70% of the expressed enzyme was in a soluble form, while the rest was in an insoluble fraction of the cell lysate. The soluble and active form of the expressed enzyme was purified by ammonium sulfate precipitation followed by ion-exchange chromatography to a purity >98%. The mass of the enzyme as determined by MALDI-TOF mass spectrometry was 51,601 Da, which is nearly the same as the calculated value. Phylogenetic analysis of the β-glucosidase of B. halodurans was found to cluster with members of the genus Bacillus. Temperature and pH optima of the enzyme were found to be 45°C and 8.0, respectively, under the assay conditions. Km and kcat against p-nitrophenyl-β-D-glucopyranoside were 4 mM and 0.75 sec–1, respectively. To our knowledge, this is the first report of high-level expression and characterization of a β-glucosidase from B. halodurans.
KEY WORDS: expression, auto-inducing medium, MALDI-TOF analysis, β-glucosidase, Bacillus halodurans, E. coliDOI: 10.1134/S0006297910040164
Abbreviations: BglA, β-glucosidase A; CDSs, protein coding sequences; IPTG, isopropyl-β-D-1-thiogalactopyranoside; MALDI-TOF, matrix assisted laser desorption ionization-time-of-flight; PNPG, p-nitrophenyl-β-D-glucopyranoside.
β-Glucosidases (EC 3.2.1.21) are important components of the
consortium of enzymes used for complete conversion of cellulose, a
major carbohydrate polymer of plant cell wall, into glucose. They act
specifically on the β1→4 linkages of two glucose or
glucose-substituted molecules (e.g. the disaccharide cellobiose)
produced by the action of exo- and endocellulases and catalyze
hydrolysis of terminal non-reducing residues into β-D-glucosides.
Cellulase systems either lacking or having low levels of
β-glucosidases have been found to have poor saccharification power
with susceptibility to end-product inhibition [1].
β-Glucosidases are produced naturally by a variety of organisms including plants, animals, bacteria, fungi, and termites [2]. Their heterologous expression in E. coli, however, offers possibilities for improved saccharification of cellulosic substrates. The production of β-glucosidases by Bacillus species have been studied previously [3-7], and the genes encoding β-glucosidase, bglA of B. polymyxa [4], bgHl of B. pumilus [6], and Bgl of B. circulans, [7] have been cloned and expressed in E. coli.
Bacillus halodurans C-125 is a facultative alkalophile that grows well at pH 7.0 to 10.5 [8]. Its genome analysis shows the presence of 4066 protein coding sequences (CDSs), of which several are putative glucosidase genes. One of the genes, designated as BH1923, found in position 213,403 to 214,746 in the genome sequence, encodes a putative β-glucosidase of 447 amino acids [9]. We describe here enhanced production, purification, and characterization of this β-glucosidase (BglA) expressed in E. coli.
MATERIALS AND METHODS
Bacterial strains, plasmids, media, and chemicals. Bacillus halodurans C-125 strain ATCC BAA-125 was obtained from the American Type Culture Collection. Escherichia coli DH5α was used as cloning host for vector propagation. For expression studies, E. coli BL21(DE3) CodonPlus (Stratagene, USA) was used. The expression plasmid pET-22b(+) was from Novagen (USA). Cultivation media used included Luria–Bertani (LB) and M9NG [10]. Restriction enzymes, T4 DNA ligase, Taq DNA polymerase, and InsT/AcloneTM PCR product cloning kit were from MBI Fermentas (USA), whereas QIAquick DNA gel extraction and QIAprep spin miniprep kits were from Qiagen (USA). All other chemicals used were of analytical grade.
PCR amplification and cloning of BglA. Bacillus halodurans C-125 was grown aerobically at 37°C in 50 ml trypticase soya broth (Sigma-Aldrich, USA) and its genomic DNA was prepared according to the previously described method [11]. Using genomic DNA as template, a 50 µl reaction was set up in the presence of gene-specific forward (5′-CCATATGGTGTCGATCAACATTCAATTTCCGAAAG-3′) and reverse (5′-GAGTCGACTAAAGTTCAAAGAACTGATTGGCAATC-3′) primers for the amplification of BglA. The forward primer contained a restriction site for NdeI at the 5′-end, while the reverse primer had a SalI site (shown in italics). The PCR conditions used were: initial denaturation at 94°C for 3 min followed by 30 cycles of denaturation at 94°C for 45 sec, annealing at 60°C for 30 sec, extension at 72°C for 110 sec, and final extension at 72°C for 20 min.
The amplified product was purified using a QIAquick gel extraction kit, T/A cloned in pTZ57R/T vector, and then subcloned between NdeI and SaII sites of the pET-22b(+) vector to generate pET-BglA expression plasmid, which was maintained in E. coli DH5α, selected on LB medium containing 100 µg/ml ampicillin. The junction sequences of the recombinant plasmid were confirmed by sequence analysis using a Beckman Coulter CEQTM Genetic Analyzer.
Expression and solubility analysis. Escherichia coli BL21(DE3) CodonPlus competent cells were transformed with the recombinant plasmid pET-BglA for expression analysis. Cells from a single colony of the positive transformant, as confirmed by restriction digestion and colony PCR, were grown overnight in 10 ml LB-ampicillin medium at 37°C. One percent of this overnight culture was used to inoculate 200 ml fresh medium followed by incubation at 37°C in an orbital incubator shaker at 150 rpm (Irmeco GMBH, Germany). Protein expression was induced with either 0.6 mM isopropyl-β-D-1-thiogalactopyranoside (IPTG) or auto-induced with 10 mM lactose, at culture density A600 of 0.5-0.6. Cells were allowed to grow till the maximum growth was attained (~12 h) and then harvested by centrifugation at 4500 rpm for 15 min. During cultivation, 1 ml aliquots were collected after every 2 h to monitor growth (A600) and analyze protein expression by 12% SDS-PAGE [12].
To analyze the expression of BglA in soluble or insoluble form, cells from 10 ml aliquot of the culture (A600 = 4.0) were collected by centrifugation (4500 rpm, 10 min), resuspended in 800 µl of 50 mM glycine-NaOH buffer (pH 8.0), disrupted by sonication (10 × 30 sec bursts with intervals of 1 min between successive pulses) in a UP 400s ultrasonicator (Dr. Hielscher GmbH, Germany), and then centrifuged as described earlier. The soluble and insoluble fractions thus obtained were analyzed by 12% SDS-PAGE, and percentage of BglA was determined by densitometric scanning of the Coomassie stained gel (GeneTools, Syngene, UK).
Purification. Cell pellet from 100 ml culture grown in M9NG medium (A600 = 12.0) was resuspended in 20 ml of 50 mM glycine-NaOH buffer (pH 8.0) containing 0.1 mM phenylmethylsulfonyl fluoride. Following sonication (as described above), proteins in the soluble fraction of the total cell lysate were precipitated by adding ammonium sulfate slowly to 65% saturation and incubating at 4°C for 2 h. The precipitates were collected by centrifugation (6500 rpm, 30 min, 4°C), dissolved in 35 ml of 50 mM glycine-NaOH buffer (pH 8.0), and dialyzed overnight against three changes of the same buffer. The dialyzate was filtered through a 0.45 µm Millipore filter and fractionated on an AKTA Explorer 10 (GE-Healthcare, USA) fitted with a Resource Q anion exchange column (1.6 × 3.0 cm). After equilibration with 50 mM glycine-NaOH buffer (pH 8.0), 5 ml of the sample was loaded and the proteins were eluted with a linear gradient of 0-1 M NaCl in the equilibration buffer at a flow rate of 1 ml/min. One milliliter fractions collected during elution were analyzed for BglA activity.
β-Glucosidase assay. BglA activity was determined by measuring hydrolysis of p-nitrophenyl-β-D-glucopyranoside (PNPG) following the previously described method [13]. Reaction mixture (1 ml) containing 2 mM PNPG in 50 mM glycine-NaOH buffer (pH 8.0) was mixed with an appropriately diluted enzyme solution and incubated at 45°C for 10 min. The reaction was stopped by adding 2 ml of 1 M Na2CO3, and p-nitrophenol thus released was measured at 400 nm. One unit of β-glucosidase activity is defined as the amount of enzyme liberating 1 µmol of p-nitrophenol per minute under the assay conditions.
MALDI-TOF analysis. MALDI-TOF mass spectrometric analysis was performed using an AutoFlex III Smart Beam System of Bruker Daltonics (Germany). One microliter of purified BglA sample mixed with sinapinic acid solution was loaded onto the sample plate and analyzed in linear positive mode with bovine serum albumin as standard. The spectrum was obtained by averaging 3000 shots at 80% laser intensity in detection range of 20,000-100,000 Da, and the final spectrum was subjected to smoothing and baseline subtraction.
Enzyme characterization. Effect of pH on the enzyme activity at 45°C was determined by using 50 mM phosphate (pH 6.0 to 7.0), Tris-glycine (pH 7.0 to 8.5), and glycine-NaOH (pH 8.0 to 10.0) buffers. Effect of temperature on activity was determined in the range 35-60°C at pH 8.0. Effect of temperature and pH on enzyme stability was determined by incubating the enzyme at different temperatures and pH for periods up to 4 h and assaying the residual activity.
Kinetic parameters for BglA were determined by incubating the enzyme in 50 mM glycine-NaOH buffer (pH 8.0) with PNPG as substrate at concentrations ranging from 0.5 to 6.0 mM in the reaction mixture. The release of p-nitrophenol was determined as described above. The values of the Michaelis constant (Km) and the catalytic constant (kcat) were determined from the Lineweaver–Burk plot.
Phylogenetic analysis. Nucleotide sequences of β-glucosidases from 29 different species were retrieved using the BLAST program available at the NCBI server (www.ncbi.nlm.gov), and multiple sequence alignments were performed using the MegAlign program of the DNASTAR software package. For the construction of phylogenetic dendrogram, the ClustalX program, based on the neighbor-joining method, was used with default alignment parameters [14]. The tree was manipulated and printed using Treeview [15].
RESULTS AND DISCUSSION
Construction of expression plasmid. An approximately 1.3 kb fragment of BglA containing NdeI and SalI sites at the 5′ and 3′ termini, respectively, was PCR amplified and cloned in T7lac promoter-based pET-22b(+) vector at NdeI/SalI sites to generate pET-BglA expression plasmid (Fig. 1). The recombinant plasmid was first maintained in E. coli DH5α for vector propagation and then transformed into E. coli BL21(DE3) CodonPlus for expression studies. Presence of the insert in positive transformants was confirmed by colony PCR and restriction digestion, which showed the presence of a 1.3 kb fragment in each case (data not shown). The sequencing results showed that the insert was in the correct frame and had the correct sequence at both the 5′- and 3′-ends.
Expression with IPTG induction. Escherichia coli cells containing pET-BglA were grown in LB-ampicillin and induced initially with IPTG. Protein analysis of the induced E. coli cells by SDS-PAGE showed a prominent band at a position corresponding to ~51 kDa, which matches the calculated molecular mass of BglA (Fig. 2). As expected, no band of similar size and intensity was present in the uninduced cells. The expression levels increased rapidly reaching a maximum of ~40% of the total E. coli cellular proteins within ~4 h of induction and remained constant thereafter. Optimal IPTG concentration for induction was found to be 0.6 mM.Fig. 1. Construct of pET-BglA expression plasmid. Sequences shown in italics represent the sites for NdeI and SalI restriction enzymes. rbs, ribosome binding site; pT7lac, T7lac promoter; ampr, gene for ampicillin resistance; ori, origin of replication.
Expression in auto-inducing medium. Induction with lactose at a concentration of 10 mM showed a similar level of expression as in the case of IPTG (Figs. 2a and 2b). However, lactose supported exponential growth of E. coli to relatively higher cell densities. As shown in Table 1, the cell growth achieved in LB medium, following lactose induction, was almost twice that obtained with IPTG induction. Accordingly, the final yield of BglA in the lactose-induced culture was 468 mg/liter as compared to 238 mg/liter from the IPTG induced culture. To further improve the yield of BglA, M9NG medium was used in place of LB. This medium has been successfully used to obtain higher cell densities of E. coli (up to A600 of 18) expressing a eukaryotic protein earlier in our laboratory [10]. Maximum A600 attained in this study was 12.0, maintaining the expression level of 40% of the total cell proteins when the flasks were incubated at 150 rpm, producing 714 mg BglA per liter of culture (Table 1). Higher BglA production in the auto-inducing M9NG medium seemed to be due to higher cell density. Lactose has been found previously also to be as effective as IPTG for inducing recombinant proteins in E. coli [16]. Higher cell-densities obtainable in an auto-inducing medium, maintaining the same level of expression as in the case of IPTG induction, were reported previously to result in a greater amount of product formation [17].Fig. 2. SDS-PAGE analysis of cell proteins of pET-BglA transformed E. coli cells after induction with 0.6 mM IPTG (a) and 10 mM lactose (b). Lanes: M, protein markers; 1-4) induction for 0, 2, 4, and 8 h, respectively.
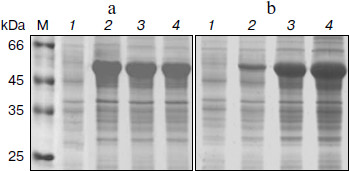
Table 1. Summary of transformed E.
coli cell densities (A600), wet cell weight
(WCW), total cell protein (TCP), and BglA production in LB and M9NG
media
Purification of BglA. The proportion of expressed BglA in the soluble form in the E. coli cells was ~70% of the total cell protein when analyzed by SDS-PAGE (Fig. 3a). This proportion amounted to approximately 500 mg BglA per liter.
Proteins in 20 ml of the cell lysate supernatant were precipitated with 65% saturated ammonium sulfate. The redissolved precipitates, after dialysis, showed 1.2-fold purification with a recovery of ~73%. The pooled fractions containing BglA activity from the anion exchange column (Fig. 3b) showed specific activity 38.5 U/mg, with 2.6-fold purification and a recovery of ~60% (Table 2). Other research groups have described the specific activities of β-glucosidases from various microorganisms in the range of 5-979 U/mg [18-20].Fig. 3. Purification and mass analysis of BglA of B. halodurans expressed in E. coli. a) SDS-PAGE analysis of the enzyme samples at different stages of purification. Lanes: M, protein markers; 1-4) total cell proteins, soluble proteins, dialyzed sample, and FPLC purified BglA, respectively. b) Elution profiles of the BglA sample fractionated on Resource-Q column: 1) proteins; 2) β-glucosidase activity. c) MALDI-TOF analysis of purified recombinant BglA.
Table 2. Summary of purification of
recombinant BglA expressed in E. coli
SDS-PAGE and densitometric analysis of the stained gel indicated that the purity of enzyme was >98% (Fig. 3a). A single peak of 51,601 Da, as analyzed by MALDI-TOF mass spectrometry (Fig. 3c), was found to be nearly the same as theoretical mass of 51,593 Da.
Characteristics of BglA. BglA showed the highest activity at pH 8.0 in glycine-NaOH buffer (Fig. 4a). The enzyme retained >90% residual activity at pH 7.5-8.0 when incubated at 45°C for 1 h. The enzyme, however, was found to lose activity at pH > 8.0, the rate of inactivation increasing with increasing pH. At pH 9.5, the residual activity was only about 20% after incubation at 45°C for 1 h (Fig. 4b).
The optimal temperature under the assay conditions used was 45°C. The enzyme activity was 95 U/ml when assayed against PNPG as substrate (Fig. 4c). BglA retained 80% of its activity on incubation at temperatures up to 45°C for 1 h, loosing activity with longer incubation periods. At higher temperatures a sharper decline in the activity was observed (Fig. 4d).Fig. 4. Effect of pH on activity (a) and stability (b) of recombinant BglA at 45°C. Effect of temperature on activity (c) and stability (d) of recombinant BglA at pH 8.0. Temperatures (°C): 1) 45; 2) 50; 3) 60.
The Km and kcat values derived from the Lineweaver–Burk plot obtained with PNPG as substrate were 4 mM and 0.75 sec–1, respectively.
Phylogeny of BglA. The enzyme was characterized with respect to its sequence similarities with β-glucosidases from related Bacillus species. A phylogenetic dendrogram constructed using the neighbor-joining method showed that the putative gene sequence of BglA of B. halodurans clusters with members of genus Bacillus (B. circulans, Paenibacillus sp., and B. polymyxa) and produce a distinct clade. The relative positions of these genes are well supported by bootstrapping as shown in Fig. 5. At the nucleotide level, BglA, respectively, shared 56.1, 56.0, and 54.3% identities with these species. However, at amino acid levels, the percentage identities were relatively higher, ranging between 60-62%.
This study reports for the first time a high-level expression of a BglA of B. halodurans in E. coli using a relatively inexpensive auto-inducing medium.Fig. 5. Phylogenetic dendrogram of the complete nucleotide sequences of the β-glucosidase genes from 29 different species available in the databases. The sequences included in this study were accession No. M60210 (B. polymyxa), AB198338 (Paenibacillus sp.), M96979 (B. circulans), BA000004 (B. halodurans C-125 position 213403 to 214746), M19033 (Agrobacterium sp.), CP000633 (A. vitis S4 chromosome), CP000628 (A. radiobacter K84 chromosome 1), CP001389 (Rhizobium sp. NGR234), CP000850 (Salinispora arenicola CNS-205), CP000820 (Frankia sp. EAN1pec), CP000267 (Rhodoferax ferrireducens T118), CP001615 (Exiguobacterium sp. AT1b), AB009410 (Bacillus sp.), X60268 (Clostridium thermocellum), CP000568 (C. thermocellum), CP000924 (Thermoanaerobacter pseudethanolicus), CP001098 (Halothermothrix orenii H 168), AY151267 (Fervidobacterium sp. YNP), P000771 (F. nodosum Rt17-B1), M60211 (B. polymyxa), CP000875 (Herpetosiphon aurantiacus), CP000749 (Marinomonas sp. MWYL1), NM123831 (Arabidopsis thaliana BGLU13), BT033043 (A. thaliana unknown protein At5g44640 mRNA), XM002479153 (Talaromyces stipitatus ATCC 10500), CR522870 (Desulfotalea psychrophila LSv54 chromosome), AE005176 (Lactococcus lactis subsp. lactis Il1403), CP000721 (C. beijerinckii NCIMB 8052), and CP001657 (Pectobacterium carotovorum subsp. carotovorum PC1). The tree is rooted on a distant sequence of a Pedilanthus leaf curl virus PedLCV (Accession No. AM712436). Vertical distances are arbitrary, while the horizontal distances are proportional to mutational changes. The numbers at each branch point represent percentage bootstrap confidence score (1000 replicates).
This study was supported by a grant from the Ministry of Science and Technology, Government of Pakistan.
REFERENCES
1.Gusakov, A. V., and Sinitsyn, A. P. (1992)
Biotechnol. Bioeng., 40, 663-671.
2.Woodward, J., and Wiseman, A. (1982) Enzyme
Microb. Technol., 4, 73-79.
3.Ogunseitan, A. O. (2003) Afr. J.
Biotechnol., 2, 596-601.
4.Painbeni, E., Valles, S., Polaina, J., and Flors,
A. (1992) J. Bacteriol., 174, 3087-3091.
5.Papalazaridou, A., Charitidou, L., and Sivropoulou,
A. (2003) J. Endotoxin Res., 9, 215-224.
6.Bogas, A. C., Watanabe, M. A. E., Barbosa, A.,
Vilas-Boas, L., Bonatto, A. C., Dekker, R., Souza, E. M., and Fungaro,
M. H. P. (2007) Genet. Mol. Biol., 30, 100-104.
7.Paavilainen, S., Hellman, J., and Korpela, T.
(1993) Appl. Environ. Microbiol., 59, 927-932.
8.Takami, H., and Horikoshi, K. (1999) Biosci.
Biotech. Biochem., 63, 943-945.
9.Takami, H., Nakasone, K., Takaki, Y., Maeno, G.,
Sasaki, R., Masui, N., Fuji, F., Hirama, C., Nakamura, Y., Ogasawara,
N., Kuhara, S., and Horikoshi, K. (2000) Nucleic Acids Res.,
28, 4317-4331.
10.Sadaf, S., Khan, M. A., and Akhtar, M. W.
(2007) Biotechnol. Appl. Biochem., 47, 21-26.
11.Rodriguez, R. L., and Tait, R. C. (1983)
Recombinant DNA Techniques: An Introduction, Addision-Wesley
Publishing Co.
12.Laemmli, U. K. (1970) Nature, 277,
680-685.
13.Cai, Y. J., Buswell, J. A., and Chang, S. T.
(1998) Enzyme Microbiol. Technol., 22, 122-129.
14.Thompson, J. D., Gibson, T. J., Plewniak, F.,
Jeanmougin, F., and Higgins, D. G. (1997) Nucleic Acids Res.,
25, 4876-4882.
15.Page, R. D. M. (1996) Comput. Appl.
Biosci., 12, 357-358.
16.Monteiro, P., Souza, E. M., Yates, M. G.,
Pedrosa, F. O., and Chubatsu, L. S. (2000) Can. J.
Microbiol., 46, 1087-1090.
17.Giomarelli, B., Schumacher, K. M., Taylor, T. E.,
Sowder, R. C., Hartley, J. L., McMahon, J. B., and Mori, T. (2005)
Protein Exp. Purif., 47, 194-202.
18.Li, X., and Calza, R. E. (1991) Enzyme Microb.
Technol., 13, 622-628.
19.Bronnenmeier, K., and Staudenbauer, W. L. (1988)
Appl. Microbiol. Biotechnol., 28, 380-386.
20.Watanabe, T., Sato, T., Yoshioka, S., Koshijima,
T., and Kuwahara, M. (1992) Eur. J. Biochem., 209,
651-659.