Interaction of Short Peptides with FITC-Labeled Wheat Histones and Their Complexes with Deoxyribooligonucleotides
L. I. Fedoreyeva1,2, T. A. Smirnova1,2, G. Ya. Kolomijtseva2, V. Kh. Khavinson3, and B. F. Vanyushin1,2*
1All Russia Research Institute of Agricultural Biotechnology, Russian Academy of Agricultural Sciences, ul. Timiryazevskaya 42, 127550 Moscow, Russia2Lomonosov Moscow State University, Belozersky Institute of Physico-Chemical Biology, 119991 Moscow, Russia; E-mail: vanyush@belozersky.msu.ru
3St. Petersburg Institute of Bioregulation and Gerontology, Russian Academy of Medical Sciences, pr. Dinamo 3, 197110 St. Petersburg, Russia
* To whom correspondence should be addressed.
Received July 22, 2012; Revision received October 8, 2012
Judging from fluorescence modulation (quenching), short peptides (Ala-Glu-Asp-Gly, Glu-Asp-Arg, Ala-Glu-Asp-Leu, Lys-Glu-Asp-Gly, Ala-Glu-Asp-Arg, and Lys-Glu-Asp-Trp) bind with FITC-labeled wheat histones H1, H2B, H3, and H4. This results from the interaction of the peptides with the N-terminal histone regions that contain respective and seemingly homologous peptide-binding motifs. Because homologous amino acid sequences in wheat core histones were not found, the peptides seem to bind with some core histone regions having specific conformational structure. Peptide binding with histones and histone–deoxyribooligonucleotide complexes depends on the nature of the histone and the primary structures of the peptides and oligonucleotides; thus, it is site specific. Histones H1 bind preferentially with single-stranded oligonucleotides by homologous sites in the C-terminal region of the protein. Unlike histone H1, the core histones bind predominantly with double-stranded methylated oligonucleotides and methylated DNA. Stern–Volmer constants of interaction of histone H1 and core histones with double-stranded hemimethylated oligonucleotides are higher compared with that of binding with unmethylated ones. DNA or deoxyribooligonucleotides in a complex with histones can enhance or inhibit peptide binding. It is suggested that site-specific interactions of short biologically active peptides with histone tails can serve in chromatin as control epigenetic mechanisms of regulation of gene activity and cellular differentiation.
KEY WORDS: histones, short peptides, interaction, binding, histone–oligonucleotide–peptide complexes, DNA methylation, wheat, plant, epigeneticsDOI: 10.1134/S0006297913020053
Abbreviations: FITC, fluorescein isothiocyanate.
Short peptides as the signal molecules can induce or inhibit various
genetic processes and biochemical reactions in cells [1]. The molecular mechanisms of action of the short
peptide are mainly unknown. One of these mechanisms seems to be
site-specific interaction of peptides with DNA, which results in
changes in DNA transcription and gene expression [1]. Short peptides can both bind site-specifically
with DNA and recognize their methylation status; in other words, the
peptide binding can depend on DNA methylation [2].
The specific DNA–peptide binding seems to compete with DNA
binding with different proteins operating with DNA including enzymes
(endonucleases, RNA- and DNA-polymerases, DNA-methyltransferases),
transcription factors, and others. It was established that some short
peptides modulate the action of eukaryotic endonucleases [3]. This influence of peptides on endonuclease action
is modulated by histones (histone H1) [3]. Perhaps
such modulated endonuclease action changed by histones can be due to
protein–protein interactions between peptides and histones.
Unfortunately, now practically nothing is known about the interaction
of short peptides with histones. Nevertheless, such interactions may
play essential roles in the cell during the action of short peptides at
the chromatin level.
The goal of the present work was to investigate the interaction of various short peptides with wheat fluorescein isothiocyanate (FITC)-labeled histones (H1 histone subfractions, core histones) and histone complexes with deoxyribooligonucleotides of various primary structures.
MATERIALS AND METHODS
Histones were isolated from 4-5-day-old seedlings of winter Mironovskaya 808 wheat variety (Triticum aestivum L.). Seedling growth and their partial growth synchronization were done as described earlier [4]. Initially, the preparation of partially purified nuclei was obtained from seedlings [5], and then total histones were thrice extracted from this preparation with 0.25 M H2SO4 or only histone H1 was extracted with 0.74 M HClO4 [5, 6]. The histones were precipitated from extracts with acidified acetone. Precipitates washed with acetone and dried were dissolved in buffer for electrophoresis, and the proteins were separated by electrophoresis in 15% SDS-polyacrylamide gel. Gel areas with corresponding separate proteins stained with Coomassie R-250 were cut off, and the proteins were isolated from them by electroelution [6]. The eluted proteins were precipitated and treated similarly as done on isolation of total H1 and redissolved in deionized water. Protein concentration in the resulting preparations was determined by staining of an aliquot on membranes by a method [7] using a respective calibration curve.
FITC-labeled histones were prepared by addition of FITC solution in 0.5 M sodium bicarbonate to solutions of individual histone H1 subfractions [8]. The fluorescence label was introduced into the proteins at protein/fluorescence probe molar ratio equal to 1 : 1. The reaction mixture was kept at room temperature for 30 min with agitation. Free FITC was eliminated by filtration of the solution through an Amicon 3000 membrane. The resulting FITC-labeled histones were analyzed by chromatography using a BioLogic DuoFlow apparatus (USA) on a C-4 column in a concentration gradient (0-100%) of acetonitrile in 1% trifluoroacetic acid.
Incorporation of fluorescence probe into histones was determined by the absorption spectrum using the equation:
[FITC-Histone] = (A280 – 0.24A495)/ε·l,
where Ais the absorption value at the given wavelength, ε is histone extinction coefficient equal to 4470 M–1·cm–1 (assuming that the absorption spectrum of the protein itself does not change significantly on modification), and l is optical pathlength (cm) [9]. Fluorescence label was incorporated into proteins with protein/label molar ratio 1 : 1 (0.8-1.2), and it was located on the N-terminal α-amino group of the protein [8].
Fluorescence spectra were obtained on excitation with 413 nm light and registered within 480-580 nm range using a PerkinElmer LS 55 spectrofluorimeter (USA). Absorption spectra were measured on a Cary 300 spectrophotometer (USA).
Deoxyribooligonucleotides of particular primary structures were synthesized and kindly presented to us by Syntol (Russia). Complementary oligonucleotides were melted together, and thus respective unmethylated and methylated double-stranded oligonucleotides were obtained.
Phage λ DNA were purchased from Fermentas (Lithuania); unlike unmethylated phage DNA (dcm–,dam–), methylated phage DNA (dcm+,dam+) contains 5-methylcytosine residues in Cm5CWGG sequences and N6-methyladenine residues in Gm6ATC sites.
Short peptides epithalon (Ala-Glu-Asp-Gly), pinealon (Glu-Asp-Arg), bronchogen (Ala-Glu-Asp-Leu), testagen (Lys-Glu-Asp-Gly), cardiogen (Ala-Glu-Asp-Arg), and pancragen (Lys-Glu-Asp-Trp) synthesized in St. Petersburg Institute of Bioregulation and Gerontology were used in this work. Purity degree of the peptides was monitored, and if necessary they were additionally purified by chromatography using the BioLogic DuoFlow apparatus on a C-18 column in the acetonitrile concentration gradient (0-60%) in 1% trifluoroacetic acid.
RESULTS AND DISCUSSION
Electrophoretic fractionation of histone H1 isolated from partially purified nuclear fraction of wheat seedlings is shown in Fig. 1. Unlike histone H1 from rat liver (Fig. 1), wheat histone H1 was separated by SDS-PAGE into six components (bands) with lower electrophoretic mobility corresponding to that of individual proteins [5]. For more detailed further investigation, we chose histone H1 subfractions with maximal (H1/1), medium (H1/3), and lowest (H1/6) electrophoretic mobilities, respectively. These proteins were isolated from the gel by electroelution and identified by mass spectrometry in accordance with known NCBI data on primary structures of the wheat histone H1 subfractions.
Fig. 1. SDS-PAGE of histones: a) total wheat histones H1; b) total histones H1 from rat liver; c) total wheat core histones; d) total core histones from rat liver.
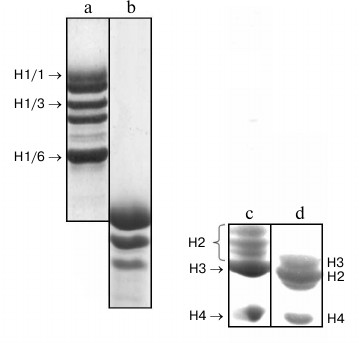
Wheat core histones also have other mobility on SDS-PAGE compared with respective animal core histones (Fig. 1, c and d). Wheat histones H3 or H4, similarly to the animal ones, are represented by one component, wheat histones H2a and H2B are located not between histones H3 and H4 but higher than histone H3, and each of them is represented by two bands.
The fluorescence quenching method was used for investigation of peptide–protein interactions. As markedly fluorescent amino acids, plant histones contain only tyrosine residues. Incorporation of fluorescence probe FITC into the histones allowed us to significantly increase sensitivity of the method compared with measurement of intrinsic protein fluorescence. The maximum of the fluorescence spectra of all fluorescence-labeled histones was at about 515 nm (Fig. 2). This demonstrates that the microenvironment of the fluorescence probe in all the histones is more or less similar. In particular, this allowed us to comparatively investigate the influence of peptides and deoxyribooligonucleotides on probe microenvironment in the various histones. In experiments, one and the same concentration of FITC-histones was used.
Fig. 2. Fluorescence spectra of wheat FITC-labeled histone H1/1 on excitation with 413 nm light. Titration with: a) cardiogen; b) two-stranded hemimethylated oligonucleotide GCG GCG Cm5CAGGG CGG CGG CG + CGC CGC CGC CCT GGC GCC GC.
The peptides used – epithalon (Ala-Glu-Asp-Gly), pinealon (Glu-Asp-Arg), bronchogen (Ala-Glu-Asp-Leu), testagen (Lys-Glu-Asp-Gly), cardiogen (Ala-Glu-Asp-Arg), and pancragen (Lys-Glu-Asp-Trp) – contain in the middle of the molecule two dicarboxylic amino acid residues, glutamic and aspartic acids. According to amino acid composition, the short peptides used can be separated into three groups. The first group (epithalon and bronchogen) consists of peptides containing hydrophobic amino acids at the ends, testagen and pancragen containing a lysine residue form the second group, and third group consists of cardiogen and pinealon that contain an arginine residue at the C-end.
As an example, the emission spectra of FITC-labeled histone H1/1 in the presence or absence of different cardiogen (Ala-Glu-Asp-Arg) concentrations are represented in Fig. 2. Increase in peptide concentration is accompanied with fluorescence quenching of the FITC-labeled histone H1/1. Data on the fluorescence quenching of histone H1 by peptides were analyzed using the Stern–Volmer equation [10]:
F0/F = 1 + Ksv[Q], (1)
where F0, F – fluorescence in the presence or absence of quencher, respectively, [Q] – quencher concentration (M), Ksv is the Stern–Volmer constant. Two-phase linear dependences are specific for most peptide–histone interactions. This may mean that at high peptide concentrations few peptide-binding sites (types) exist in histones or the fluorescence quenching is a combined (static and dynamic) phenomenon. At low peptide concentrations, the linear dependence of the fluorescence quenching on ligand concentration in correspondence with the Stern–Volmer equation was observed. Constants of the fluorescence quenching velocities were calculated using equation: kq = Ksv/τ, where τ = 5 nsec (mean lifetime of the biomolecule without quencher) [11]. The kq values obtained are 4-5 orders of magnitude higher compared with the maximal constants of the quenching velocity on diffusional collisions of the quencher with the biopolymer. Therefore, it can be assumed that at low concentrations [Q] the process of fluorescence quenching is controlled by static quenching due to formation of protein–peptide complexes, not by dynamic collisions of molecules. Equation (2) log[(F0 – F)/F] = logKb + nlog[Q] (where Kb is a constant and n is the number of binding sites) was used for determination of binding constants. From Eqs. (1) and (2), Eq. (3) Ksv = Kb[Q]n–1 is obtained. Ksv = Kb at n = 1. This allowed us to use the Stern–Volmer constant for evaluation of tightness of binding of peptides with various histones. These constants for all the investigated peptides and histones are represented in Table 1. The values obtained varied from ~0.6 to ~3.1 mM, which is specific for ionic interactions [12]. Judging by these data, the peptides differ in tightness of binding with plant histone H1 subfractions as follows. H1/1 binding: epithalon > bronchogen ≈ cardiogen > testagen > pinealon. There is no binding with pancragen. H1/3 binding: bronchogen > pinealon > cardiogen > testagen > epithalon > pancragen. H1/6 binding: epithalon > cardiogen > testagen > bronchogen > pinealon. Peptides such as bronchogen and epithalon bind with all histone H1 subfractions. Histone H1/3 binds most strongly with bronchogen, whereas H1/1 and H1/6 with epithalon. Bronchogen and epithalon contain residues of hydrophobic and neutral amino acids. These residues do not influence the total negative charge of these peptides, which seems to be important for their interaction with histones. It seems that all histone H1 subfractions have a homologous motif responsible for their binding with these peptides.
Table 1. Binding of FITC-labeled histones
with short peptides. Stern–Volmer constants,
103 M–1
Note: Mean error is ±6%.
Positively charged amino acid residues (Lys or Arg) are responsible for decrease in peptide binding constants or for the absence of peptide binding. Testagen (Lys-Glu-Asp-Gly) containing a lysine residue binds similarly with all histone H1 subfractions. But another peptide, pancragen (Lys-Glu-Asp-Trp) that also contains a lysine residue, binds weakly only with histone H1/3. Unlike the tightly-binding testagen, pancragen does not bind with histone H1, which may be due to the tryptophan residue in the latter peptide that may be a sort of steric barrier for binding. It seems that all histone H1 subfractions have rather common site for peptide binding. Nevertheless, a binding site for a second peptide group is different compared with that for the strongly negatively charged peptides of the first group. Thus, site-specific interaction between the investigated peptides and corresponding histones does exist.
Members of the third peptide group containing an arginine residue, cardiogen (Ala-Glu-Asp-Arg) and pinealon (Glu-Asp-Arg), differ significantly in their interaction with histones. Cardiogen has practically similar binding constants with all histones H1. Pinealon binds weakly with H1/1 and H1/6 histones. Probably for cardiogen binding with histones the presence of the alanine residue in the peptide is important; it seems to stabilize the histone–peptide complex. Similarity of the histone fluorescence quenching constants on the interaction with second and third group peptides containing lysine and arginine residues suggests that these peptides have similar or even the same binding sites in the histones.
It is known that plant histones have longer N- and C-ends compared with animal histones [13]. Taking into account the fact that the fluorescence probe is located in the N-terminal part of the protein and assuming that all histone H1 subfractions bind peptides at nearly localized sites, we compared the known N-terminal sequences of histone H1 subfractions with length up to 60 amino acid residues (a.a.) (Fig. 3) as it was done earlier [14]. Based on these comparative data, we suggested that peptides of the first group interact with positively charged site kaakakk that is present in all histone H1 subfractions investigated. As far as this motif is located at different distances from the fluorescence probe, this may be reflected in respective fluorescence quenching and, therefore, fluorescence quenching constants. Peptides containing lysine and arginine residues seem to bind to more negatively charged homologous site evaa that was detected in all histone H1 subfractions (Fig. 3). Histone H1/3 contains two such sites localized similarly but in different surroundings. This seems to be responsible for the fluorescence quenching differences between H1/3, H1/1, and H1/6 histones on the interaction with peptides of the second and third groups.
Fig. 3. Amino acid sequences of wheat histone H1 subfractions (NCBI). Homologous motifs are shown by bold letters.
Comparative analysis of Stern–Volmer constants of peptide binding with core histones showed that this binding is quite specific. For example, core histones and, in particular H2B, bind with epithalon with the highest constants (Table 1). Change of the Gly residue (epithalon) for Leu (as it is in bronchogen) decreases the respective constants by about 2-fold (on binding with histone H2B) or 4-fold (on histone H3 binding), and the constant remains practically unchanged on the interaction with histone H4. Pancragen does not interact with core histones H2B and H4, but it does with histone H3 (with high constant). Histone H2B binds with all the peptides (except for pancragen) with higher constants than H3 and H4 histones. Histone H4 binds weakly with all the peptides (lowest binding constants). The difference in binding constants of fluorescence-labeled histones with peptides should be due to amino acid sequence of the core histones.
On comparative analysis of known amino acid sequences of histone H1 subfractions and core histones H2B, H3, and H4 from wheat (Figs. 3 and 4), we did not detect homologous motifs in the core histones that could be responsible for binding with peptides. As potential candidates for binding sites with peptides, various components formed from sequence kaakakk (kaa, kakk) were considered also. Only sequence kaa was found in the N-terminal of core histone H3. In other proteins (H2B and H4), this sequence was not observed, but sequence kgg was found, this sequence being absent in the N-terminal of histone H3. Because homologous stretches in core histones were not found, we suggest that each of the proteins has its own specific sequence for peptide binding, or some other structural domains in core histones take part in peptide binding.
Histone H1 is a linker histone that is located mainly on relatively small DNA stretches of various lengths between nucleosomes. Nevertheless, exact localization of histone H1 in chromatin is still unknown [15]. It was assumed that histone H1 binds predominantly to AT-rich DNA sequences [15]. The globular part of this histone is located at the entree and exit of DNA and stabilizes nucleosome core particle [16]. The N-terminal of H1 is an anchor that interacts with DNA on the surface of core particle and directs the globule into the “right position”. Therefore, it was important to investigate binding of the fluorescence labeled histone H1 subfractions (with fluorescence probe at the N-terminus) with 20-24-mer oligonucleotides of various primary structures.
Unlike titration with peptides, the addition of oligonucleotides to solution of FITC-labeled histones H1 leads to increase in fluorescence intensity, which is considered as fluorescence “inflammation” [17]. This effect is associated with change in microenvironment of the probe due to immersion of the probe into a more hydrophobic area. Changes in fluorescence were determined on titration of histones H1 with oligonucleotides up to molar ratio 1 : 1, when the Stern–Volmer graphs have linear character. Calculated constants of oligonucleotide binding with FITC-labeled histones are represented in Table 2.
Table 2. Binding of FITC-labeled histones
with deoxyribooligonucleotides. Stern–Volmer constants,
105 M–1
Note: Mean error is about 6%.
Judging from the binding constant of histone H1 subfractions with oligonucleotides, the complexes formed are distributed in the following order: H1/1–oligo(dC) > H1/1–oligo(dGC) > H1/1–oligo(dA) > H1/1–oligo(dT), H1/3–oligo(dA) > H1/3–oligo(dC) ~ oligo(dGC) > H1/3–oligo(dT), H1/6–oligo(dA) > H1/6–oligo(dC) ~ H1/6–oligo(dGC) > H1/6–oligo(dT). Histones H1/3 and H1/6 are similar in binding with monotonous oligonucleotides. They bind preferably with oligo(dA), but histone H1/1 with oligo(dC). Core histones H2B and H3 bind predominantly with oligo(dA).
We have investigated also binding of histones with oligonucleotides containing CNG sites that usually are targets for DNA methylation with eukaryotic DNA-methyltransferases [18]. Various FITC-labeled histone H1 subfractions bind differently with oligonucleotides containing CNG sequence depending on the nature of base N. Histone H1/1 preferentially binds with oligonucleotides containing CAG and CGG and binds weakly with oligonucleotides containing CTG and CCG sites. Histone H1/6 prefers to bind with oligonucleotides containing CTG and CCG sequences. Histone H1/3 interacts with higher binding constants only with oligonucleotides containing CAG and CCG sites. Due to constants of the labeled histone H1 subfraction binding with oligonucleotides having CNG sites, the corresponding H1 histones are arranged in the following order: H1/1 – CAG > CGC > CCG > CTG, H1/3 – CCG > CAG > CGG > CTG, H1/6 – CTG > CCC > CGG > CAG. It was found that different histone H1 subfractions preferably bind oligonucleotides containing definite CNG sequences.
FITC-labeled core histones also interact with oligonucleotides containing CNG-sites and sometimes even with higher constants compared with histones H1 (Table 2). Histones H2B and H3 bind most strongly with oligonucleotides containing CGG. None of histones H1 has such remarkable selectivity to this particular oligonucleotide. Core histone H4 binds similarly with oligonucleotides containing CAG and CTG sites.
It is known that binding of histones H1 with DNA is sensitive to DNA methylation status [15]. On titration of FITC-labeled histone H1/1 with oligonucleotides, it was observed that this histone binds better (1.28⋅106 M–1) with oligonucleotide methylated at CNG site (GCG GCG Cm5CA GGG CGG CGG CGG CG) compared with its unmethylated analog (0.42⋅106 M–1). In a case of complementary oligonucleotide, the dependence of binding on methylation status is the reverse: the binding constant of histone H1/1 with unmethylated oligonucleotide CGC CGC CGC CCT GGC GCC GC is 2-fold more than that with methylated analog (0.38⋅106 M–1). Histone H1/6 also binds preferentially with methylated oligonucleotide GCG Cm5CA GGG CGG CGG CGG CG (1.48⋅106 M–1). Unlike histone H1/1, the histone H1/6 also binds almost 2-fold better with methylated double-stranded complementary oligonucleotide. Histone H1/3 binds predominantly with unmethylated oligonucleotides: GCG CCA GGG CGG CGG CGG CG (binding constant is 1.45⋅106 M–1) and its complementary analog CGC CGC CGC CCT GGC GCC GC (3.37⋅106 M–1). Binding of FITC-labeled histone H1/3 with methylated oligonucleotides proceeds with lower constants (Table 2). Core histones H2B and H4 bind predominantly with unmethylated oligonucleotide CGC CGC CGC CCT GGC GCC GC. Constants of H2B and H4 binding with this oligonucleotide are 2-10-times higher than that with methylated oligonucleotide. Core histone H3 preferentially binds with methylated oligonucleotides (Table 2).
Titration of FITC-labeled histone H1 with double-stranded oligonucleotides is accompanied by an increase in fluorescence intensity and hypochromic shift (up to 5 nm) of the maximum of the emission spectrum (Fig. 2b).
Histone H1 interacts with single-stranded oligonucleotides with higher binding constants than with double-stranded ones (Table 2). Stern–Volmer constants on binding of histone H1 with double-stranded hemimethylated oligonucleotides are higher than that with unmethylated ones; they differ by 3-10-times depending on the histone H1 nature (Table 2). Unlike histone H1, the core histones prefer to bind with double-stranded oligonucleotides (binding constants by about one order higher than that on binding with single-stranded oligonucleotides) (Table 2). Stern–Volmer constants on interaction of core histones with double-stranded hemimethylated oligonucleotides are higher than that with unmethylated ones. Binding constants of core histones with double-stranded hemimethylated oligonucleotides are by almost one order higher compared with binding constants of histone H1 with analogous oligonucleotides.
As the interaction of FITC-labeled histones H1 with oligonucleotides is accompanied by an increase in the fluorescence intensity, we assumed that significant conformational transformations take place in the proteins. It seems that these transformations are due to change in the position of the histone N-terminus and its immersion into a more hydrophobic microenvironment.
It is known that in animal chromatin DNA is condensed by interaction with the C-terminal histone H1 part through motifs s/tpkk and takk [19]. We have not found sequence s/tpkk in plant histones H1 (Fig. 3b). Wheat histone H1 contains only motif tpkk (in H1/3 and H1/6 only). We considered also other possible binding sites of histones H1 with oligonucleotides – taak, tpvk, and tatk. Motif taak was found only in H1/3 and H1/6. This amino acid sequence was detected in the globular area of histone H1. Motifs tpvk and tatk were found in the histone H1 subfractions. Tetrapeptides tatk in the globular part but tpvk in C-terminal sequence were observed. It cannot be ruled out that some other amino acid motifs responsible for binding with oligonucleotides may exist in plant histones H1. Because oligonucleotide-binding motifs in various histone H1 subfractions are different, the site-specific oligonucleotide binding may be due namely to different nature of these motifs in plant histones H1.
To find possible amino acid sequences interacting with oligonucleotides, we analyzed known data on the primary structures of the C-terminal sequences of plant core histones (Fig. 4). Only in core histone H2B two motifs spkk were observed in this part of the protein. Similar sequences as well as respective sequences detected in histone H1 subfractions were not found in other plant core histones (H3 and H4). It seems that each plant histone has its own specific conformational motif responsible for binding with nucleic acids.
Fig. 4. Amino acid sequences of wheat core histones (NCBI).
To investigate the binding of oligonucleotide–histone complexes with peptides, we have used such oligonucleotides that have high binding constants with histones. For example, for formation of complex with FITC-labeled histone H1/6, the oligonucleotide CGC GCG CGC GCT GCG CGC GCG CGC was used that has the highest fluorescence quenching constant (on binding with H1/6) compared with other oligonucleotides containing the CNG sequence. Constants of peptide binding with FITC-labeled histone H1/6–oligonucleotide complexes appeared in the following order: bronchogen > cardiogen ~ testagen > pinealon > epithalon > pancragen (Table 3). Thus, peptides bind to histone–oligonucleotide complex; they bind to histone H1/6–oligonucleotide complex with different effectiveness. As histone binding constants with oligonucleotides are much higher compared with that of peptide–oligonucleotide binding [2], it seems that histone–oligonucleotide complex is not destroyed on titration with peptides, and peptides bind namely to the complex.
Table 3. Binding of FITC-labeled
histone–oligonucleotide complexes with peptides.
Stern–Volmer constants,
103 M–1
Note: Mean error is ±6%.
Deoxyribooligonucleotides:
1* – CGC GCG CGC GCA GCG CGC GCG CGC
2* – CGC GCG CGC GCC GCG CGC GCG CGC
3* – CGC GCG CGC GCT GCG CGC GCG CGC
4* – CGC GCG CGC GCG GCG CGC GCG CGC
Cardiogen and testagen interact with free histone H1/6 and its oligonucleotide complex with similar binding constants (Tables 1 and 3). Thus, in fact, these peptides interact only with histone. Peptides epithalon and bronchogen bind differently with free H1/6 and H1/6–oligonucleotide complex. It is known that epithalon binds with oligonucleotide CGC GCG CGC GCT GCG CGC GCG CGC with high Stern–Volmer constant (4.8⋅104 M–1) [2], and it binds with the free N-terminal of histone H1/6 with relatively small constant of fluorescence quenching (2.67⋅103 M–1). Epithalon binds more preferentially with oligonucleotide than with free histone. But it cannot be ruled out that epithalon can bind to such histone areas that appear as a result of histone–oligonucleotide interaction. Pancragen (Lys-Glu-Asp-Trp) does not bind with histone H1/6, but it interacts with oligonucleotide (0.6⋅104 M–1) [2] and histone–oligonucleotide complex. Pancragen seems to interact with histone–oligonucleotide complex by binding with oligonucleotide containing a CNG sequence. Unlike pancragen, cardiogen (Ala-Glu-Asp-Arg) does not interact with single-stranded oligonucleotides, but it binds with histone H1/6 (2.35⋅103 M–1). Cardiogen binds with complex histone H1/6–oligonucleotide containing CNG more effectively than with free histone H1/6. Thus, cardiogen is the most demonstrative example of peptide binding with histone–oligonucleotide complex by protein–peptide interaction.
Interaction of peptides with oligonucleotide–histone H1/3 and oligonucleotide–histone H1/1 complexes depends on histone nature and oligonucleotide and peptide primary structures. In other words, site-specific interaction of peptides with histone–oligonucleotide complexes does exist.
It has been established that short peptides interact differently with various core histone (H2B, H3 and H4)–oligonucleotide complexes (Table 3). Cardiogen does not interact with oligonucleotide [2], but it binds with core histones and core histone–nucleotide complex. Pancragen did not bind with core histone H4 but bound with core histone H4–oligonucleotide complex; it bound with both free oligonucleotide and free core histone H3 but not with H3–oligonucleotide complex. This may mean that some sites with particular amino acid sequence or conformational structure may be responsible for binding of peptides with histones.
As shown in Table 3, for example, cardiogen prefers to bind with histone H1–oligonucleotide complexes but epithalon binds preferentially with core histones–oligonucleotide complexes. This may indirectly indicate that peptides seem to bind with histone–oligonucleotide complexes by protein–peptide interactions.
We have titrated complexes FITC-labeled histones–DNA of various methylation status with peptides. It was found that on titration of histone–DNA complexes with bronchogen and epithalon, DNA methylation affects the binding of these components (Tables 4 and 5). The DNA methylation status significantly influences cardiogen binding with histone–DNA complexes. For example, methylated DNA in complex with histone H1/6 increases cardiogen binding with this complex but decreases its binding with DNA–core histone H2B complex and, in particular, with DNA–histone H1/3 complex. This might be associated with the change of glycine residue in epithalon or alanine residue in bronchogen for arginine (in cardiogen) that decreases negative charge of cardiogen compared with epithalon and bronchogen. Binding of testagen with methylated DNA–histone complexes proceeds with higher constants than on titration of unmethylated DNA–histone complexes. This means that peptides and, in particular, those containing lysine or arginine can discriminate between DNA with different methylation status.
Table 4. Binding of peptides with
FITC-labeled histone–unmethylated λ phage DNA complexes.
Stern–Volmer constants,
103 M–1
Note: Mean error is ±6%; unmDNA is unmethylated DNA.
Table 5. Binding of peptides with
FITC-labeled histone–methylated λ phage DNA complexes.
Stern–Volmer constants,
103 M–1
Note: Mean error is ±6%. mDNA is methylated λ phage
DNA.
Thus, it is suggested that homologous motifs responsible for binding of short peptides are present in the N-terminal parts of all plant histone H1 subfractions investigated. Peptides differing in charge can bind with different motifs. For bronchogen and epithalon, this motif seems to be kaakakk, but for peptides containing lysine or arginine residues evaa may be such a motif. Binding of peptides with histone H1 subfractions depends on the remoteness of homologous motif from the N-terminus and its microenvironment (Tables 1-5). As far as homologous stretches were not found in wheat core histones, some structural sites with particular charge density in them seem to be responsible for binding with peptides. It was shown that histones H1 preferably bind with single-stranded oligonucleotides by homologous stretches located in the C-terminal part of the protein. Core histones bind predominantly with double-stranded methylated oligonucleotides and methylated DNA. DNA and oligonucleotides in complex with histones can strengthen or prevent peptide binding.
It cannot be ruled out that the observed site-specific binding of short peptides with histones can modulate the action of various enzymes modifying histones in chromatin and, therefore, significantly influence many known enzymatic modifications of histone tails. Thus, in principle, short peptides along with their action at the DNA level [2, 3] may modulate cell epigenetic mechanisms by interaction with histones. In other words, site-specific protein–protein interaction of short peptides with histones may serve as a new mechanism of regulation of gene activity and cell differentiation.
We thank Dr. A. V. Kuzubov (Syntol, Moscow) for deoxyribooligonucleotides synthesized and presented to us.
This work was done with use of equipment of the Center of Common Use in the Institute of Agricultural Biotechnology, Russian Academy of Agricultural Sciences, and it was financed partially by the Russian Foundation for Basic Research (grant 11-04-00026-a).
REFERENCES
1Khavinson, V. Kh., and Malinin, V. V. (2005) Gerontological Aspects
of Genome Peptide Regulation, Karger AG, Basel.
2.Fedoreyeva, L. I., Kireev, I. I., Khavinson, V.
Kh., and Vanyushin, B. F. (2011) Biochemistry (Moscow),
76, 1210-1219.
3.Khavinson, V. Kh., Fedoreyeva, L. I., and
Vanyushin, B. F. (2011) Dokl. RAN, 437, 124-127.
4.Kirnos, M. D., Aleksandrushkina, N. I., Shorning,
B. Yu., Kudryasova, I. B., and Vanyushin, B. F. (1999) Rus. J. Plant
Physiol., 46, 48-57.
5.Smirnova, T. A., Prusov, A. N., Kolomijtseva, G.
Ya., and Vanyushin, B. F. (2004) Biochemistry (Moscow),
69, 1128-1135.
6.Fedoreyeva, L. I., Smirnova, T. A., Kolomijtseva,
G. Ya., and Vanyushin, B. F. (2009) Biochemistry (Moscow),
74, 145-152.
7.Schaffner, W., and Weissmann, C. (1973) Anal.
Biochem., 56, 502-514.
8.Castel, J., Pestana, A., Castro, R., and Marco, R.
(1978) Analyt. Biochem., 90, 551-560.
9.Hieb, A. R., D’Arcy, S., Kramer, M. A.,
White, A. E., and Luger, K. (2011) Nucleic Acids Res.,
24, 1-15.
10.Lakowicz, J. R., and Weber, G. (1973)
Biochemistry, 12, 4161-4170.
11.Xie, M. X., Long, M., Liu, Y., Qin, C., and Wang,
Y. (2006) Biochim. Biophys. Acta, 1760, 1184-1191.
12.Matthew, G. M. (2009) Curr. Pharm. Des.,
15, 3681-3696.
13.Gantt, J. S., and Lenvik, T. R. (1991) Eur. J.
Biochem., 202, 1029-1031.
14.Ponte, I., Vila, R., and Suau, P. (2003) Mol.
Biol. Evol., 20, 371-380.
15.Zlatanova, J., Caiafa, P., and van Holde, K.
(2000) FASEB J., 14, 1697-1704.
16.Allan, J., Mitchell, T., Hasborne, N., Bohm, L.,
and Cran-Robinson, C. (1986) J. Mol. Biol., 187,
591-601.
17.Zhiryakova, M. V., and Izumrudov, V. A. (2007)
Vysokomol. Soed., 49, 2092-2106.
18.Dyachenko, O. V., Shevchyuk, T. V., and Buryanov,
Ya. I. (2010) Mol. Biol. (Moscow), 44, 1-16.
19.Khadake, J. R., and Rao, M. R. S. (1996)
Biochemistry, 36, 1041-1051.