Comparative Proteomic Study of the Basidiomycete Trametes hirsuta Grown on Different Substrates
D. V. Vasina*, D. S. Loginov, and O. V. Koroleva
Bach Institute of Biochemistry, Russian Academy of Sciences, Leninsky pr. 33/2, 119071 Moscow, Russia; fax: (495) 954-2732; E-mail: d.v.vasina@gmail.com* To whom correspondence should be addressed.
Received January 10, 2013; Revision received February 12, 2013
Protein profiles of the basidiomycete Trametes hirsuta grown on standard medium without laccase as an inducer and on medium supplemented with CuSO4 were analyzed using a differential proteomics approach. Protocols developed for isolation and purification of extracellular and intracellular proteins of the mycelium allowed us to show extensive extraction of protein components. Simultaneously, components hampering two-dimensional electrophoresis (pigments, low molecular mass metabolites) were removed from the samples, and high-resolution protein maps were obtained. Analysis of the basidiomycete secretomes revealed qualitative changes in the protein profile: the addition of CuSO4 as an inducer resulted in increase in the produced laccase isoforms and/or isozymes from 7 to 11, whereas its pI range change exceeded 2 units. The number of separated intracellular protein components was 552 and 502 for the control medium and medium with the inducer, respectively. Comparative analysis of the protein maps revealed five regions with the most pronounced differences in the protein profiles. The proteins of interest were identified using MALDI-TOF/TOF mass spectrometry with subsequent peptide fingerprinting. Some intracellular proteins (β-subunits of ATP synthase, molecular chaperones, chaperone activator) upregulated during the growth on the inducer-containing medium were identified. These proteins are supposed to be involved in the regulation of laccase biosynthesis during folding and secretion of the enzyme.
KEY WORDS: laccase biosynthesis, proteomic analyses, intracellular proteins, two-dimensional electrophoresis, Trametes hirsutaDOI: 10.1134/S0006297913050064
Basidiomycetes, the agents of white rot, are really the only group of microorganisms capable of degrading lignin. The main contributors to this process are lignolytic enzymes: laccases, lignin peroxidases, manganese peroxidases, and polyfunctional peroxidases. Laccase (EC 1.10.3.2) is a copper-containing oxidase that catalyzes oxidation of a wide range of aromatic compounds, ortho- and para-diphenols, aminophenols, polyphenols, polyamines, and lignins, as well as of some inorganic ions with accompanying reduction of molecular hydrogen to water [1]. Many works have been published concerning laccases, including the establishing of the detailed mechanism of enzymatic reactions [2-4], studies on biological role [5-8], genome organization, expression, and transcriptional regulation [9-13], and also on conditions of biosynthesis [14, 15]. However, in the last case the majority of works is associated with studies on the influence of the cultivation conditions of microorganisms (the medium composition, inducers, temperature, etc.) on the laccase production, whereas the biosynthesis as it is and also protein factors involved in this process are still poorly studied.
Proteomics is now one of the most effective approaches to studies on enzyme biosynthesis. However, despite virtues of proteomic analysis, the study of laccase biosynthesis in basidiomycetes is difficult because of the absence of annotated genomes of basidiomycetes causing the white rot of wood, which prevents identification of the protein components. However, the biosynthesis of laccase can be regulated with different inducers, and this allows the use of differential proteomics for determination of the main protein components involved in the enzyme biosynthesis due to difference between the profiles of secretory and intracellular proteins produced during cultivation of the microorganisms in the presence and in the absence of an inducer. Metal ions, phenolic compounds, model components of lignin, and some dyes can increase the production of the enzyme [14]. However, the universal character of induction of the biosynthesis of laccases by different basidiomycetes has been really shown only for bivalent copper ions assessed by both the enzymatic activity in the medium and on the transcription level. Note also that the presence in the promoter region of virtually all laccase genes of cis-elements, including the metal-sensitive elements, indirectly shows the identity of laccase biosynthesis mechanisms in basidiomycetes, white rot fungi.
The goal of the present work was to comparatively analyze, reveal, and identify protein factors of the fungus Trametes hirsuta changing in response to introduction into the medium of copper sulfate, which is one of the most effective inducers of basidial laccases [16-18], using the approach of differential proteomics.
MATERIALS AND METHODS
The strain Trametes hirsuta (Wulfen) Pilat, 1939, was kindly presented by Dr. N. V. Psurtseva from the collection of the Komarov Botanical Institute, Russian Academy of Sciences.
The strain was cultivated as described earlier [19]. The inoculum was grown at initial pH 6.0 on nutritional medium with the following composition (g/liter): glucose, 10.0; peptone, 3.0; KH2PO4, 0.6; K2HPO4, 0.4; ZnSO4·7H2O, 0.001; FeSO4·7H2O, 0.0005; MnSO4, 0.05; MgSO4·7H2O, 0.5 (glucose–peptone medium, GlP). On cultivating the fungus in the presence of the inducer, the medium was supplemented with CuSO4 (0.25 g/liter) (GlP + Cu2+ medium).
Measurement of laccase activity. Laccase activity was measured using a spectrophotometer and a chromogenic substrate syringaldazine (Sigma, USA; ε520= 65,000 M–1·cm–1) in 0.1 M sodium acetate buffer (pH 4.5) [20]. International enzymatic units (U) were used (l µmol product/min).
Determination of dry weight of biomass. Dry weight of the biomass was determined by drying samples of the mycelium at 105°C.
Determination of protein concentration. Protein concentration was determined in samples by the Bradford method according to the reagent producer’s instructions (Pierce, USA). All measurements were performed in triplicate.
Isolation of extracellular proteins. The culture broth of the fungus was concentrated and desalted using tangential flow ultrafiltration system with a 3-kDa membrane (Millipore, USA). Proteins were precipitated with a mixture of acetone/13.3% TCA/0.093% β-mercaptoethanol (at 1 : 1 sample/precipitant ratio) for 12 h at —20°C [21]. The precipitate was separated by centrifugation (15 min, 4400 rpm, Eppendorf Centrifuge 5702R, bucket-rotor A-4-38) and washed twice in 0.07% β-mercaptoethanol in acetone. To remove remnants of the solvent, the precipitate was dried for 5 min in airflow at 20°C. The precipitate was dissolved in 0.05 M Tris-HCl buffer (pH 6.8). Then the proteins were re-precipitated using a 2D Protein Kit (Bio-Rad, USA).
Extraction and isolation of intracellular proteins. The fungal mycelium was filtered using a nylon filter, washed in cooled deionized water, and dried with filter paper. To prepare extracts of intracellular proteins, the T. hirsuta mycelium was broken in liquid nitrogen (in a pre-cooled mortar) for 5 min or with a Potter homogenizer for 5 min at 4°C.
The proteins were extracted with 0.05 M Tris-HCl (pH 6.8) supplemented with 2 mM EDTA. The resulting homogenates were centrifuged for 20 min at 4400 rpm (Eppendorf Centrifuge 5702R, bucket-rotor A-4-38). The supernatant proteins were precipitated with a mixture of acetone/TCA/β-mercaptoethanol as described above. The resulting precipitate was dissolved in urea buffer (1% DTT, 4% 3-[(3-cholamidopropyl)dimethylammonio]-1-propanesulfonate (CHAPS), 7 M urea, 2 M thiourea, 5% Ampholytes 3/10) and treated in an ultrasonic bath (Bandelin Sonorex, 35 kHz, 120 W) for 10 min at 20°C. After the treatment, the reaction mixture was incubated for 1 h at 20°C and centrifuged for 5 min at 13,400 rpm (MiniSpin plus; Eppendorf, Germany). The supernatant was collected and used for further studies.
Two-dimensional electrophoresis (2DE). Two-dimensional electrophoresis was performed as described in [22] using a Protean II xi 2-D Cell system (Bio-Rad).
During the isoelectrofocusing (IEF), the pH gradient was from 3 to 10 (Servalytes; Serva Electrophoresis, Germany). The sample amount was 150-200 µg protein per tube. The IEF was performed for 16 h under the following regimens: 100 V for 45 min, 200 V for 45 min, 300 V for 45 min, 400 V for 45 min, 500 V for 45 min, 600 V for 45 min, 700 V for 10 h, 900 V for 1.5 h.
The subsequent electrophoresis of samples resulting upon the IEF was performed in a gradient (7.5-25%) polyacrylamide gel in the presence of SDS at 300 V. After IEF, the samples were incubated for 15 min in solution containing 6 M urea, 2% SDS, 10 mM DTT, 0.5 M Tris-HCl (pH 6.8) to prevent oxidation of sulfhydryl groups of the proteins. To visualize the distribution of protein components, the gels were stained with AgNO3 and with Brilliant Blue R Staining Solution (Sigma) for mass spectrometry.
For protein mapping, the Infinity1000/26MX gel-documenting system (Vilber Lourmat, France) was used. The protein maps were analyzed using the ImageMaster 2D Platinum v.7 program (GE Healthcare, Sweden).
MALDI-TOF/TOF MS analysis. To perform mass spectrometry, gel pieces 3-4 mm3 in size were cut out and washed twice to remove the dye in 100 µl of 40% solution of acetonitrile in 0.1 M NH4HCO3 for 20 min at 37°C. Upon removal of the solution, 100 µl of acetonitrile was added for dehydrating the gel. After removal of acetonitrile and drying the gel, a solution of modified trypsin (Promega, USA) in 0.05 M NH4HCO3 (15 µg/ml) was added. The sample was hydrolyzed for 8 h at 37°C, then 0.5% TFA in 10% solution of aqueous acetonitrile was added. The protein hydrolysate-containing solution above the gel was used for mass spectrometry. As matrix, 2,5-dihydroxybenzoic acid (Aldrich, USA) solution (10 mg/ml) in 20% aqueous acetonitrile with 0.5% TFA was used.
Mass spectra were obtained using a Bruker Ultraflex II MALDI TOF/TOF mass spectrometer (Germany) equipped with a UV laser (Nd) in positive ion regimen with a reflectron; the accuracy of measured monoisotopic masses upon recalibration by trypsin autolysis peaks was 0.005% (50 ppm). The spectra were obtained in the mass range of 700-4500 m/z at laser power chosen for optimal resolution. The fragmentation spectra were obtained using a tandem regimen of the device, and the accuracy on measurement of fragmented ions was no less than 1 Da.
Mass spectra were processed using the FlexAnalysis 3.3 program (Bruker Daltonics, Germany). Proteins were identified with the Mascot program (www.matrixscience.com), and using the peptide mass fingerprinting the search was carried out in the NCBI database (www.ncbi.nlm.nih.gov) among proteins of all organisms at the above-mentioned accuracy and taking into account possible oxidation of methionine residues by air oxygen and possible modification of cysteine residues in the polyacrylamide gel. Candidate proteins with score >83 in the NCBI database were considered reliably determined (p < 0.05), whereas proteins with score >50 were considered probable. The search for homologous proteins was performed with the Biotools 3.2 program (Bruker Daltonics) by combined MS+MS/MS results.
RESULTS AND DISCUSSION
Laccase activity and fungal biomass of T. hirsuta. The fungal growth phase directly influences the profile of both secreted and intracellular proteins. Moreover, the duration of a particular growth phase can vary depending on the nutritional medium composition. Laccase, which is known as a product of secondary metabolism, is secreted depending on the medium composition in the end of the logarithmic or during the stationary growth phase. However, the enzyme production is maximal during different periods depending on physiological and biochemical features of the studied strain, the medium composition, and on presence of inducers of biosynthesis [23].
Curves of biomass accumulation during T. hirsuta cultivation on media with the same composition in the presence of inducer (GlP + Cu2+ medium) and without the inducer (GlP medium) were virtually identical during the logarithmic phase (Fig. 1). However, by the beginning of the stationary phase (on the eighth day of cultivation) the biomass on the GlP + Cu2+ medium was 1.6-fold higher than on the GlP medium. Later the curves of biomass accumulation during cultivation on the media became significantly different. Thus, on cultivation on the GlP medium the biomass accumulation was characteristic for the stationary growth phase, whereas on cultivation on the GlP + Cu2+ medium the biomass sharply fell with subsequent reaching of a plateau. Note that the biomass accumulation after 15 days was significantly lower on cultivation on the GlP + Cu2+ medium than on the GlP medium.
Fig. 1. Time courses of fungal biomass (a) and extracellular laccase activity (b) of T. hirsuta during cultivation on: 1) control GlP medium; 2) GlP + Cu2+ medium.
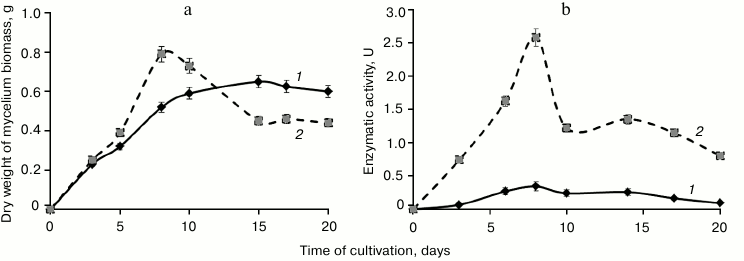
Changes in laccase activity during T. hirsuta cultivation on the GlP + Cu2+ and GlP media were similar. In both cases, the laccase activity gradually increased during the logarithmic growth phase and became maximal by the eighth day of cultivation: 2.58 U on GlP + Cu2+ medium and 0.34 U on GlP medium (Fig. 1). A sharp drop in enzymatic activity (about twofold) on the GlP + Cu2+ medium by the tenth day of cultivation correlated with a sharp drop in the producer biomass.
Thus, the maximal production of laccases by T. hirsuta grown on the GlP and GlP + Cu2+ media was recorded on the eighth day of cultivation. Therefore, the culture broth and biomass of the producer were collected on the eighth day of cultivation to comparatively analyze the extra- and intracellular protein profiles.
Analysis of the T. hirsuta secretome on different media. The compared two-dimensional electrophoresis of extracellular proteins revealed significant differences in the distribution of protein components upon introduction of the inducer into the nutritional medium (Fig. 2). The laccase production changed both qualitatively and quantitatively. In the case of growth on the GlP medium, seven protein components corresponding to laccase were identified by mass spectrometry. These components formed a rather compact group with only slight differences in molecular mass and pI values (MW = 60-70 kDa, pI ~ 4). And on the GlP + Cu2+ medium, the number of protein components identified as laccases was 11, and their pI values varied in a significantly greater range (ΔpI > 2). However, the major part of proteins also had a narrow range of pI values (3.5-4.0). An increase in the number of secreted isoforms and/or isoenzymes in the presence of inducer was earlier shown for some basidiomycetes: Trametes gallica [24], Trametes versicolor [25], Pleurotus ostreatus [14, 26].
Fig. 2. 2DE-gels of extracellular proteins of T. hirsuta grown on control (a) and experimental (b) media. The distinguished regions present proteins corresponding to laccase (Lac) isoforms and/or isoenzymes. The three-dimensional picture of the isolated region shows changes in the composition of the produced forms of the enzyme.
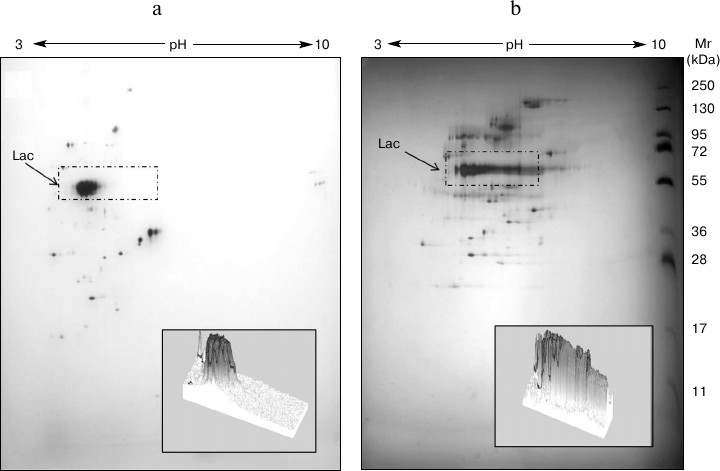
A laccase gene corresponding to the major enzymatic isoform distinguished in glycosylation degree from the minor isoform was earlier identified in the T. hirsuta genome [27]. Based on the findings, it was supposed that in the presence of inducer the synthesis of inducible laccase forms belonging to the family of isoforms with different degree of glycosylation should begin. Studies on differences of intracellular proteins’ profiles seem promising for determining factors associated with laccase biosynthesis and their changes in the expression and ratio of production of different isoforms and isoenzymes.
Analysis of the T. hirsuta proteome after growth on different media. Because of some physiological and metabolic features of mycelial fungi, it is rather difficult to obtain two-dimensional electrophoregrams with good resolution allowing identification of individual proteins by mass spectrometry. The tough cell wall of basidial fungi makes it difficult to extract protein components of the cytosol, whereas high contents of pigments and melanin and other metabolites bound with the intracellular proteins result in an inseparable distribution of protein components. Note that approaches for preparing intracellular extracts of basidiomycetes depend on the studied strain and are rather specific. Therefore, to prepare intracellular proteins of T. hirsuta various approaches to destroy the mycelium and extract the intracellular proteins were used: mycelium grinding in liquid nitrogen [21], homogenization in buffer solution [28], as well as choice of extracting agent.
Efficiency of the destruction of the mycelium was mainly assessed by the extraction degree of the protein components and also by the retention of their native physicochemical parameters (MW, pI). Homogenization was the most effective approach for destruction of the biomass. The number of protein components increased 1.44-fold (from 350 to 502 proteins in electrophoregrams, GlP + Cu2+ medium) and 1.26-fold (from 438 to 552 proteins in electrophoregrams, GlP medium) on homogenization with a Potter homogenizer as compared to destruction in liquid nitrogen.
Moreover, using the Potter homogenizer for destruction of the mycelium allowed us to obtain better two-dimensional electrophoregrams due to absence of horizontal smearing of the protein spots. The resolution of the protein components was also improved due to introduction of an additional stage of re-precipitation of the proteins with TCA/acetone mixture that increased the accuracy of their further identification. Thus, the approach developed for preparing the samples allowed us to obtain electrophoregrams of intracellular extracts of T. hirsuta with high resolution (Fig. 3).
Fig. 3. 2DE-gels of intracellular proteins of T. hirsuta grown on control (a) and experimental (b) media. The distinguished regions present areas with the most distinguished composition.
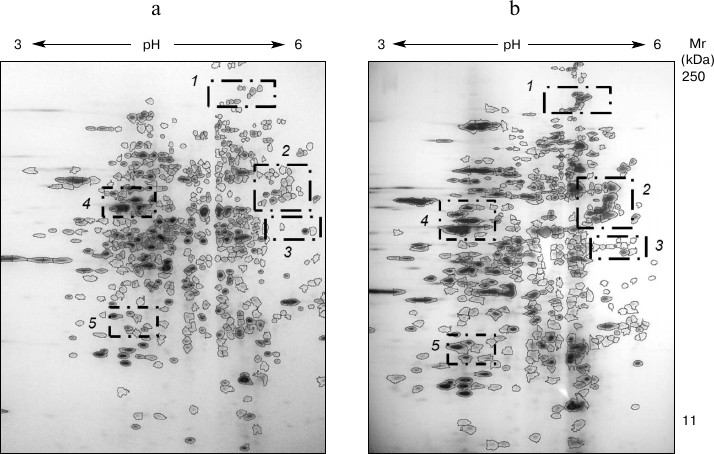
Comparative analysis of the proteome maps revealed that the protein components separated in the electrophoregrams were 60-65% overlapped. On analyzing the electrophoregram, regions were also distinguished with significant changes in protein profiles (Fig. 3): 1) protein group characterized by MW >100 kDa and pI 4.7-5.5; 2) protein group characterized by MW = 40-60 kDa and pI 5.0-6.0; 3) protein group characterized by MW = 30-40 kDa and pI 5.0-6.0; 4) protein group characterized by MW = 40-50 kDa and pI 4.0-4.5; 5) protein group characterized by MW = 17-25 kDa and pI 4.0-4.5.
It should be noted that in groups 1, 3, 4, and 5 changes in the number of the protein components were associated with slight changes in their intensities. However, comparative analysis of the protein profiles of group 2 revealed the retention of all main protein components of the proteomes during the cultivation of the fungus on the different media (20 proteins; Fig. 4). The staining intensity of proteins within the second region significantly increased on induction of laccase biosynthesis (Table 1).
Fig. 4. Proteins of group 2 cultivated in the absence (a) and presence of the inducer (b): 1, 3, 5, 7) unidentified proteins; 2, 4) β-subunits of ATP synthase; 6) chaperone activator Sti1. The three-dimensional picture of the distinguished region shows changes in the composition of the protein profile within this region.
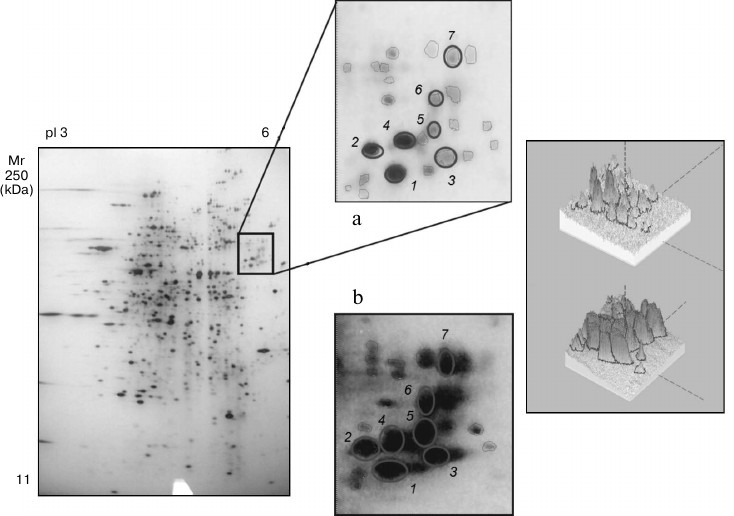
Table 1. Changes in staining intensity of
protein components of group 2
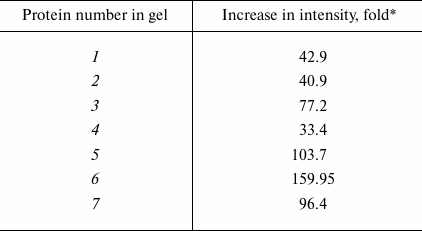
* Calculated with the ImageMaster 2D Platinum software (GE Healthcare,
Sweden).
The staining intensity on addition of CuS04 into the nutritional medium was maximally increased in seven protein components, and this increase varied from 33- to 160-fold (Fig. 4 and Table 1).
These proteins were analyzed by mass spectrometry. The proteins were identified with the protein fingerprinting method using databases embracing proteins of all known microorganisms of the fungal kingdom, including yeast, ascomycetes, and basidiomycetous fungi for which sequenced genomes exist. Using an interspecies search, we reliably identified only three proteins of the fungus T. hirsuta (Table 2): two of these were homologous to earlier identified β-subunits of ATP synthase from Serpula lacrymans. The identification reliability parameters were 140 and 134. In the protein maps, these two components were separated distinctly (samples 2 and 4) with their ΔpI of 0.13, which suggested that T. hirsuta has two isoforms of this protein. The third protein of this group is homologous to the chaperone HSP70 activator Sti1 (a protein induced by stress factors) isolated from the yeast strain Schizosaccharomyces japonicus at the score of 50.
Table 2. Proteins identified by MALDI
TOF/TOF mass spectrometry
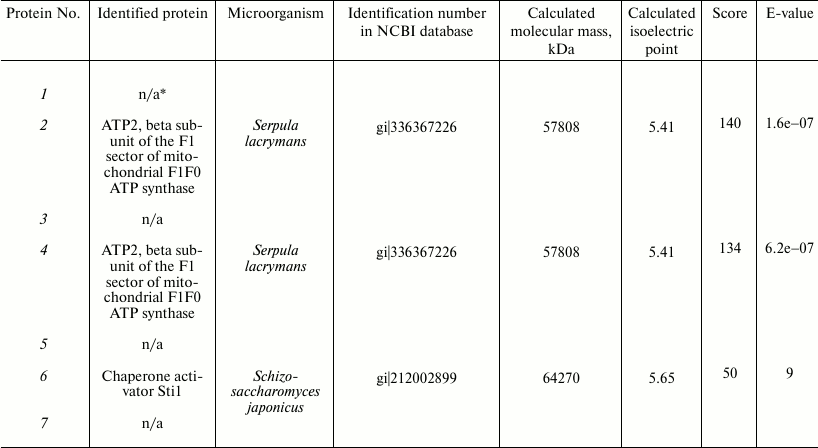
* n/a, unidentified proteins
We could not reliably identify the other proteins, and this seems to be due to insufficient information about nucleotide and amino acid sequences for basidiomycetous fungi and closely related microorganisms [29]. Moreover, the low value of score of individual samples can also be due to the presence of posttranslational modifications, which can influence the results of identification. But it should be noted that the mass spectra obtained for samples 1, 3, 5, and 7 are very similar, which suggests a very high homology degree of these samples.
To increase the level of protein identification, another approach was also used – sequencing de novo of individual peptides by their fragmentation spectra. The sequencing of peptides of protein sample 1 in the range of molecular masses 1000-3500 Da allowed us to prepare individual peptides and also to identify them with BLAST-p (http://blast.ncbi.nlm.nih.gov/Blast.cgi) (Table 3).
Table 3. Mass-spectrometric de novo
sequencing of sample 1 peptides
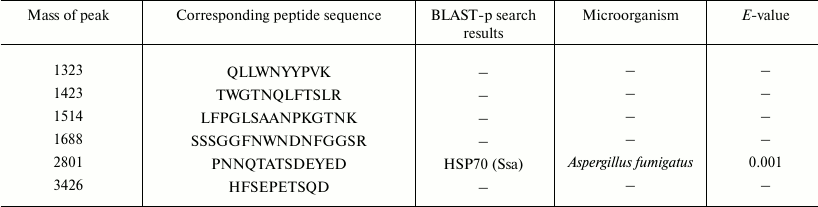
Aligning amino acid sequences of peptides from the protein databases with the Blast-p algorithm showed a high homology degree of a peptide with peak 2801 and sequence PNNQTATSDEYED to the sequence of the molecular chaperone HSP70 – an ATP-dependent stress-response protein produced depending on the environment of the organism. Thus, proteins 1, 3, 5, and 7 are supposed to be HSP70 chaperones.
Thus, using the proteomics approach based on analysis of differences in protein profiles of the fungus T. hirsuta cultivated on different media, we identified four proteins that significantly changed their production. These changes were caused by response of intracellular processes to introduction of the inducer into the nutritional medium. Two isoforms of ATP synthase were reliably determined, as well as probable proteins of the group of molecular chaperones Hsp70 involved in various intracellular processes, including those associated with synthesis and folding of proteins [30, 31], and chaperone activator Sti1 regulating the rate of the catalytic cycle during enzyme folding. The chaperone activator Sti1 in the complex Ssa1–Sti1–Hsp90 was earlier shown to influence ATPase activity of Ssa increasing up to 200-fold the rate of ATP hydrolysis [32] and thus increasing the rate of the chaperone catalytic cycle. It seems that the addition of CuSO4 into the medium induces a response of T. hirsuta to accelerate the elimination of copper ions from the cell. This is associated with the need to increase the number of assistant proteins regulating the folding and secretion of the enzyme.
Differential proteomics is an effective tool for studies on intracellular processes in organisms. It reveals differences on the level of protein profiles and identified individual proteins involved in various processes. However, further studies on the mechanism of laccase biosynthesis require not only proteomics but also genetic approaches to microorganism study.
This work was supported by the Russian Foundation for Basic Research project No. 11-04-01349.
REFERENCES
1.Yaropolov, A. I., Skorobogat’ko, O. V.,
Vartanov, S. S., and Varfolomeev, S. D. (1994) Appl. Biochem.
Biotechnol., 49, 257-280.
2.Quintanar, L., Stoj, C., Taylor, A. B., Hart, P.
J., Kosman, D. J., and Solomon, E. I. (2007) Acc. Chem. Res.,
40, 445-452.
3.Morozova, O. V., Shumakovich, G. P., Gorbacheva, M.
A., Shleev, S. V., and Yaropolov, A. I. (2007) Biochemistry
(Moscow), 72, 1136-1150.
4.Bento, I., Martins, L. O., Gato Lopes, G., Armenia
Carrondo, M., and Lindley, P. F. (2005) Dalton Trans.,
21, 3507-3513.
5.Baldrian, P. (2006) FEMS Microbiol. Rev.,
30, 215-242.
6.Eggert, C., Temp, U., and Eriksson, K. E. (1997)
FEBS Lett., 407, 89-92.
7.Hermann, T. E., Kurtz, M. B., and Champe, S. P.
(1983) J. Bacteriol., 154, 955-964.
8.Temp, U., and Eggert, C. (1999) Appl. Environ.
Microbiol., 65, 389-395.
9.Ong, E., Pollock, W. B., and Smith, M. (1997)
Gene, 196, 113-119.
10.Pezzella, C., Autore, F., Giardina, P.,
Piscitelli, A., Sannia, G., and Faraco, V. (2009) Curr. Genet.,
55, 45-57.
11.Collins, P. J., and Dobson, A. (1997) Appl.
Environ. Microbiol., 63, 3444-3450.
12.Castilho, F. J., Torres, R. A., Barbosa, A. M.,
Dekker, R. F., and Garcia, J. E. (2009) Biochem. Genet.,
47, 80-91.
13.Kilaru, S., Hoegger, P. J., Majcherczyk, A.,
Burns, C., Shishido, K., Bailey, A., Foster, G. D., and Kues, U. (2006)
Appl. Microbiol. Biotechnol., 71, 200-210.
14.Piscitelli, A., Giardina, P., Lettera, V.,
Pezzella, C., Sannia, G., and Faraco, V. (2011) Curr. Genom.,
12, 104-112.
15.Rigling, D., and Van Alfen, N. K. (1991) J.
Bacteriol., 173, 8000-8003.
16.Arora, D. S., and Gill, P. K. (2000)
Bioresour. Technol., 77, 89-91.
17.Klonowska, A., Le Petit, J., and Tron, T. (2001)
FEMS Microbiol. Lett., 200, 25-30.
18.Cavallazzi, J. R. P., Kasuya, C. M., and Soares,
M. A. (2005) Brazil. J. Microbiol., 36, 383-387.
19.Koroljova-Skorobogat’ko, O. V., Stepanova,
E. V., Gavrilova, V. P., Morozova, O. V., Lubimova, N. V., Dzchafarova,
A. N., Jaropolov, A. I., and Makower, A. (1998) Biotechnol. Appl.
Biochem., 28, 47-54.
20.Dantan-Gonzalez, E., Vite-Vallejo, O.,
Mendez-Sanchez, M., Martinez-Anaya, C., Gonzalez, M., Folch-Mallol, J.,
and Palomares, L. A. (2008) Int. Microbiol., 11,
163-169.
21.Kniemeyer, O., Lessing, F., Scheibner, O.,
Hertweck, C., and Brakhage, A. A. (2006) Curr. Genet.,
49, 178-189.
22.O’Farrell, P. H. (1975) J. Biol.
Chem., 250, 4007-4021.
23.Janusz, G., Kucharzyk, K. H., Pawlik, A.,
Staszczaka, M., and Paszczynski, A. J. (2013) Enzyme Microbiol.
Technol., 52, 1-12.
24.Dong, J. L., Zhang, Y. W., Zhang, R. H., Huang,
W. Z., and Zhang, Y. Z. (2005) J. Basic Microbiol., 45,
190-198.
25.Lorenzo, M., Moldes, D., and Sanroman, M. A.
(2006) Chemosphere, 63, 912-917.
26.De Souza, C. G., Tychanowicz, G. K., de Souza, D.
F., and Peralta, R. M. (2004) J. Basic Microbiol., 44,
129-136.
27.Rebrikov, D. V., Stepanova, E. V., Koroleva, O.
V., Budarina, Z. I., Zakharova, M. V., Iurkova, T. V., Solonin, A. S.,
Belova, O. V., Pozhidaeva, Z. A., and Leont’evskiy, A. A. (2006)
Prikl. Biokhim. Mikrobiol., 42, 645-653.
28.Salvado, J. C., and Labarre, J. (1989) Theor.
Appl. Genet., 78, 505-512.
29.Wilkins, M. R., and Williams, K. L. (1997) J.
Theor. Biol., 186, 7-15.
30.Bukau, B., and Horwich, A. L. (1998) Cell,
92, 351-366.
31.Mayer, M. P., and Bukau, B. (2005) Cell Mol.
Life Sci., 62, 670-684.
32.Wegele, H., Haslbeck, M., Reinstein, J., and
Buchner, J. (2003) J. Biol. Chem., 278, 25970-25976.