REVIEW: Mass Spectrometry of Glycans
Liang Han and Catherine E. Costello*
Center for Biomedical Mass Spectrometry, Boston University School of Medicine, 670 Albany St., Room 511, Boston, MA 02118-2646 USA; fax: +1-617-638-6491; E-mail: cecmsms@bu.edu; hanliang1986@gmail.com* To whom correspondence should be addressed.
Received February 11, 2013; Revision received March 13, 2013
Powerful new strategies based on mass spectrometry are revolutionizing the structural analysis and profiling of glycans and glycoconjugates. We survey here the major biosynthetic pathways that underlie the biological diversity in glycobiology, with emphasis on glycoproteins, and the approaches that can be used to address the resulting heterogeneity. Included among these are derivatizations, on- and off-line chromatography, electrospray and matrix-assisted laser desorption/ionization, and a variety of dissociation methods, the recently introduced electron-based techniques being of particular interest.
KEY WORDS: mass spectrometry, MS/MS, glycobiology, structural determinations, biosynthesis, chromatography, derivativesDOI: 10.1134/S0006297913070031
Abbreviations: CID, collision-induced dissociation; ECD, electron capture dissociation; EDD, electron detachment dissociation; EED, electronic excitation dissociation; ER, endoplasmic reticulum; ESI, electrospray ionization; ETD, electron transfer dissociation; FT-ICR, Fourier transform ion cyclotron resonance; GC/MS, gas chromatography coupled to mass spectrometry; HPLC, high-performance liquid chromatography; IM-MS, ion mobility-mass spectrometry; LC/MS, liquid chromatography/mass spectrometry; MALDI, matrix-assisted laser desorption/ionization; MALDI-TOF, matrix-assisted laser desorption/ionization-time of flight; MS, mass spectrometry.
Carbohydrates are the most abundant and structurally diverse compounds
found in nature. They participate in various biological processes. They
are involved in diverse roles such as molecular recognition,
cell–cell and cell–matrix interactions, energy generation,
and modification of protein conformations. Carbohydrates also serve as
markers for many disease states. They can be used in the food, textile,
paper, and pharmaceutical industries. Increasing evidence shows that
numerous biological functions are closely related to specific
carbohydrate structures [1-4].
They can form branched structures because linkages of the constituent
monosaccharides can occur at a number of positions.
Monosaccharides, which cannot be hydrolyzed into a simpler form, are the most basic units of carbohydrates. Monosaccharides constitute oligosaccharides (2-10 units) by the attachment to one another via glycosidic linkages, forming branched or linear chains. Polysaccharides (>10 units) are typically reserved as large glycans that are composed of repeating oligosaccharide motifs. The ring form of a monosaccharide generates a chiral (anomeric) center. A glycosidic linkage involves the attachment of a monosaccharide to another residue, typically via the hydroxyl group of this anomeric center. The formation of α linkages or β linkages depends on the direction of the C-1 hydroxyl group with respect to the plane of the ring. The most common monosaccharides are the hexoses. Modifications include the absence of one or more oxygen atoms (deoxysugars), oxidation of a primary hydroxyl group to a carboxylic acid (uronic acid), or replacement of a hydroxyl group with a primary amine or acylamino-group. Each of these monosaccharides exists in a number of isomeric forms because of the constituent asymmetrically substituted carbon atoms.
Glycosylation is the process by which one or more monosaccharide or oligosaccharide units are linked to proteins or lipids. It is the most common post-translational modification (PTM) [5]. The central paradigm of modern molecular biology is that the information flows from DNA to RNA to protein to cell. Proteins are vital parts of living organisms, and nearly half of them are glycosylated [6]. When linked to a specific site on a protein backbone, glycans can modify the structural properties of the protein, affecting its solubility and conformation. Glycans are also important in localization and cellular adhesion events such as those occurring during development and tumorigenesis [7-10]. The modification modulates the activity of the molecules decorated. For example, changes in glycosylation on the cellular surface cause the immune system to target infected cells for destruction.
Glycoproteins often exist as heterogeneous mixtures of closely related structures, called glycoforms, which vary in their glycan structures and glycan attachment sites. Glycans attached to specific sites on a protein backbone generate structurally and chemically diverse glycoproteins. The two most common forms of glycosylation are N- and O-linked glycosylation (Fig. 1). In N-glycosylation, oligosaccharides bind to the amine nitrogen of asparagine side chains within the Asn-Xxx-Ser(Thr) consensus sequence in which Xxx is any amino acid except proline. In O-glycosylation, oligosaccharides are linked to the hydroxyl oxygen of serine (Ser) or Threonine (Thr) side chains. The N-glycans of higher organisms all contain a common pentasaccharide core structure (Man3GlcNAc2), which is also called trimannosyl chitobiose core [11]; in contrast, multiple O-glycan core structures exist, and there is considerable structural diversity in this glycan class [12].
Fig. 1. N-linked (a) and O-linked (b) glycosylation.
In eukaryotes, the glycoprotein and N-linked glycans are synthesized in the endoplasmic reticulum (ER) and Golgi apparatus, involving enzymes that first accomplish synthesis of the lipid-linked oligosaccharide precursor [13]. The process begins with the step-wise addition of monosaccharide residues by oligotransferases, leading to a 14-oligosaccharide core on the lipid carrier dolicholpyrophosphate (Dol-P). Once the seven-sugar precursor (Man5GlcNAc2-PP-dolichol) is formed on the cytoplasmic side of the ER, the whole complex is flipped across the membrane layer into the ER lumen, where four more mannose residues and three glucose residues are added. In a co-translational process, the assembled glycan is transferred to Asn residues on the nascent protein, within Asn-X-Ser/Thr sequons via the action of oligosaccharyltransferase (OST). Figure 2 depicts the whole process [14]. High-mannose N-glycans contain only mannose attached to the chitobiose core. During passage through the ER and Golgi, the mannoses on antennae are removed and other types of residues are added, thus reaching the complex N-glycans. Hybrid N-glycans are incompletely processed and retain at least one antenna containing mannose residues [15]. N-Glycans play important roles in the quality control of glycoprotein folding in the ER lumen [15-17]. Glycoproteins will not pass ER quality control if they fail to reach the correct conformation [18].
Fig. 2. N-linked glycan biosynthesis. Reproduced, with permission, from [15].
By comparison, O-glycans have neither consensus sequence nor a consistent core structure; they are extremely diverse [19]. The process is typically initiated by adding a single N-acetylgalactosamine (GalNAc) residue via glycosyltransferase [20]. Mammals have eight common O-glycan core structures [3]. O-Glycosylation also has significant effects on the solubility, conformation, stability, and hydrophilicity of proteins [21].
The study of glycans, termed glycomics, is applied to biology and chemistry that focuses on the structure and function of carbohydrates, and on glycoform distributions at the cellular, tissue, organ and organism levels. A glycomics approach may combine three main aspects: the structural characterization of glycans, detailed understanding of glycan–protein interactions, and the study of in vitro and in vivo systems for the determination of function of specific glycans. This review focuses on the structural identification of glycans and determination of glycoform patterns, and summarizes recent techniques in mass spectrometric glycomics. Despite the important functions of oligosaccharides in biological systems, structural determination of these molecules is an analytical challenge compared to other biomolecules. Unlike linear peptides or nucleic acids, a very limited number of monosaccharides can form many stereoisomeric structures of carbohydrates. For structural elucidation, not only the monosaccharides (and their stereochemistry) need be identified, but also how they link together to form the polymers needs to be determined, which may include their sequence and branching pattern. Glycoform patterns and their changes may be measured at the semiquantitative or quantitative level; usually the values are expressed as relative rather than absolute changes. Mass spectrometry (MS) is one of the important tools for the structural characterization of carbohydrates, as it offers high sensitivity and addresses the most frequent biological problems. With the help of chromatographic separation, derivatization, and mass spectral fragmentation, oligosaccharide structures can be elucidated.
ANALYSIS AND PROFILING OF GLYCANS AND GLYCOCONJUGATES
Glycan release. The general approach for analyzing carbohydrates involves, first, the release of the glycan moiety from the glycoprotein. Two general methods are available for releasing carbohydrates: enzymatic methods and chemical methods. Enzymatic methods offer the advantage of preserving the information of the glycoprotein. The glycoprotein will not be degraded so that it remains available for analysis. Specific enzymes are used to release N-linked glycans from glycoproteins. Two types of enzymes are available, endoglycosidases and exoglycosidases; the former releases all or most of the glycan whereas the latter removes only a very specific portion of the non-reducing end of the glycan. Common endoglycosidases are the PNGase (protein N-glycosidase) family which are amidases that release most N-glycans, e.g. PNGase F cleaves the bond between the innermost GlcNAc and asparagine residues of glycoproteins, releasing the carbohydrate and preserving the intact glycosylamine at the reducing end [22, 23], although the amino group is quickly hydrolyzed and replaced by a hydroxyl group. Endoglycosidase H (endo H) cleaves between the GlcNAc residues of the chitobiose core for high mannose and hybrid glycans [24].
Exoglycosidases cleave one monosaccharide unit at a time from the nonreducing end of the carbohydrate chain and are frequently employed stepwise in conjunction with Matrix-Assisted Laser Desorption/Ionization Mass Spectrometry (MALDI-MS) profiling of glycoforms, to facilitate assignment of the terminal monosaccharides and linkages [25]. Therefore, many features in the structure of the carbohydrate sample might be deduced from the enzymatic reaction(s). However, not all features of the sequences and linkages can be defined solely by using this approach. Hence, linkage analysis experiments that employ Gas Chromatography coupled to Mass Spectrometry (GC/MS) are still necessary and are regularly employed for rigorous structure analysis. Chemical release, which includes alkaline elimination and hydrazinolysis [26-28], preserves the carbohydrate moiety but degrades the glycoprotein. It is frequently used to release O-linked glycans from glycoproteins, since there is a dearth of glycosidases for release of O-linked glycans.
In order to retain the information about site occupancy, N-linked glycan release may be carried out in the presence of 18O-water, or an enzyme such as PNGase F1-F3 or endo H, that leave the first GlcNAc attached to the protein, may be employed. The determination of glycoform distributions at specific positions on the protein(s) requires that the sample be subjected to proteolysis and analyzed at the glycopeptide level, usually with on- or off-line chromatography in conjunction with mass spectrometry, or that the glycans be characterized after release from isolated glycopeptides.
Derivatization of glycans. Released sugars contain a single reactive carbonyl group at the reducing end that can be derivatized separately from the other hydroxyl groups. This property has been used to improve ionization, to add a stable isotope tag or to attach a chromophore for detection by High-Performance Liquid Chromatography (HPLC) [29, 30]. Reductive amination works for N-linked glycans released enzymatically from proteins and for any glycan that contains a reducing end. It is not applicable to O-glycans released under reductive conditions, while the aldehyde group is reduced to an alditol, but this group may also be derivatized efficiently or labeled with stable isotopes for structural or quantitative studies.
Permethylation is another important derivatization tool for investigation of glycan structures [31, 32]. Carbohydrates are not ionized as efficiently as compounds such as proteins that can be protonated on many basic sites, neither do they appear to be transferred to the vapor phase as efficiently. Permethylation decreases the intermolecular hydrogen bonding, thereby increasing the sample volatility and thus the intensity of the ion signals [33]. It also enhances the formation of diagnostic fragment ions and thereby increases the yield of useful structural information [34]. It prevents gas-phase rearrangements of glycan residues that can introduce ambiguity into structural analyses [35]. Furthermore, it can eliminate the negative charge associated with acidic residues, and thus stabilize acidic residues in the positive mode; this feature is especially important for the analysis of sialylated glycans in which the carboxyl group is located on the same carbon as the glycosidic linkage [36]. The reaction pathways for reductive amination and permethylation are shown in Fig. 3, also with several commonly used reagents for reductive amination [25, 37].
Fig. 3. The reactions of reductive amination and permethylation as well as several commonly used reagents for reductive amination.
Separation of glycans. After release of the carbohydrates, the next stage is separation of the carbohydrates. This is not always necessary but it offers the advantage of reducing sample complexity, especially when dealing with biological samples. In most cases, the large variety of isomeric or closely related structures of carbohydrate moiety requires high performance separation techniques prior to mass spectrometry.
Both native glycans and permethylated glycans can be separated by HPLC with a C18 column. As noted above, reductive amination adds chromophores to native glycans, allowing the detection by ultraviolet (UV) when using offline HPLC. Normal phase LC provides such regular separation of glycans (usually analyzed as derivatives with a chromophore at the reducing end) that the retention index scale is quite linear and can be used as a basis for assignments [38]. The combination of HPLC and MS (online HPLC) provides qualitative and quantitative analysis of native glycans, dramatically decreasing the effort and time requirements [38]. Both offline and online liquid chromatography/mass spectrometry (LC/MS) approaches are used for glycan or glycoconjugate profiling. Glycans/glycoconjugates with low abundance, including N-linked glycans, O-linked glycans, glycopeptides, and glycolipids can be detected by LC/MS, and this allows the analysis of complex mixtures [39-41]. When permethylation is applied to increase the hydrophobicity, glycans can be separated by reversed phase LC [42].
Porous graphitized carbon chromatography (PGC) uses a solid phase that is composed of large macromolecules that are made up primarily of carbon atoms. There are two main mechanisms that may contribute to retention: hydrophobic interactions and electronic forces [43]. PGC shows an extraordinary isomeric selectivity to separate glycan isomers [44, 45]. It can also be used for desalting of glycans prior to mass spectrometry.
Hydrophobic interaction liquid chromatography (HILIC) is a type of partition chromatography in which the retention mechanism is due the variations in the size and polarity of glycans. It is an effective tool for online LC/MS to analyze derivatized and reducing glycans [46] and peptides/glycopeptides [47]. However, it cannot separate isomers.
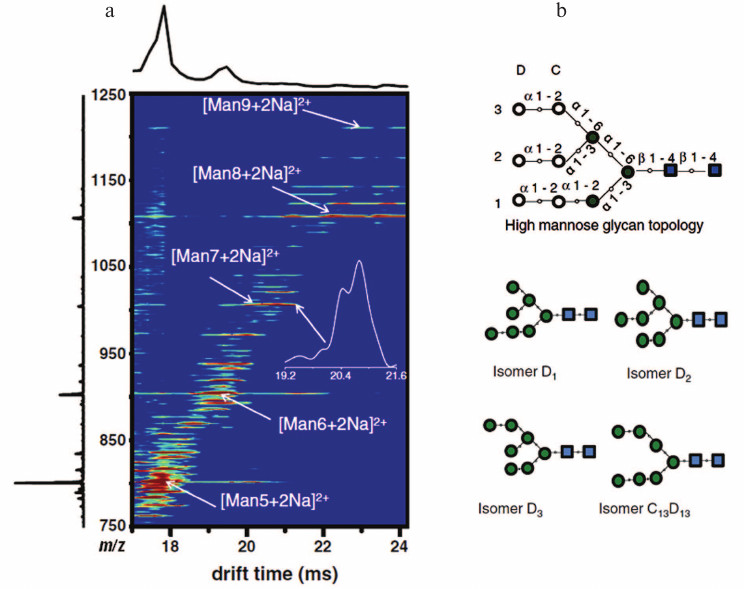
Ion mobility-mass spectrometry (IM-MS) is an emerging method to distinguish isomers of glycans. IM-MS separates and identifies ionized molecules in the gas phase based on their mobility in the presence of a carrier buffer gas. In IM-MS, a weak uniform electric field is applied across a drift tube to pull ions through the buffer gas. Compact isomers with higher mobility exit the drift tube earlier than those with lower mobility [48]. Recently, advances in the development of traveling wave ion mobility spectrometry (TWIMS) have significantly increased sensitivity and speed [49]. TWIMS offers the possibility of separating complex glycan isomers in the gas phase and can easily be combined with mass spectrometry for further characterization [50]. Figure 4 (see color insert) displays the IM-MS distribution observed for electrosprayed high mannose glycans derived from RNase B [51]. Isomers of Man7GlcNAc2 can be separated by the technique. IM-MS reduces the carbohydrate complexity in a given mass window. Use of tandem mass spectrometry in conjunction with IM-MS can obtain much “clearer” fragmentation ions based on separated precursor ions compared to those previously detected in the mixture caused by overlap between isotopic distributions of their precursors [52, 53]. This will simplify the level of glycoform de novo identifications by mass spectrometry and make results much more definitive. The development of this and other mobility-based approaches is an especially active area of current MS research and development.
Fig. 4. IM-MS graph (a) for high mannose glycans derived from RNase B. Numbering system for high-mannose glycans Man7GlcNAc2 isomers (b). Blue squares represent N-acetylglucosamine residues. Green solid circles represent mannose residues. Additional mannose residues (open circles) can be linked to the core structure. Reproduced, with permission, from [51].
MASS SPECTROMETRY OF GLYCANS
Mass spectrometry, in its most simple definition, is the production and detection of ions separated according to their mass-to-charge (m/z) ratios. The detection of such ions results in a mass spectrum, which is a plot of the relative abundance of the ions as a function of their m/z ratio. At present, the two most widely used MS ionization techniques for the analysis of carbohydrates are Matrix-Assisted Laser Desorption/Ionization (MALDI) and Electrospray Ionization (ESI); in both free glycans are typically detected as metal (usually sodium) adducts in the positive ion mode, and as deprotonated or anion-adducted species in the negative-ion mode. Glycopeptides may be detected in their protonated or deprotonated forms. Both MALDI and ESI are soft ionization techniques, i.e. the ionization process imparts little excess energy and thus generates few or no fragments for glycans so that the intact molecular ions can be easily observed. Nevertheless, prompt loss of labile groups, especially sialic acid and fucose, may occur and the extent of its occurrence should be assessed, particularly in quantitative studies. Both MALDI-MS and ESI-MS can be applied to obtain an overall glycan profile. MALDI yields a series of singly charged molecular ions and the ionization efficiency for neutral carbohydrates is constant as the size of molecule increases, in contrast to that for ESI, where the ionization efficiency decreases with an increasing molecular weight [54]. Additionally, ESI usually generates multiply charged ions; although these complicate spectral analysis, especially when mixtures are introduced with on- or off-line separation, the instrument software can perform a deconvolution of the multiple charge states to produce a spectrum that shows a single molecular weight distribution. However, the signal is distributed over multiple charge states and this affects the ability to detect low-abundance species.
Figure 5 presents profile negative ion (a) Matrix-Assisted Laser Desorption/Ionization-Time of Flight (MALDI-TOF) and (b) Fourier Transform Ion Cyclotron Resonance (FT-ICR) spectra of a Lipid A mixture obtained from a marine source by Elkin and coworkers [55]. The Lipid A sample, extracted from the first batch cultivation of the bacterial cells, has three types of monophosphorylated lipid molecules designated as M1, M2, and M3, respectively (see Fig. 5a). Lipids M2 and M3 may result from fragmentation of the ion M1 or may represent variant products that arise from differences in the biosynthetic pathways.
Fig. 5. Negative ion mass spectra of a fraction from a lipid A sample from a marine source, recorded with (a) MALDI-TOF and (b) MALDI FT-ICR instruments. Reproduced, with permission, from [55].
Although MALDI-MS and ESI-MS spectra are highly suited to mass fingerprinting of glycan mixtures and are thus very valuable for initial stages of glycomic analysis, the lack of fragment ions can be a problem for detailed structural elucidation of glycans. This can be solved by making the molecular ions more energetic, thereby inducing fragmentation, which is achieved by employing one or more well-controlled dissociation steps and tandem mass spectrometry.
Tandem mass spectrometry (MSn) including low- and high-energy collision-induced dissociation (CID) [56-58], infrared multiphoton dissociation (IRMPD) [59], and the newer electron-based dissociation methods [60-64] has proven to be a powerful means for carbohydrate structural identification. Generally, glycans undergo two main types of cleavage upon CID: glycosidic cleavages resulting from the rupture between the two neighboring residues and cross-ring cleavages that involve the fragmentation of a sugar ring. The former provide information on composition and sequence, while the latter provide some details on the different linkage types. Internal fragments are generated upon the occurrence of two (or more) cleavages, either glycosidic or cross-ring, from more than one site in the molecule [1]. They may also provide useful structural information. Figure 6 shows the widely used nomenclature originally proposed by Domon and Costello to designate different types of glycan fragment ions they observed in the high-energy CID spectra obtained using Fast Atom Bombardment (FAB) or Liquid Secondary Ionization Mass Spectrometry (LSIMS) on a four-sector tandem instrument [65]. Advent of FAB and LSIMS had made it possible to obtain long-lived, stable ion beams for glycans and glycoconjugates, and these features led to wide use of these ionization methods in glycobiology, although they have now largely been replaced by MALDI and ESI.
Fig. 6. Nomenclature for glycan and glycoconjugate fragments observed in tandem mass spectra. Reproduced, with permission, from [65].
Extensive studies have revealed that protonated oligosaccharides mainly produce glycosidic cleavages, yielding sequence but not linkage information [66-68]. Many reports have shown that fragmentation of different metal-adducted oligosaccharides (Li+, Na+, Mg2+, Ca2+, etc.) resulted in more cross-ring cleavages in low energy CID [67-69]. The Leary group and the Lebrilla group have discussed the relationship between the metal size, sugar size, and fragment ion yield. Figure 7 explains that the activation barrier increases as the radius of the cation increases. The metal ion binding to a ring oxygen localizes the oxygen’s electrons and prohibits glycosidic bond cleavages and it therefore induces abundant cross-ring cleavages under CID or IRMPD conditions [68, 70-72].
Fig. 7. Metal effects on glycans in tandem mass spectrometry: a) proton mediated glycosidic bond dissociation; b) higher activation energy barrier as the cation radius increases. Reproduced, with permission, from [71].
Most published studies have been mainly concerned with the fragmentation of positive ions on both native and permethylated N-linked glycans [69, 73, 74]. The fragment ions from native glycans tend to undergo rearrangement reactions, which lead to ambiguous information [35, 75]. Permethylation is used to stabilize the labile acidic groups, which can be easily lost, particularly during MALDI ionization and in the analyzer under low or high energy CID [11, 76]. Low energy CID generates mainly glycosidic cleavages. Fragments resulting from cross-ring cleavages, which can provide information needed for making detailed structural assignments, have quite low relative abundances or are absent. High energy CID can provide extensive informative fragments for analysis of oligosaccharides with smaller sizes [36, 77]. High-energy dissociation in a sector mass spectrometer can produce many informative cleavages [65], but these instruments are now seldom available for glycan analysis.
For larger N-linked glycans with more complex structures, the most abundant cross-ring fragments detected with high-energy CID in a MALDI-TOF/TOF mass spectrometer are often the 1,5Xn cleavages, but these are not unique enough to facilitate detailed structural assignments [78]. Negative ion CID is very useful for analysis of glycans with acidic monosaccharide residues. The Zaia group acquired a set of targeted negative CID spectra in automated mode on heparan sulfate (HS) oligosaccharides deriving from two different tissue sources. By using statistical methods, they were able to profile a number of HS oligosaccharides and foresaw the potential for glycosaminoglycan (GAG) class profiling [79]. In addition, the spectra from dissociation of N-linked glycan negative ions provide extensive information with, in many cases, specific fragmentation on the chitobiose core that can reveal finer details of glycan structures. But the same deficiency rises, in that only limited structural information can be gained, due to the occurrence of minimal fragmentation on the antennae [80-85].
Recently, several novel fragmentation techniques have been applied to the analysis of carbohydrates. Adamson et al. and Zhao et al. have investigated the application of electron capture dissociation (ECD) to both linear and branched oligosaccharides by utilizing FT-ICR mass spectrometers [63, 64]. They showed that cross-ring cleavages were the dominant fragmentation pathway in ECD spectra. Whereas ECD is applied in the positive ion mode for characterization of neutral glycans, electron detachment dissociation (EDD) generates fragmentation in the negative mode for analysis of acidic glycans, and it has been shown to be particularly useful for analysis of GAGs. Wolff et al. applied EDD to the analysis of GAGs and elucidated some mechanisms and pathways [61, 86]. Adamson and Hakansson also showed that EDD produces relatively abundant cross-ring cleavage ions for N-glycans and milk oligosaccharides [87]. Yu et al. investigated the application of electron energy-dependent electron activated dissociation (ExD) based on alkaline metal-adducted permethylated maltoheptaose in positive mode. Their data showed that such a glycan exhibits several fragmentation processes, including ECD (1.5 eV), hot-ECD (9 eV), and electronic excitation dissociation (EED) (14 eV). EED provided cross-ring cleavages more informative than those obtained by ECD or hot-ECD [62]. Figure 8 (see color insert) shows the EED spectrum of permethylated Man5GlcNAc2. The appearance of extensive fragment ions allows the detailed structural identification of the N-linked glycan.
Fig. 8. EED cleavage map of the Man5GlcNAc2 [M + 2Li]2+ m/z 785.4121 at 14 eV. Reproduced, with permission, from [62].
These fragmentation techniques, including ECD, EDD, and EED as discussed above, are mostly limited to FT-ICR MS, but the cost and complexity of these instrument systems limit their availability. Electron transfer dissociation (ETD), a fragmentation technique very similar to ECD, was introduced by Syka et al. for peptide/protein fragmentation [88]. ETD can be carried out in most mass spectrometers, including quadrupole ion trap mass spectrometers, which are widely available. Recently, Han and Costello successfully applied ETD to investigations in a series of milk oligosaccharides and observed extensive cross-ring cleavages as well as other useful fragment ions; this feature of ETD greatly improves the capability of mass spectrometry to determine the linkage types and branching positions for glycans [60]. Figures 9 and 10 (see color insert) compare the results from CID and ETD of reduced and permethylated LSTa, respectively. The mass accuracy can be guaranteed by carrying out the analyses with an FT-ICR MS instrument equipped for ETD; ETD-CID MS3 on the ion trap instrument provides additional valuable clues for revealing fragmentation pathways. Further applications of ETD to the structural determination of glycans, oligosaccharides, glycopeptides, and glycoproteins from biological samples are beginning to be reported.
Fig. 9. CID MS/MS (a) fragmentation and (b) spectrum of reduced and permethylated LSTa [M + Mg]2+ m/z 652.3. Reproduced, with permission, from [60].
Fig. 10. ETD MS/MS (a) fragmentation and (b) spectrum of reduced and permethylated LSTa [M + Mg]2+ m/z 652.3. Reproduced, with permission, from [60].
High throughput analyses and the newly developed fragmentation techniques, such as ECD, EDD, ETD, and EED, which generate much more extensive structural information, have the potential for enormous benefit to the glycobiology community, but they have introduced a new problem: the challenges for interpreting the huge amount of mass spectrometric data and building up the databases and search engines necessary to support future glycobiology research.
GlycoMod is a widely-used software tool designed to predict all possible compositions of a certain glycan structure, either underivatized, or derivatized, based on its experimentally determined mass [89]. The program can also suggest candidate oligosaccharides that are derived from glycopeptides/glycoproteins known in the SWISS-PROT or TrEMBL databases and match the experimental results against the results from the database. UniCarbKB is an online information storage and search platform for glycomics and glycobiology research [90]. It brings together information on the structure, biological origin, and potential function of glycans and links each stored glycan structure to quality experimental data from mass spectrometry, chromatography, and other technologies. Another useful glycan knowledgebase is EUROCarbDB, which is a glycan platform also based on the primary and interpreted analytical data from high-performance liquid chromatography, mass spectrometry, and nuclear magnetic resonance experiments [91]. It offers various web-based research tools to expedite aspects of glycan analysis, structural elucidation, and recommends the format and nomenclature for encoding carbohydrate structures. As mentioned above, LC/MS can be used to compare glycan compositions and abundances among different biological samples. Manual interpretation of the LC/MS data is extremely time-consuming. Zaia and coworkers developed a tool to computationally model LC/MS data on tissue derived heparan sulfate oligosaccharides [92]. The software, GlycReSoft, improves glycan recognition through grouping candidate glycan compositions summarized over their various charge states, adducts, and range of elution times. This strategy can form an essential part of glycomics work flows, which enable efficient profiling of glycans. Going forward, the construction of glycoinformatic databases will drive the leading edge and support innovative approaches to connect various types of glycoanalytical data to a centralized repository of known glycan structures.
This review summarizes the glycomics workflow and the current and emerging mass spectral methods that are available to study the structures of glycans and their functions in biological systems, with a particular emphasis on glycoprotein analysis. Over the past decade, the development of mass spectrometry has increased our knowledge and facilitated exploration of biological carbohydrates. Our understanding of the structures and diversity of glycans in biological samples has increased dramatically due, in large part, to the dramatic improvements in the sensitivity and variety of mass spectrometry approaches. The initiatives that generate glycoinformatics database platforms should hasten the progress in glycocomics by providing freely accessible database tools for carbohydrates researchers and linking glycomics with all areas of biology, medicine, and the environment.
The BUSM Mass Spectrometry Resource for Biology and Medicine is supported by the US National Institutes of Health Grant No. P41 RR10888/GM104603.
REFERENCES
1.Mutenda, K. E., and Matthiesen, R. (2006) in
Mass Spectrometry Data Analysis in Proteomics, Humana Press,
Totowa, New Jersey, p. 289.
2.Ohtsubo, K., and Marth, J. D. (2006) Cell,
126, 855-867.
3.Varki, A., Cummings, R. D., Esko, J. D., Freeze, H.
H., Hart, G. W., and Marth, J. (1999) Essentials of
Glycobiology, Cold Spring Harbor Laboratory Press, Cold Spring
Harbor, New York.
4.Xie, B., and Costello, C. E. (2008) in
Carbohydrate Chemistry, Biology and Medical Applications,
Elsevier, Ltd., New York, pp. 29-56.
5.Apweiler, R., Hermjakob, H., and Sharon, N.
(1999) Biochim. Biophys. Acta – General Subjects,
1473, 4-8.
6.Spiro, R. G. (2002) Glycobiology, 12,
43R-56R.
7.Freeze, H. H. (2006) Nat. Rev. Genet.,
7, 660-660.
8.Harper, J. A., Yuan, J. S., Tan, J. B., Visan, I.,
and Guidos, C. J. (2003) Clin. Gen., 64, 461-472.
9.Opdenakker, G., Dillen, C., Fiten, P., Martens, E.,
Van Aelst, I., Van den Steen, P. E., Nelissen, I., Starckx, S.,
Descamps, F. J., Hu, J. L., Piccard, H., Van Damme, J., Wormald, M. R.,
Rudd, P. M., and Dwek, R. A. (2006) Biochim. Biophys. Acta –
General Subjects, 1760, 610-615.
10.Sperandio, M. (2006) Febs J., 273,
4377-4389.
11.Zaia, J. (2008) Chem. Biol., 15,
881-892.
12.Wopereis, S., Lefeber, D. J., Morava, E., and
Wevers, R. A. (2006) Clin. Chem., 52, 574-600.
13.Samuelson, J., Banerjee, S., Magnelli, P., Cui,
J., Kelleher, D. J., Gilmore, R., and Robbins, P. W. (2005) Proc.
Natl. Acad. Sci. USA, 102, 1548-1553.
14.Goreta, S. S., Dabelic, S., and Dumic, J. (2012)
Biochem. Med., 22, 156-170.
15.Helenius, A., and Aebi, M. (2004) Ann. Rev.
Biochem., 73, 1019-1049.
16.Trombetta, E. S., and Parodi, A. J. (2003)
Ann. Rev. Cell Dev. Biol., 19, 649-676.
17.Moremen, K. W., and Molinari, M. (2006) Curr.
Opin. Struct. Biol., 16, 592-599.
18.Klausner, R. D., and Sitia, R. (1990)
Cell, 62, 611-614.
19.Schachter, H. (2000) Glycoconj. J.,
17, 465-483.
20.Abeijon, C., and Hirschberg, C. B. (1987) J.
Biol. Chem., 262, 4153-4159.
21.Varki, A. (1993) Glycobiology, 3,
97-130.
22.Tarentino, A. L., and Plummer, T. H. (1994)
Guide Techniq. Glycobiol., 230, 44-57.
23.Tarentino, A. L., Gomez, C. M., and Plummer, T.
H. (1985) Biochemistry, 24, 4665-4671.
24.Trimble, R. B., and Maley, F. (1984) Anal.
Biochem., 141, 515-522.
25.Harvey, D. J. (1999) Mass Spectrom. Rev.,
18, 349-450.
26.Takasaki, S., Mizuochi, T., and Kobata, A. (1982)
Meth. Enzymol., 83, 263-268.
27.Wing, D. R., Rademacher, T. W., Field, M. C.,
Dwek, R. A., Schmitz, B., Thor, G., and Schachner, M. (1992)
Glycoconj. J., 9, 293-301.
28.Patel, T., Bruce, J., Merry, A., Bigge, C.,
Wormald, M., Jaques, A., and Parekh, R. (1993) Biochemistry,
32, 679-693.
29.Harvey, D. J. (2011) J. Chromatogr. B: Anal.
Technol. Biomed. Life Sci., 879, 1196-1225.
30.Walker, S. H., Lilley, L. M., Enamorado, M. F.,
Comins, D. L., and Muddiman, D. C. (2011) J. Am. Soc. Mass
Spectrom., 22, 1309-1317.
31.Ciucanu, I., and Kerek, F. (1984) Carbohydr.
Res., 131, 209-217.
32.Ciucanu, I., and Costello, C. E. (2003) J. Am.
Chem. Soc., 125, 16213-16219.
33.Zaia, J. (2004) Mass Spectrom. Rev.,
23, 161-227.
34.Lemoine, J., Chirat, F., and Domon, B. (1996)
J. Mass Spectrom., 31, 908-912.
35.Harvey, D. J., Mattu, T. S., Wormald, M. R.,
Royle, L., Dwek, R. A., and Rudd, P. M. (2002) Anal. Chem.,
74, 734-740.
36.Mechref, Y., Kang, P., and Novotny, M. V. (2006)
Rapid Commun. Mass Spectrom., 20, 1381-1389.
37.Anumula, K. R. (2006) Anal. Biochem.,
350, 1-23.
38.Kalay, H., Ambrosini, M., van Berkel, P. H. C.,
Parren, P., van Kooyk, Y., and Vallejo, J. J. G. (2012) Anal.
Biochem., 423, 153-162.
39.Bones, J., Mittermayr, S., O’Donoghue, N.,
Guttman, A., and Rudd, P. M. (2010) Anal. Chem., 82,
10208-10215.
40.Takahashi, K., Smith, A. D., Poulsen, K., Kilian,
M., Julian, B. A., Mestecky, J., Novak, J., and Renfrow, M. B. (2012)
J. Proteome Res., 11, 692-702.
41.Leymarie, N., and Zaia, J. (2012) Anal.
Chem., 84, 3040-3048.
42.Delaney, J., and Vouros, P. (2001) Rapid
Commun. Mass Spectrom., 15, 325-334.
43.Bruner, F., Crescentini, G., and Mangani, F.
(1990) Chromatographia, 30, 565-572.
44.Hua, S., Nwosu, C. C., Strum, J. S., Seipert, R.
R., An, H. J., Zivkovic, A. M., German, J. B., and Lebrilla, C. B.
(2012) Anal. Bioanal. Chem., 403, 1291-1302.
45.Wu, S. A., Grimm, R., German, J. B., and
Lebrilla, C. B. (2011) J. Proteome Res., 10, 856-868.
46.Wuhrer, M., de Boer, A. R., and Deelder, A. M.
(2009) Mass Spectrom. Rev., 28, 192-206.
47.Wada, Y., Tajiri, M., and Yoshida, S. (2004)
Anal. Chem., 76, 6560-6565.
48.Kanu, A. B., Dwivedi, P., Tam, M., Matz, L., and
Hill, H. H. (2008) J. Mass Spectrom., 43, 1-22.
49.Williams, J. P., Grabenauer, M., Holland, R. J.,
Carpenter, C. J., Wormald, M. R., Giles, K., Harvey, D. J., Bateman, R.
H., Scrivens, J. H., and Bowers, M. T. (2010) Int. J. Mass
Spectrom., 298, 119-127.
50.Harvey, D. J., Scarff, C. A., Crispin, M.,
Scanlan, C. N., Bonomelli, C., and Scrivens, J. H. (2012) J. Am.
Soc. Mass Spectrom., 23, 1955-1966.
51.Zhu, F. F., Lee, S., Valentine, S. J., Reilly, J.
P., and Clemmer, D. E. (2012) J. Am. Soc. Mass Spectrom.,
23, 2158-2166.
52.Vakhrushev, S. Y., Langridge, J., Campuzano, I.,
Hughes, C., and Peter-Katlinic, J. (2008) Anal. Chem.,
80, 2506-2513.
53.Harvey, D. J., Sobott, F., Crispin, M., Wrobel,
A., Bonomelli, C., Vasiljevic, S., Scanlan, C. N., Scarff, C. A.,
Thalassinos, K., and Scrivens, J. H. (2011) J. Am. Soc. Mass
Spectrom., 22, 568-581.
54.Harvey, D. J. (1993) Rapid Commun. Mass
Spectrom., 7, 614-619.
55.Elkin, Y. N., Budnik, B. A., Ivleva, V. B.,
Nazarenko, E. L., O’Connor, P. B., and Costello, C. E. (2011)
Russ. J. Mass Spectrom., 8, 273-280.
56.Reinhold, V. N., Reinhold, B. B., and Costello,
C. E. (1995) Anal. Chem., 67, 1772-1784.
57.Lemoine, J., Fournet, B., Despeyroux, D.,
Jennings, K. R., Rosenberg, R., and de Hoffmann, E. (1993) J. Am.
Soc. Mass Spectrom., 4, 197-203.
58.Harvey, D. J., Bateman, R. H., and Green, M. R.
(1997) J. Mass Spectrom., 32, 167-187.
59.Lancaster, K. S., An, H. J., Li, B. S., and
Lebrilla, C. B. (2006) Anal. Chem., 78, 4990-4997.
60.Han, L., and Costello, C. (2011) J. Am. Soc.
Mass Spectrom., 22, 997-1013.
61.Wolff, J. J., Chi, L. L., Linhardt, R. J., and
Amster, I. J. (2007) Anal. Chem., 79, 2015-2022.
62.Yu, X., Huang, Y. Q., Lin, C., and Costello, C.
E. (2012) Anal. Chem., 84, 7487-7494.
63.Zhao, C., Xie, B., Chan, S. Y., Costello, C. E.,
and O’Connor, P. B. (2008) J. Am. Soc. Mass Spectrom.,
19, 138-150.
64.Adamson, J. T., and Hakansson, K. (2007) Anal.
Chem., 79, 2901-2910.
65.Domon, B., and Costello, C. E. (1988)
Glycoconj. J., 5, 397-409.
66.Carroll, J. A., Willard, D., and Lebrilla, C. B.
(1995) Anal. Chim. Acta, 307, 431-447.
67.Harvey, D. J. (2001) J. Am. Soc. Mass
Spectrom., 12, 926-937.
68.Hofmeister, G. E., Zhou, Z., and Leary, J. A.
(1991) J. Am. Chem. Soc., 113, 5964-5970.
69.Harvey, D. J. (2000) J. Mass Spectrom.,
35, 1178-1190.
70.Fura, A., and Leary, J. A. (1993) Anal.
Chem., 65, 2805-2811.
71.Cancilla, M. T., Penn, S. G., Carroll, J. A., and
Lebrilla, C. B. (1996) J. Am. Chem. Soc., 118,
6736-6745.
72.Zheng, Y. J., Ornstein, R. L., and Leary, J. A.
(1997) J. Mol. Struct. (Themochem), 389, 233-240.
73.Harvey, D. J. (2000) J. Am. Soc. Mass
Spectrom., 11, 900-915.
74.Sheeley, D. M., and Reinhold, V. N. (1998)
Anal. Chem., 70, 3053-3059.
75.Franz, A. H., and Lebrilla, C. B. (2002) J.
Am. Soc. Mass Spectrom., 13, 325-337.
76.Lapadula, A. J., Hatcher, P. J., Hanneman, A. J.,
Ashline, D. J., Zhang, H. L., and Reinhold, V. N. (2005) Anal.
Chem., 77, 6271-6279.
77.Morelle, W., Slomianny, M. C., Diemer, H.,
Schaeffer, C., van Dorsselaer, A., and Michalski, J. C. (2004) Rapid
Commun. Mass Spectrom., 18, 2637-2649.
78.Stephens, E., Maslen, S. L., Green, L. G., and
Williams, D. H. (2004) Anal. Chem., 76, 2343-2354.
79.Leymarie, N., McComb, M. E., Naimy, H., Staples,
G. O., and Zaia, J. (2012) Int. J. Mass Spectrom., 312,
144-154.
80.Harvey, D. J. (2005) J. Am. Soc. Mass
Spectrom., 16, 622-630.
81.Seymour, J. L., Costello, C. E., and Zaia, J.
(2006) J. Am. Soc. Mass Spectrom., 17, 1324-1324.
82.Chai, W. G., Piskarev, V., and Lawson, A. M.
(2002) J. Am. Soc. Mass Spectrom., 13, 670-679.
83.Chai, W. G., Piskarev, V., and Lawson, A. M.
(2001) Anal. Chem., 73, 651-657.
84.Harvey, D. J. (2005) J. Am. Soc. Mass
Spectrom., 16, 631-646.
85.Harvey, D. J., and Rudd, P. M. (2011) Int. J.
Mass Spectrom., 305, 120-130.
86.Wolff, J. J., Amster, I. J., Chi, L. L., and
Linhardt, R. J. (2007) J. Am. Soc. Mass Spectrom., 18,
234-244.
87.Adamson, J. T., and Hakansson, K. (2007) J.
Am. Soc. Mass Spectrom., 18, 2162-2172.
88.Syka, J. E. P., Coon, J. J., Schroeder, M. J.,
Shabanowitz, J., and Hunt, D. F. (2004) Proc. Natl. Acad. Sci.
USA, 101, 9528-9533.
89.Cooper, C. A., Gasteiger, E., and Packer, N. H.
(2001) Proteomics, 1, 340-349.
90.Campbell, M. P., Hayes, C. A., Struwe, W. B.,
Wilkins, M. R., Aoki-Kinoshita, K. F., Harvey, D. J., Rudd, P. M.,
Kolarich, D., Lisacek, F., Karlsson, N. G., and Packer, N. H. (2011)
Proteomics, 11, 4117-4121.
91.Von der Lieth, C. W., Freire, A. A., Blank, D.,
Campbell, M. P., Ceroni, A., Damerell, D. R., Dell, A., Dwek, R. A.,
Ernst, B., Fogh, R., Frank, M., Geyer, H., Geyer, R., Harrison, M. J.,
Henrick, K., Herget, S., Hull, W. E., Ionides, J., Joshi, H. J.,
Kamerling, J. P., Leeflang, B. R., Lutteke, T., Lundborg, M., Maass,
K., Merry, A., Ranzinger, R., Rosen, J., Royle, L., Rudd, P. M.,
Schloissnig, S., Stenutz, R., Vranken, W. F., Widmalm, G., and Haslam,
S. M. (2011) Glycobiology, 21, 493-502.
92.Maxwell, E., Tan, Y., Tan, Y. X., Hu, H., Benson,
G., Aizikov, K., Conley, S., Staples, G. O., Slysz, G. W., Smith, R.
D., and Zaia, J. (2012) Plos One, 7.