Reconstruction of Absolute Absorption Spectrum of Reduced Heme a in Cytochrome c Oxidase from Bovine Heart
A. V. Dyuba*, T. V. Vygodina, and A. A. Konstantinov
Lomonosov Moscow State University, Belozersky Institute of Physico-Chemical Biology, 119991 Moscow, Russia; E-mail: dyubon@gmail.com; vygodina@genebee.msu.ru* To whom correspondence should be addressed.
Received September 13, 2013; Revision received September 20, 2013
This paper presents a new experimental approach for determining the individual optical characteristics of reduced heme a in bovine heart cytochrome c oxidase starting from a small selective shift of the heme a absorption spectrum induced by calcium ions. The difference spectrum induced by Ca2+ corresponds actually to a first derivative (differential) of the heme a2+ absolute absorption spectrum. Such an absolute spectrum was obtained for the mixed-valence cyanide complex of cytochrome oxidase (a2+a33+-CN) and was subsequently used as a basis spectrum for further procession and modeling. The individual absorption spectrum of the reduced heme a in the Soret region was reconstructed as the integral of the difference spectrum induced by addition of Ca2+. The spectrum of heme a2+ in the Soret region obtained in this way is characterized by a peak with a maximum at 447 nm and half-width of 17 nm and can be decomposed into two Gaussians with maxima at 442 and 451 nm and half-widths of ~10 nm (589 cm–1) corresponding to the perpendicularly oriented electronic π→π* transitions B0x and B0y in the porphyrin ring. The reconstructed spectrum in the Soret band differs significantly from the “classical” absorption spectrum of heme a2+ originally described by Vanneste (Vanneste, W. H. (1966) Biochemistry, 65, 838-848). The differences indicate that the overall γ-band of heme a2+ in cytochrome oxidase contains in addition to the B0x and B0y transitions extra components that are not sensitive to calcium ions, or, alternatively, that the Vanneste’s spectrum of heme a2+ contains significant contribution from heme a32+. The reconstructed absorption band of heme a2+ in the α-band with maximum at 605 nm and half-width of 18 nm (850 cm–1) corresponds most likely to the individual Q0y transition of heme a, whereas the Q0x transition contributes only weakly to the spectrum.
KEY WORDS: cytochrome c oxidase, Ca2+, heme a, absorption spectrum, spectral shiftDOI: 10.1134/S0006297913120067
Abbreviations: CBS, cation-binding site; COX, cytochrome c oxidase; EGTA, ethylene glycol-bis(2-aminoethylether)-N,N,N′,N′-tetraacetic acid; TMPD, N,N,N′,N′-tetramethyl-p-phenylenediamine.
Cytochrome c oxidase (COX) is a terminal enzyme of the
mitochondrial and many bacterial respiratory chains that transfers
electrons to oxygen coupled to membrane potential generation and
translocation of H+ across the coupling membrane (reviewed
in [1-3]). Electron transfer is
mediated by four redox centers containing transition metal ions. There
are two hemes (low-spin heme a and high-spin heme
a3) and two copper centers: binuclear
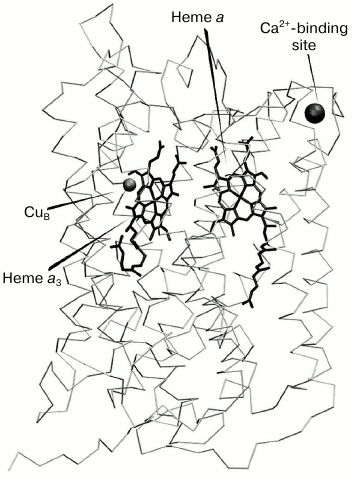
(CuA) and mononuclear (CuB) [4] (Fig. 1). Also, X-ray analysis
revealed an additional cation-binding site (CBS) in COX from
mitochondria and several bacterial species [5-7]. The CBS is situated at the periphery of the main
catalytic subunit (subunit I), rather close to heme a and within
just a few angstroms from the enzyme surface protruding from the
membrane into the external aqueous phase (Fig. 1).
In the bacterial oxidases the CBS is occupied by a tightly bound
calcium ion, whereas in the mitochondrial enzyme calcium binds
reversibly and can be easily removed by chelators such as EGTA [8, 9].
Fig. 1. Subunit I of cytochrome c oxidase from bovine heart with redox centers and calcium-binding site shown ([4], pdbID: 1V55).
Optical absorption spectroscopy is one of the main methods in studies of COX, but despite many years of research the individual spectra of the two hemes have not yet been fully resolved. In particular, the absorption spectra of the hemes a and a3 overlap significantly in the Soret band (420-460 nm) determined mainly by the electronic π→π* transitions in the heme porphyrin rings (B0-transitions). In the reduced enzyme, the hemes give rise to a common band with a maximum at ~444 nm [10, 11], which is somewhat unusual considering the different spin states of the two hemes. In the past, several attempts have been made to reveal the individual absorption spectra of hemes a and a3 in the Soret band of reduced COX by binding various ligands to heme a3 followed by algebraic manipulation of the spectra obtained [10, 12-16], as well as by redox titrations [17] and higher derivative analysis of the spectra [18]. Of these approaches, it is only the “ligand” method that provides the individual absolute spectra of the hemes. However, the method has several disadvantages of which the most significant is that the dependence of the spectral characteristics of one heme on the state of the other heme is neglected.
In the present work, an independent experimental approach is proposed that allows reconstructing the line shape of the absolute absorption spectrum of the reduced heme a on the basis of the difference spectrum induced by binding of calcium ions. As first found by Wikstrom and collaborators [19, 20], calcium binding to mitochondrial COX induces a small red shift of the absorption spectrum of the reduced heme a. The shift titrates with calcium with Kd of ~1 µM [21]. As the shift is very small compared to peak bandwidth, it provides a unique opportunity for modeling: the difference spectrum induced by calcium binding can be treated as the first derivative of the absorption spectrum of the reduced heme a, integration of which provides the line shape of the parent absolute spectrum.
MATERIALS AND METHODS
Reagents and preparations. The pH buffers MES and Tris were purchased from Amresco (USA), sodium dithionite, calcium chloride, EGTA, ascorbate, and potassium cyanide were from Sigma-Aldrich (USA), and TMPD was from Fluka (Germany).
The aa3-type cytochrome c oxidase was isolated from bovine heart mitochondria according to a modified protocol of Fowler et al. [22]. Dodecyl maltoside of SOL-GRADE (Anatrace, USA) was used for enzyme solubilization.
Measurements. Steady-state absorption spectra were recorded in a Cary-300 Bio spectrophotometer (Varian, USA) in 1 ml semi-micro cuvettes with blackened walls (Hellma, Germany) and optical path of 1 cm at 26°C. The measurements were carried out in medium containing 100 mM Tris/MES buffer, pH 8.0, with 0.1% dodecyl maltoside to solubilize COX. The use of NaOH or KOH for adjustment of pH was avoided because Na+ ions expel Ca2+ from the CBS of COX [23] and potassium salts are often contaminated with Na+. The cyanide complex of the oxidized COX was obtained by incubation of the enzyme with excess cyanide (4 mM) for 15 min. Then 100 µM TMPD and 2 mM Tris-ascorbate were added to obtain the mixed-valence cyanide complex [24]. Difference spectra of the Ca2+-induced spectral shift of the reduced heme a were obtained by subtraction of the corresponding absolute spectra (spectrum of the sample in the Ca2+-containing buffer minus spectrum of the Ca2+-depleted enzyme treated with 1 mM EGTA, to extract Ca2+ from the CBS of COX). All the absorption values were normalized to COX concentration in the sample. The concentration of the enzyme was determined from the “dithionite-reduced minus oxidized” difference absorption spectra using molar extinction coefficient Δε605-630 = 27 mM–1·cm–1.
Algebraic transformation, integration, and deconvolution of the spectral curves into Gaussians were made with the aid of custom programs written in the Python 2.7.3 computer language with the extensions Numpy, SciPy, and Matplotlib. The commercial program Origin 7 (Microcal, USA) was used for presentation of the results.
RESULTS
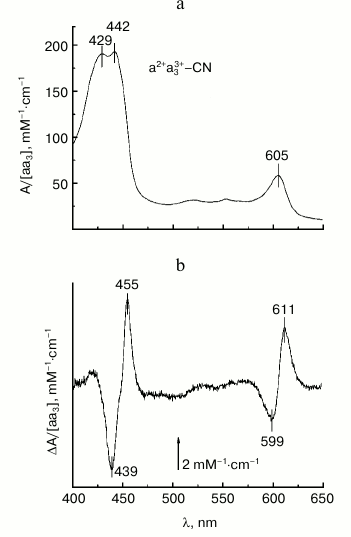
The base experimental spectra used for subsequent modeling are shown in Figs. 2a and 2b. Figure 2a shows the absolute absorption spectrum of mixed-valence cyanide complex of COX a2+a33+-CN (cf. “Materials and Methods”) which is in agreement with data in the literature [10, 13, 24]. There are two prominent absorption bands: a band in the visible region (α-band) with a maximum at 605 nm that belongs largely to the reduced heme a2+, and a stronger near-UV band at 420-460 nm called the Soret- or γ-band with the maxima at ~429 and ~442 nm corresponding to the cyanide-complexed oxidized heme a3 and reduced heme a, respectively. Minor absorption maxima at ~520 and ~550 nm may correspond to a weakly expressed vibronic β-band.
Fig. 2. Base experimental spectra used for modeling. a) Absolute absorption spectrum of the mixed-valence cyanide complex of COX a2+a33+-CN. COX (1.7 μM) in the basic medium was incubated with 4 mM KCN as described in “Materials and Methods” and then reduced by 5 mM Tris-ascorbate in the presence of 100 μM TMPD. b) Difference spectrum of the calcium-induced spectral shift of heme a. The spectrum shows the difference between the absolute spectra of the COX mixed-valence cyanide complex in the presence of calcium and after addition of 1 mM EGTA. The concentration of adventitious calcium in the buffer in the absence of EGTA is ca. 30 μM, i.e. ~30-fold the Kd value, which is sufficient to saturate the calcium binding site even in the absence of added calcium.
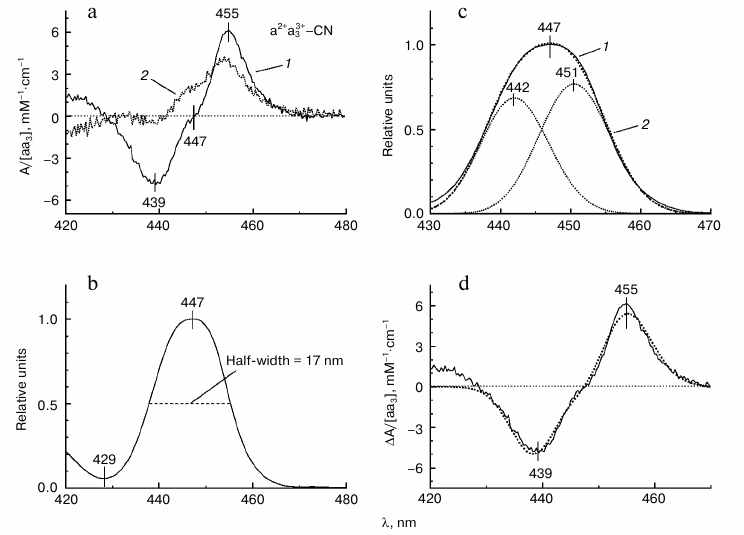
A typical difference spectrum of the absorption shift of the reduced heme a induced by addition of Ca2+ to the mixed-valence cyanide complex of COX a2+a33+-CN (spectrum obtained in the Ca2+-containing buffer minus spectrum after addition of 1 mM EGTA) is shown in Figs. 2b and 3a (spectrum 1). The spectrum has a nearly symmetric line shape and is characterized in the Soret band by a minimum at 439 nm, maximum at 455 nm, and clear inflection point at 447 nm (Fig. 3a, spectrum 1). The magnitude of the spectral changes in the Soret normalized to concentration of COX is 11 mM–1·cm–1. These characteristics are in good agreement with data in the literature [19-21]. The spectral response of COX induced by Ca2+ is selective: it is not the entire Soret band that shifts to the red, but only part of it. This can be demonstrated by constructing the differential of the absolute spectrum of the COX cyanide complex (spectrum 2 in Fig. 3a). Comparison of the line shape of the differential (spectrum 2) with that of the experimental difference spectrum of the spectral shift induced by calcium (spectrum 1) shows similarity between the spectra at longer wavelengths, while at shorter wavelengths the curves differ in position and even sign of the extrema. This difference agrees with the fact that it is the reduced heme a that responds to Ca2+ binding with COX and contributes more to the long wavelength part of the overall Soret band in the mixed-valence cyanide complex of COX. Accordingly, the difference spectrum of the Ca2+-induced spectral shift is centered at 447 nm, which corresponds to the absorption maximum of the reduced heme a but not of the cyanide complex of the oxidized heme a3.
Fig. 3. Reconstruction of the absorption spectrum of reduced heme a of cytochrome oxidase from bovine heart. a) Difference spectrum of the Ca2+-induced red shift of heme a (spectrum 1, solid line) is compared to the first derivative (differential) of the overall spectrum of the mixed-valence cyanide complex of COX (a2+a33+-CN) shown in Fig. 2a (spectrum 2, dotted line). b) Reconstructed line shape of the Soret absorption band of the reduced heme a obtained as the antiderivative (the indefinite integral curve) of the difference spectrum characterizing the calcium-induced spectral shift of heme a (cf. Fig. 2b). The absorption is normalized to its maximal value. The zero line was corrected by adding a constant 0.0244. c) Deconvolution of the reconstructed Soret band of heme a into two Gaussians. Spectrum 1 (solid line), the reconstructed spectrum; spectrum 2 (dotted line), sum of the two Gaussians. d) Comparison of the experimental and simulated difference spectra of the calcium-induced red shift of heme a. Solid line, the experimental spectrum (Fig. 2b). Dotted line, the simulated spectrum corresponding to a shift of the reconstructed absorption band of reduced heme a by Δλ = 0.54 nm.
In the visible region, the difference spectrum induced by addition of Ca2+ to COX shows a symmetric line shape without an inflection point (Fig. 2b), i.e. it corresponds to the first derivative of a single absorption band. The inflection point observed in the γ-band difference spectrum indicates that the spectrum represents the superposition of the first derivatives of at least two absorption bands. Such line shape is anticipated for energy splitting of the transitions Bx and By in heme a. To reconstruct the parent absolute spectrum of heme a in the Soret region, one can integrate the derivative-type difference spectrum (i.e. construct the antiderivative curve). For construction of the antiderivative curve, it is important that the absorption values in the region where the signal is absent are close to zero. To this end, the experimental Ca2+-induced difference spectrum was corrected by subtracting a constant. Integration and all further manipulations were performed on the scale of wavenumbers ν = 107/λ, where ν stands for wavenumber in cm–1, and λ is wavelength in nm. The results are presented on the wavelength scale.
The absolute spectrum of the reduced heme a (the antiderivative curve) in the 400-500 nm range normalized to its maximal value is shown in Fig. 3b. The spectrum is characterized by a maximum at 447 nm and half-width (full width at half-height) of 17.3 nm, while its full width at e–1/8 height is equal to 9.3 nm. Let us denote the last two parameters as w and l, correspondingly. For a single Gaussian, their ratio should be wgauss/lgauss = 22 ln2 = 2.35, while for the spectrum in Fig. 3b the ratio is w/l = 17.3/9.3 = 1.86, which indicates that it is composed of at least two Gaussian components. Spectrum 2 in Fig. 3c has then been modeled by superposition of two Gaussians. It can be seen that within the 430-470 nm region, spectrum 2 is close enough to the antiderivative curve (spectrum 1, solid line) obtained by integration of the Ca2+-induced difference spectrum as described above. Thus, we can conclude that two Gaussian components are sufficient to describe the line shape of the anti-derivative curve in the 430-470 nm range. Decomposition of the spectrum into Gaussian components was performed in two steps: in the first step, the parameters of the components (magnitudes, half-widths, positions) were fitted manually; in the second step, the manually selected parameters were refined with the TNC algorithm (Truncated Newton Constrained) that minimizes mean-square difference between the sum of the Gaussian components and the approximated curve; in this step, the half-widths of the Gaussian components were set equal. The Gaussian components thus obtained are characterized by peaks at 442 and 451 nm, half-widths of 588.7 cm–1 (10.1 nm), and relative magnitudes of 0.68 and 0.77, respectively. According to this result, the heme a2+ Soret absorption band appears to be strongly split in the energies of the electronic transitions B0x and B0y.
The sum of the two Gaussian components approximates well enough the line shape of the absorption spectrum of heme a2+. To reconstruct the absolute spectrum of heme a, the normalized curve has been multiplied by the molar absorption coefficient of 95 mM–1·cm–1 [10] corresponding to the molar extinction of heme a absolute spectrum assumed in the literature. Then the Ca2+-induced spectral shift of the heme a2+ absorption band was simulated, and the results are demonstrated in Fig. 3d. For the simulation, the reconstructed spectrum of heme a was slightly displaced to higher wavelengths and the magnitude of the shift was varied. The shift of Δλ = 0.54 nm proved to be optimal, and the difference between the initial and displaced spectra approximates satisfactorily the line shape of the experimental difference spectrum of the Ca2+-induced effect.
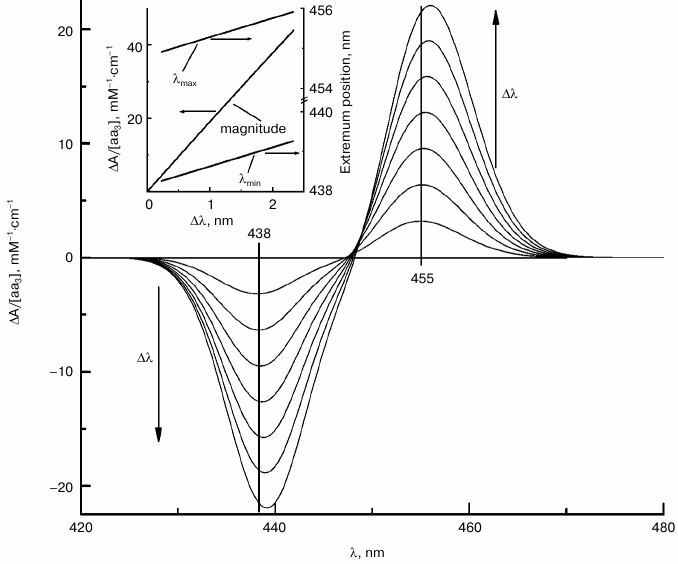
The spectral shift induced by calcium in the visible region corresponds to ca. 1 nm (~27 cm–1) [21], which can be seen directly in the absolute spectra. However, in the Soret region a shift of 27 cm–1 will correspond to only ~0.5 nm which is hard to observe in the absolute spectra taking into account the broadness of the γ-band. For precise estimation of the magnitude of the shift in the γ-band, we took advantage of the fact that in the case of small spectral shifts, the line shape of the difference spectra (i.e. of differential of the absolute spectrum) does not depend significantly on the shift magnitude, Δλ, but the amplitude of the difference spectrum depends on Δλ linearly (Fig. 4, inset). Conceivably, the amplitude of the difference spectrum depends also on molar extinction of the absolute spectrum, εmax. According to data in the literature, the molar extinction of heme a varies within the εmax = 95-115 mM–1·cm–1 range (e.g. [10]). Figure 4 represents differentials for heme a2+ absorption band at increasing shift values, assuming εmax = 95 mM–1·cm–1. It can be seen that the positions of the extrema are almost constant in the 0 < Δλ < 2.3 nm range, while the magnitude of the simulated difference spectrum increases linearly with Δλ. On a graph of the magnitude of the spectral response plotted versus the absorption shift, the amplitude of the difference spectrum obtained experimentally (11 mM–1·cm–1) corresponds to a shift Δλ = 0.59 nm. Accordingly, the extrema of the theoretical and experimental spectra coincide in the region 0.33-0.66 nm. These estimates are in agreement with the results of the optimization with the TNC algorithm, according to which the best agreement between the experimental and model curves is achieved at Δλ = 0.54 nm.
Fig. 4. Modeled difference spectra of the calcium-induced spectral shift of heme a at different Δλ values. The figure shows difference spectra simulating red shift of the Soret absorption band of heme a, reconstructed as a sum of two Gaussian bands (cf. spectrum 2 in Fig. 3c) at different increments of Δλ (0.33, 0.66, 1.00, 1.33, 1.66, 2.00, and 2.33 nm). The arrows indicate the direction of Δλ increase. The inset shows the dependence of the difference spectrum amplitude (left axis) and positions of the extrema (right axis) on Δλ.
DISCUSSION
According to our results, the absolute Soret spectrum of the reduced heme a reconstructed from the difference spectrum of the calcium-induced red shift is characterized by an absorption band with maximum at 447 nm and full width at half-maximal height (half-width) of 17 nm; the latter value is somewhat larger than typical of the absorption bands of reduced low-spin cytochromes: 10 nm for reduced cytochrome c [25], 14 nm for the heme-binding domain of reduced cytochrome b5 [26]. The spectrum obtained can be fitted by a sum of two transitions with centers at 442 and 451 nm and half-widths of ~589 cm–1 (~10 nm).
The presence of the two bands with the indicated maxima is in good agreement with the results obtained by second-derivative spectroscopy of different oxidases [18]. Splitting of the B0-band of heme a into two sub-bands with centers at 437 and 451 nm and half-width of 452 cm–1 but with a somewhat different intensity ratio was obtained by our group earlier with the aid of modeling the absorption and circular dichroism spectra of COX based on dipole–dipole interaction theory [11].
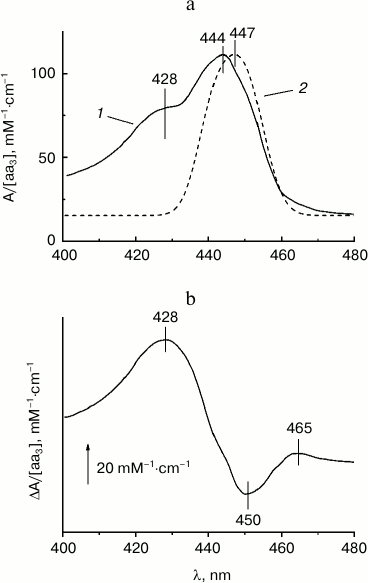
At the same time, the reconstructed Soret band of the reduced heme a differs significantly from Vanneste’s “classical” spectrum of the reduced cytochrome a (taken from Fig. 5 of [10]) obtained by comparison of the spectra of COX in the presence of various ligands of heme a3 (solid line in Figs. 5a and 5b). In the table, the spectral characteristics obtained by the “ligand method” and by the calcium-induced shift approach are compared. According to our results, the maximum of the γ-band of heme a is at 447 nm, i.e. shifted slightly to the red relative to the data in [10]. More importantly, the half-width of the γ-band as given in [10] is by about 20 nm larger than the half-width of the antiderivative for the calcium shift obtained in the present work. To explain this discrepancy, it may be proposed that in addition to the Ca2+-sensitive B0x and B0y transitions in the porphyrin ring, the Soret band spectrum of heme a2+ contains additional bands of other origin that are not affected by calcium; also, they do not contribute significantly to the circular dichroism of COX [11]. Particularly notable is the presence in spectrum 1 of a well-resolved “shoulder” at ~428 nm, which is often observed in the absorption spectra of reduced cytochrome oxidase. The nature of the additional band(s) is not clear. Apparently, it cannot be a vibronic satellite of the B0-transitions of heme a, because in this case it is expected to undergo the same red shift induced by calcium binding. It cannot be excluded that in the Vanneste’s spectrum the band is associated with contribution of the ligand-bound low-spin form of heme a3 or with a vibronic satellite of the heme a32+ B0 band. Presumably, the spectrum obtained in the present work by integration of the difference spectrum of the calcium-induced shift represents only the sum of the perpendicularly polarized x- and y-transitions of the B-band, while contribution of the additional absorption bands becomes significant when the spectrum is reconstructed by the “ligand” method [10].
Fig. 5. Comparison of the reconstructed spectrum of reduced heme a in the Soret region with the conventional spectrum published by Vanneste [10]. a) Soret band of reduced heme a as reported by Vanneste (spectrum 1, solid line) and that reconstructed in this work as a sum of two Gaussian bands (spectrum 2, dotted line). b) Difference between the spectra shown in panel (a) (spectrum 1 minus spectrum 2).
Parameters of the absolute absorption spectrum of the reduced heme
a

Neither experimental data nor theoretical considerations can provide evidence for splitting of the Soret absorption band of reduced heme a3 [11, 27]. In all probability, the splitting of the band in heme a is caused by interaction of the heme with the protein environment. It was shown [18] that second-derivatives of the absorption spectra of several heme a model compounds do not reveal the splitting inherent in the spectra of heme a in reduced heme a-containing oxidases (but cf. [27]). The splitting could originate from strong hydrogen bonding of the formyl group of heme a with the conserved Arg38 (Arg54 in Paracoccus denitrificans enzyme [28, 29]) or could be induced by dipole–dipole interactions. The latter possibility is favored by the calculations [11] showing that the B0x- and B0y-transitions of heme a are virtually degenerate if the interactions with heme a3 and the nearby aromatic amino acid residues are not taken into account, whereas the splitting appears if the dipole–dipole interactions are considered.
One of the drawbacks of the “ligand method” in [10] is that possible influence of the state of one heme on the optical properties of the other is neglected. At the same time, it has been shown [11, 30, 31] that the hemes interact strongly with each other, and optical properties of one heme depend on the state of the neighboring heme. The algebraic procedure used by Vanneste [10] operates with the experimental spectra of the enzyme forms with different states of heme a3, and it is not possible to say to which state of heme a3 the spectrum of the reduced heme a obtained in [10] corresponds.
On the contrary, calcium ions induce only a small perturbation of the heme a spectrum and therefore do not affect any significantly interaction between the hemes. Therefore, the calcium shift-based method of spectrum reconstruction represents an independent experimental approach that allows direct determination of the optical properties of heme a without perturbing its interaction with heme a3. Applying the calcium shift approach to different forms of the enzyme, e.g. to the free reduced form, a2+a33+-CN and a2+a32+-CO, it may be possible in the future to obtain the line shape of the heme a spectrum at different states of heme a3 and to evaluate directly to which extent the redox and spectral characteristics of heme a3 affect the absolute spectrum of heme a.
Finally, it is interesting to point out a discrepancy between the line shapes of the γ- and α-bands of heme a. With the Soret band half-width of 17 nm, one could expect half-width of the α-band to be around 30 nm. However, antiderivative of the calcium-induced spectral shift in the visible region has half-width of only 18 nm and can be approximated well by a single Gaussian (data not shown). This means that either there is no splitting of the visible Q0 band, or that the α-band of COX at ~605 nm represents only one of the two widely split Q0x,y-transitions, while the other transition is but weakly expressed in the absorption spectrum. Accordingly, magnetic circular dichroism (MCD) data show [27] that the α-band of free reduced heme a coordinated by two 1-methyl-imidazoles is split, so that the centers of the Q0x- and Q0y-bands are at 570 and 595 nm, respectively. The MCD spectrum of the reduced cytochrome c oxidase has the same shape but is shifted to the red by ~10 nm, from which it can be inferred that the absorption band observed at ~605 nm corresponds most likely to the Q0y-transition, while the Q0x-transition is not well pronounced in the absorption spectrum.
The authors express their sincere gratitude to Dr. A. M. Arutyunyan for seminal discussions.
This work was supported in part by a grant from the Russian Foundation for Basic Research (No. 11-04-01330-a).
REFERENCES
1.Ferguson-Miller, S., and Babcock, G. T. (1996)
Chem. Rev., 96, 2889-2908.
2.Belevich, I., and Verkhovsky, M. I. (2008)
Antioxid. Redox Signal., 10, 1-29.
3.Yoshikawa, S., Muramoto, K., and Shinzawa-Itoh, K.
(2011) Ann. Rev. Biophys., 40, 205-223.
4.Tsukihara, T., Shimokata, K., Katayama, Y.,
Shimada, H., Muramoto, K., Aoyama, H., Mochizuki, M., Shinzawa-Itoh,
K., Yamashita, E., Yao, M., Ishimura, Y., and Yoshikawa, S. (2003)
Proc. Natl. Acad. Sci. USA, 100, 15304-15309.
5.Vygodina, T. V., Dyuba, A. V., and Konstantinov, A.
A. (2012) Biochemistry (Moscow), 77, 901-909.
6.Yoshikawa, S., Shinzawa-Itoh, K., Nakashima, R.,
Yaono, R., Yamashita, E., Inoue, N., Yao, M., Fei, M. J., Libeu, C. P.,
Mizushima, T., Yamaguchi, H., Tomizaki, T., and Tsukihara, T. (1998)
Science, 280, 1723-1729.
7.Ostermeier, C., Harrenga, A., Ermler, U., and
Michel, H. (1997) Proc. Natl. Acad. Sci. USA, 94,
10547-10553.
8.Pfitzner, U., Kirichenko, A., Konstantinov, A. A.,
Mertens, M., Wittershagen, A., Kolbesen, B. O., Steffens, G. C.,
Harrenga, A., Michel, H., and Ludwig, B. (1999) FEBS Lett.,
456, 365-369.
9.Kirichenko, A. V., Pfitzner, U., Ludwig, B.,
Soares, C. M., Vygodina, T. V., and Konstantinov, A. A. (2005)
Biochemistry, 44, 12391-12401.
10.Vanneste, W. H. (1966) Biochemistry,
65, 838-848.
11.Dyuba, A. V., Arutyunyan, A. M., Vygodina,
T. V., Azarkina, N. V., Kalinovich, A. V., Sharonov, Y.
A., and Konstantinov, A. A. (2011) Metallomics, 3,
417-432.
12.Horie, S., and Morrison, M. (1963) J. Biol.
Chem., 238, 185-189.
13.Yonetani, T. (1960) J. Biol. Chem.,
235, 845-852.
14.Keilin, D., and Hartree, E. F. (1939) Proc. R.
Soc. Lond. B Biol. Sci., 127, 167-191.
15.Lemberg, R., Pilger, T. B., Newton, N., and
Clarke, L. (1964) Proc. R. Soc. Lond. B Biol. Sci., 159,
405-428.
16.Liao, G.-L., and Palmer, G. (1996) Biochim.
Biophys. Acta, 1274, 109-111.
17.Tiesjema, R. H., Muijsers, A. O., and Van Gelder,
B. F. (1973) Biochim. Biophys. Acta, 305, 19-28.
18.Felsch, J. S., Horvath, M. P., Gursky, S.,
Hobaugh, M. R., Goudreau, P. N., Fee, J. A., Morgan, W. T., Admiraal,
S. J., Ikeda-Saito, M., Fujiwara, T., Fukumori, Y., Yamanaka, T., and
Copeland, R. A. (1994) Protein Sci., 3, 2097-2103.
19.Saari, H., Penttila, T., and Wikstrom, M. (1980)
J. Bioenerg. Biomembr., 12, 325-338.
20.Wikstrom, M., and Saari, H. (1975) Biochim.
Biophys. Acta, 408, 170-179.
21.Kirichenko, A., Vygodina, T., Mkrtchyan, H. M.,
and Konstantinov, A. (1998) FEBS Lett., 423, 329-333.
22.Fowler, L. R., Richardson, S. H., and Hatefi, Y.
(1962) Biochim. Biophys. Acta, 64, 170-173.
23.Mkrtchyan, H., Vygodina, T., and Konstantinov, A.
(1990) Biochem. Int., 20, 183-189.
24.Van Buuren, K. J., Zuurendonk, P. F., Van Gelder,
B. F., and Muijsers, A. O. (1972) Biochim. Biophys. Acta,
256, 243-257.
25.Margoliash, E., and Frohwirt, N. (1959)
Biochem. J., 71, 570-572.
26.Aono, T., Sakamoto, Y., Miura, M., Takeuchi, F.,
Hori, H., and Tsubaki, M. (2010) J. Biomed. Sci., 17,
90.
27.Carter, K., and Palmer, G. (1982) J. Biol.
Chem., 257, 13507-13514.
28.Riistama, S., Verkhovsky, M. I., Laakkonen, L.,
Wikstrom, M., and Puustinen, A. (2000) Biochim. Biophys. Acta,
1456, 1-4.
29.Ji, H., Rousseau, D. L., and Yeh, S.-R. (2008)
J. Inorg. Biochem., 102, 414-426.
30.Wilson, D. F., Lindsay, J. G., and Brocklehurst,
E. S. (1972) Biochim. Biophys. Acta, 256, 277-286.
31.Tiesjema, R. H., Hardyg, G. P. M. A., and Van
Gelder, B. F. (1974) Biochim. Biophys. Acta, 357,
24-33.
