REVIEW: Modeling Chlorophyll a Fluorescence Transient: Relation to Photosynthesis
A. Stirbet1, G. Yu. Riznichenko2, A. B. Rubin2, and Govindjee3*
1204 Anne Burras Lane, Newport News, VA 23606, USA; E-mail: sstirbet@gmail.com2Faculty of Biology, Lomonosov Moscow State University, 119992 Moscow, Russia; fax: +7 (495) 939-1115; E-mail: riznich@biophys.msu.ru; rubin@biophys.msu.ru; riznich46@mail.ru
3Department of Plant Biology, Department of Biochemistry and Center of Biophysics and Quantitative Biology, University of Illinois at Urbana-Champaign, 265 Morrill Hall, 505 South Goodwin Avenue, Urbana, IL 61801, USA; fax: 217-244-7246; E-mail: gov@illinois.edu
* To whom correspondence should be addressed.
Received December 20, 2013
To honor Academician Alexander Abramovitch Krasnovsky, we present here an educational review on the relation of chlorophyll a fluorescence transient to various processes in photosynthesis. The initial event in oxygenic photosynthesis is light absorption by chlorophylls (Chls), carotenoids, and, in some cases, phycobilins; these pigments form the antenna. Most of the energy is transferred to reaction centers where it is used for charge separation. The small part of energy that is not used in photochemistry is dissipated as heat or re-emitted as fluorescence. When a photosynthetic sample is transferred from dark to light, Chl a fluorescence (ChlF) intensity shows characteristic changes in time called fluorescence transient, the OJIPSMT transient, where O (the origin) is for the first measured minimum fluorescence level; J and I for intermediate inflections; P for peak; S for semi-steady state level; M for maximum; and T for terminal steady state level. This transient is a real signature of photosynthesis, since diverse events can be related to it, such as: changes in redox states of components of the linear electron transport flow, involvement of alternative electron routes, the build-up of a transmembrane pH gradient and membrane potential, activation of different nonphotochemical quenching processes, activation of the Calvin–Benson cycle, and other processes. In this review, we present our views on how different segments of the OJIPSMT transient are influenced by various photosynthetic processes, and discuss a number of studies involving mathematical modeling and simulation of the ChlF transient. A special emphasis is given to the slower PSMT phase, for which many studies have been recently published, but they are less known than on the faster OJIP phase.
KEY WORDS: chlorophyll a fluorescence, Kautsky transient, mathematical simulation, nonphotochemical quenching (NPQ) of the excited state of chlorophyll, plastoquinone pool, state changesDOI: 10.1134/S0006297914040014
Dedication—This review is dedicated to the memory of Alexander Abramovitch Krasnovsky (1913-1993), an international pioneer of “photobiochemistry”, literally an academic giant. According to Govindjee’s presentation, at the Russian Academy of Sciences, on October 10, 2013, in Moscow, at his 100th birth anniversary, Academician Krasnovsky “was always ahead of his time”. In 1948, he discovered the reversible photochemical reduction of chlorophyll by ascorbic acid; this was the first reversible photochemical reaction of chlorophyll (that became known as the Krasnovsky reaction). In 1956, Krasnovsky and coworkers discovered different spectral forms of chlorophyll a in vivo that were only much later observed by others, including Govindjee (one of the coauthors of this review), to belong to the two different photosystems of photosynthesis. By 1963, Krasnovsky had shown that chlorophyll can indeed be used in model systems to serve as an uphill electron carrier, long before the term “artificial photosynthesis” became a common word. And, by 1977, V. V. Klimov, A. V. Klevanik, and V. A. Shuvalov, working with him, discovered that pheophytin was a photosystem II electron acceptor preceding the first plastoquinone electron acceptor QA. During the 1980s, Krasnovsky’s group adopted liposomal systems and succeeded in using methyl viologen as an electron acceptor; more importantly, they were able to show hydrogen evolution in the presence of bacterial hydrogenase – again ahead of time, as Govindjee stated in his talk in Moscow.
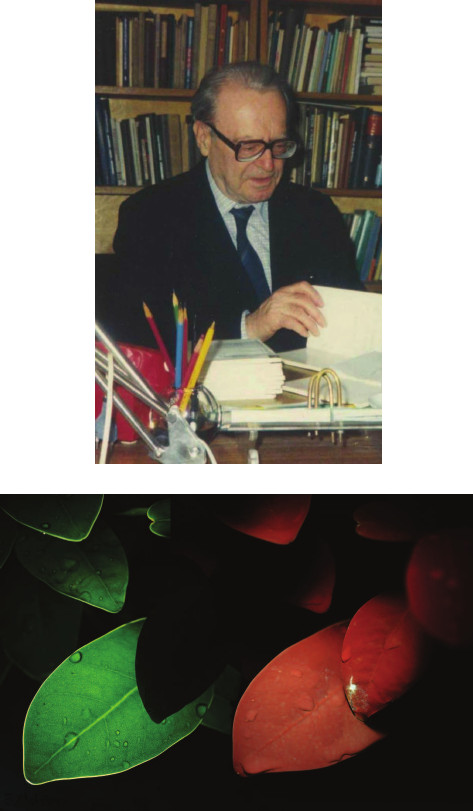
Academician Krasnovsky was not only a scientist of great repute, but an excellent artist. Thus, we honor him with a unique photograph of green leaves of Ficus microcarpa as well as red fluorescence from them (Fig. 1), the topic of the present review. (See the legend for details; photograph and its legend is a courtesy of Eugene Maksimov and Maria Maksimova)
Fig. 1. Top: Academician Alexander Abramovitch Krasnovsky. Bottom: a unique photograph of leaves of Ficus microcarpa (by Eugene Maksimov and Maria Maksimova) taken in a dark room showing both green leaves and leaves with red fluorescence. Left: white light from Light Emitting Diodes (LEDs) was provided from behind the leaves; they absorbed red and blue light and transmitted green light. Right: chlorophyll fluorescence; UV light from LEDs (390 nm peak, 400 nm band-pass filter; Thorlabs Inc., USA) was given on the front of the leaves. A 450 nm Thorlabs long-pass filter was mounted in the lens hood to block the light used for fluorescence excitation, but it allowed measurement of green transmitted light (left) and of red fluorescence light (right) at the same time. A digital mirror-less camera (Sony NEX5n with 30 mm macro lens) was used to take this photograph; the camera was mounted on a tripod since a 5 min exposure was needed to obtain the right part (fluorescence) image.
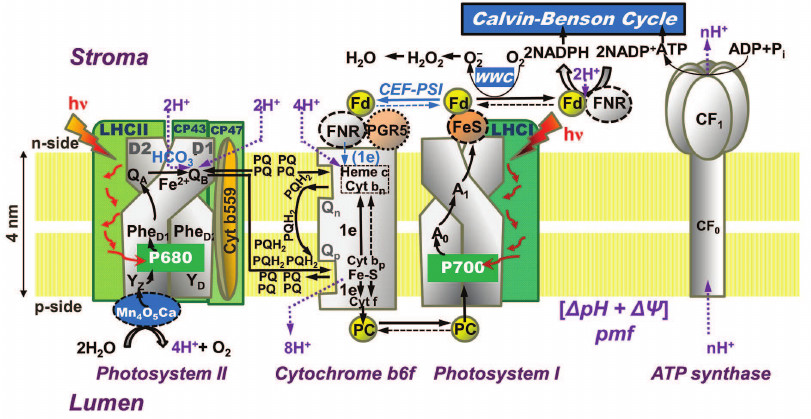
In oxygenic photosynthetic organisms (higher plants, algae, and cyanobacteria), two photosystems (PS), PSI and PSII, work in tandem to oxidize water to oxygen, to reduce nicotinamide adenine dinucleotide phosphate (NADP+), and produce ATP that are used together with NADPH in the Calvin–Benson cycle for CO2 fixation or in other assimilatory processes (Fig. 2). PSII oxidizes water and reduces a cytochrome (see reviews [1, 2]), while PSI oxidizes the reduced cytochrome and reduces NADP+ (see review [3]). The proton motive force (pmf), i.e. the pH gradient (ΔpH) plus the membrane potential (ΔΨ), which is built across the thylakoid membrane during the photosynthetic electron transport (PSET), is used for ATP synthesis by the ATP synthase. For the basics of oxygenic photosynthesis, see references [4-7]; and for a background on chlorophyll (Chl) a fluorescence, see chapters in two books [8, 9].
Fig. 2. Diagram of a thylakoid membrane showing four major protein complexes, which are used for the production of ATP and NADPH. From left to right: Photosystem II (PSII; water-plastoquinone oxidoreductase), cytochrome (Cyt) b6f (plastoquinol-plastocyanin-oxidoreductase), Photosystem I (PSI; plastocyanin-ferredoxin-oxidoreductase), and ATP synthase. The ATP and NADPH produced during the light phase of photosynthesis are used in the Calvin–Benson cycle to fix CO2 to produce sugars. (1) PSII: Mn4O5Ca is the manganese-oxygen-calcium cluster in the oxygen-evolving complex (OEC); YZ (tyrosine-161 on the D1 protein) is a secondary electron donor in PSII; YD, a tyrosine on the D2 protein, which does not participate in normal electron transport; P680 is the primary PSII electron donor; PheD1 (the primary electron acceptor) and PheD2 (inactive) are pheophytins on the D1 and D2 proteins, respectively; QA is the secondary electron acceptor (a one-electron accepting plastoquinone tightly bound to a site on the D2 protein); QB (a two-electron accepting plastoquinone located on the D1 protein, on the stroma side of the membrane); HCO3– is a bicarbonate anion bound to a non-heme iron (Fe2+) that sits between QA and QB, which is assumed to participate in QB2– protonation; PQ is one of the several plastoquinone molecules in the mobile PQ pool in the thylakoid membrane; PQH2 is plastoquinol; (2) Cyt b6f: (Fe-S) is an iron-sulfur protein, known as the Rieske FeS protein; Cyt f is cytochrome f; Cyt bp (situated toward the lumen, close to the electrically positive side of the membrane, the Qp-side) and Cyt bn (situated toward the stroma, close to the electrically negative side of the membrane, the Qn-side) are two cytochromes b6, which participate in the oxidation and reduction of PQH2 and PQ, respectively (PQH2 is oxidized at the Qp-site by Cyt bp, while PQ is reduced, during the so-called “Q-cycle”, at the Qn-site by the Cyt bn); FNR, a ferredoxin-NADP+-reductase, and PGR5, a proton gradient regulator, are involved in cyclic electron flow (CEF) around PSI involving ferredoxin (Fd); (3) PSI: PC is plastocyanin, a mobile water-soluble copper protein functioning as a secondary PSI electron donor (there are more than one PC molecules per PSI); P700 (a special Chl a pair) is the primary electron donor of PSI; A0 (a special Chl a molecule) is the primary PSI electron donor; A1 (vitamin K1) is the secondary PSI electron acceptor; FeS represents three non-heme iron-sulfur centers; Fd is ferredoxin, a mobile water-soluble non-heme iron protein (there are more than one Fd molecules per PSI); NADP+ is nicotinamide-adenine dinucleotide phosphate, which is reduced to NADPH via FNR (ferredoxin NADP-reductase); WWC is the water–water cycle in which O2 is reduced to O2– by reduced Fd, and subsequently, the H2O2 formed can be converted to water. (4) ATP synthase: CF0 and CF1 are the lumen-exposed and the transmembrane part of the ATP synthase, respectively; ADP is adenosine diphosphate; ATP is adenosine triphosphate; Pi is inorganic phosphate; pmf is the proton motive force (made up of the membrane potential (ΔΨ) and the transmembrane proton concentration difference (ΔpH)) that is used by the ATP synthase. This diagram was modified by A. Stirbet and Govindjee from an earlier diagram by Stirbet and Govindjee [24]; it also includes information from other references [23, 273, 366, 367]. We thank William Cramer for suggestions to improve an earlier version of this diagram. A similar figure has also been provided to Papageorgiou and Govindjee for publication in their chapter in a forthcoming book [215].
The initial event in oxygenic photosynthesis is light absorption by chlorophylls (Chls), carotenoids (Cars), and phycobilins (in cyanobacteria and in red algae); these pigments are embedded in light-harvesting complexes (LHCs), or phycobilisomes (PBSs), the antenna systems. The excitation energy is transferred efficiently and rapidly within the antenna, until it reaches the reaction centers (RCs), where the photochemistry (i.e. the charge separation) takes place. The small part of excitation energy that is not used in photochemistry is dissipated either as heat (internal conversion), or re-emitted as fluorescence (2-10% [10]). Since these three processes, i.e. photochemistry, heat dissipation, and fluorescence, are not independent, but are in competition with each other, the fluorescence yield contains information on the efficiency of the other two processes. In higher plants and green algae, chlorophyll fluorescence, at room temperature, has a major peak centered around 685 nm (attributed mainly to light-harvesting antenna in PSII), and a broad shoulder between 700 and 750 nm (that includes vibrational sub-bands of PSII Chl a emission and an emission band from PSI Chls). In phycobilisome (PBS)/Chl a-containing cyanobacteria, accessory pigments (C-phycocyanin (CPC) and allophycocyanin (APC)) also contribute to fluorescence signal, since excitation energy transfer, from them, to Chl a is not 100%. Moreover, cyanobacteria (except prochlorophytes) do not contain Chl b, and the ratio of PSI to PSII ranges from 3 to 5 [11], in contrast to green algae and higher plants where this ratio is close to 0.6-1.0 [12].
The Kautsky effect: chlorophyll fluorescence transient. Kautsky and Hirsh ([13], also see http://www.fluoromatics.com/kautsky_effect.php) discovered that, in contrast to fluorescence of Chl a in solution, intensity of Chl a fluorescence (ChlF) in vivo is not constant under steady light excitation, but shows characteristic transitory changes in time, called ChlF induction, or transient; it became known simply as the Kautsky effect. Chl a fluorescence represents a real signature of photosynthesis, since a large variety of photosynthetic events have been related to it (see reviews [14-25]; and chapters in books [9, 26-28]). ChlF transients are measured by using mainly two types of fluorometers: (1) one that uses modulated light (e.g. a PAM (Pulse Amplitude Modulation) instrument; Walz, Germany), in which the excitation light is applied at a specific frequency that can be detected preferentially by a light detector; and (2) another that uses non-modulated (continuous) light for excitation (e.g. a PEA (Photosynthetic Efficiency Analyser) instrument; Hansatech, UK). In addition to the above fluorometers, we have fast repetition rate (FRR) fluorometers, pump and probe (P&P) fluorometers; pump during probe (PDP) fluorometers; fluorescence induction and relaxation (FIRe) instruments; background irradiance gradient single turnover (BIG-STf) fluorometers; and advanced laser fluorometers (ALF) (see review [29]). There is another method, in which digitally controlled illumination is used as a source of actinic light for physiological studies with a PAM fluorometer [30]; it provides an unprecedented flexibility in the control of different aspects of the projected actinic light field. Special protocols for fluorescence analysis have been developed for each of these techniques (see reviews [21, 23, 31-33]). Here we will discuss mainly ChlF induction curves measured by direct fluorometry (see Fig. 3 for several ChlF transients measured in different photosynthetic organisms).
Fig. 3. Chlorophyll fluorescence (ChlF) transients measured in different oxygenic photosynthetic organisms. The ChlF transients shown in the figure were measured in: Acaryochloris marina, a Chl d/Chl a-containing cyanobacterium that lacks phycobilisomes (redrawn from the original figure by Papageorgiou et al. [22]); Synechococcus sp. PCC 7942 cells, a Chl a-containing cyanobacterium (redrawn from the original figure by Tsimilli-Michael et al. [146]); and leaves of Pisum sativum (redrawn from the original figure by Strasser et al. [69]). The O, J, I, P, S, M, and T steps (where O (origin) is the first measured minimum fluorescence level; P is the peak; S stands for semi-steady state; M for a maximum; and T for a terminal steady state level) are marked in the diagram. All curves were measured with the PEA (Photosynthetic Efficiency Analyser, Hansatech) instrument under red light of 3000 μmol photons·m–2·s–1, with the exception of Pisum sativum (curve 2), which was measured with 30 μmol photons·m–2·s–1. Left curves are on log (time) scale, whereas the right curves are on linear (time) scale.
Variable and constant fluorescence. The variable (chlorophyll) fluorescence is generally assumed to originate from PSII antenna, while PSI fluorescence is considered constant. Further, the constant part of PSII fluorescence has much higher yield than the PSI fluorescence [34-36]; the extent of PSI contribution to the overall fluorescence signal depends on the PSI/PSII ratio and the wavelength at which the fluorescence is measured (see a review on PSI fluorescence [37]). The PSI fluorescence, at room temperature, usually represents only ~10% of the initial minimum fluorescence when measured at 685 nm [15, 38], while at wavelengths greater than 710 nm, it could be as high as ~30% [39-41]. Moreover, fluorescence from unconnected antenna complexes may also contribute to the non-variable fluorescence [42]. In the case of cyanobacteria, Chl a fluorescence is predominantly that sensitized by PBS, the direct fluorescence contribution of Chl a, CPC, and APC to the total fluorescence signal being small (see discussion in [22]). Since the variable fluorescence originates from Chl a in PSII, ChlF transient is frequently used to estimate PSII photochemical activity (e.g. the quantum yield of the primary PSII photochemistry [43]). In principle, the constant PSI fluorescence, as well as the fluorescence from unconnected antenna complexes, must be subtracted from the total fluorescence signal (see a procedure for PSI correction in [41]) to obtain quantitative information on the quantum yield of PSII photochemistry, but frequently these corrections have been neglected. Chlorophyll fluorescence induction curve. When a sample kept in dark is exposed to light, ChlF intensity shows characteristic changes called fluorescence induction, fluorescence transient, or simply the Kautsky effect. ChlF induction curve displays two transient phases (or waves) that are generally labeled by using the observed inflection points (see Fig. 3; for a history of the ChlF transient nomenclature, see [16]): (1) a fast wave (up to hundreds of milliseconds) that was earlier labeled as OI1I2P [44], but later renamed as OJIP [45, 46]; here, O (origin) is the first measured minimum fluorescence level, J and I are intermediate inflections, and P is the peak; (2) a slower wave (seconds to tens of minutes), labeled as PSMT [47, 48], where S stands for semi-steady state, M for a maximum, and T for a terminal steady state level. The ChlF transients are in general reversible, if the samples are darkened for 15-30 min before a new measurement is made. We note that, in general, the OJIP phase is much more reproducible than the PSMT phase. Further, the integrity of chloroplasts is important for the retention of both the OJIP and PSMT waves, and thus the ChlF transient can also be used as a monitor of the functional integrity of chloroplasts in vivo and in vitro [16, 43, 49]. Besides the main inflection points, mentioned above, additional ones have been observed under certain conditions, such as in heat-stressed samples, when another inflection called “K” was observed between the O and J levels, at ~0.3 ms [50, 51]. Also, in foraminifers, zooxanthellae, lichens, and some algae, the P-level was found to split into two: G and H (the latter considered equivalent to P, with G being a new level [52]) (Fig. 4a). It is also important to note that, in contrast to higher plants and algae, in which the maximum fluorescence yield during the transient is observed at the peak P, with the subsequent peak M being much lower or absent (Fig. 3), the maximum fluorescence in phycobilisome (PBS)-containing cyanobacteria occurs at the M level, which is much higher than the P level (see Fig. 3).
Fig. 4. a) Different steps (O, K, J, I, H, G, and P) observed in fast chlorophyll fluorescence transients: 1) OJIP fluorescence transient measured in dark-adapted pea leaf under 3400 μmol photons·m−2·s−1 red light (no treatment); 2) in pea leaf incubated for 5 min at 47°C in water; 3) in potato leaf incubated for 13 min at 44°C in water; 4) in lichen Umbilicaria hirsuta (no treatment). Graphs were redrawn from the original figure by Lazar [19]. b) Light intensity dependence of OJIP-transients measured in pea leaves. Fast fluorescence transients were measured under light intensities of 3000 (1), 5000 (2), 7500 (3), 10,000 (4), and 15,000 (5) μmol photons·m−2·s−1. Curves were normalized at both Fo and Fm. Changes in the J position, as a function of light intensity, are shown by a line in the diagram. Graphs were redrawn from the original figure by Schansker et al. [70].
The origin of variable chlorophyll a fluorescence. The conventional understanding of the origin of the variable fluorescence during the OJIP rise is based on the hypothesis of Duysens and Sweers in 1963 [53], who had assumed that the fluorescence yield is controlled by a PSII electron acceptor that also acts as a quencher “Q” of fluorescence, which was later identified as the primary quinone acceptor QA in its oxidized state [54]. Reversal of this quenching (i.e. fluorescence rise) takes place in PSII RC when QA is reduced, i.e. YZ P680* Phe QA → YZ P680+ Phe– QA → YZ+ P680 Phe QA– (see Fig. 2 and its legend; YZ is tyrosine 161 on D1 protein; it is the electron donor to P680+, P680 is the reaction center of Chl(s) of PSII, and Phe is pheophytin, the primary electron acceptor of PSII). Although we will use the theory of Duysens and Sweers to interpret Chl fluorescence rise, a few additional components that can transiently affect the OJIP induction will be also considered, as e.g. P680+, ChlZ+, and Phe– that have also been shown to act as quenchers of fluorescence (see [24] for a list of factors influencing Chl a fluorescence in vivo). Moreover, we note that the nanosecond (ns) delayed light emission (DLE; also called DF for delayed fluorescence) generated by charge recombination of the primary radical pair P680+Phe− when QA is reduced has also been suggested to explain the entire [55], or a small part [56] of the variable fluorescence (see a discussion in [57]). Further, other alternative views to the theory of Duysens and Sweers exist in the literature (see reviews [24, 25, 58]) where it is assumed that: (1) most of QA is reduced during the O-J rise; and (2) a hypothetical second quencher is removed (or another process leads to fluorescence increase) during the J-I-P rise. These alternative theories will not be discussed in this review. During the slow PSMT wave, besides the effects of QA, the fluorescence yield is also modulated by several other processes such as, e.g. nonphotochemical quenching (NPQ) of excited state of Chl a in PSII antenna; this is triggered by: low pH in the lumen; “state changes” (State 1 being more fluorescent than State 2); changes in cyclic electron flow around PSI; and even indirectly due to activation of Calvin–Benson cycle (and enzymes therein), some of which remain to be still understood (see e.g. [22, 59-62]). The fact that Chl a fluorescence is directly or indirectly affected by complex physical and biochemical processes, as those just mentioned, make it very suitable for mathematical modeling and simulation, especially since many photosynthesis-related quantities, very useful for modeling, are now available [63]. This kind of approach is very useful for the evaluation of different hypotheses in relation to specific mechanisms involved, and the characterization of samples under investigation. The rapid development of computers has provided new opportunities to simulate fast FI curves (the OJIP phase, which is over within a second). We note that it all started with the pioneering work of Renger and Schulze in 1985 [64], who presented a model based on changes in redox states of the electron acceptors of PSII. Later, the electron donor side of PSII, recombination between PSII electron acceptors and donors, the build-up of the transmembrane pH gradient (ΔpH) and membrane potential (ΔΨ), fluorescence quenching by oxidized PQ pool and other NPQ (nonphotochemical quenching) processes of the excited state of Chl(s) in both major and minor PSII antenna, electron transport reactions beyond PSII involving Cyt b6f, PSI, alternative electron transport routes, such as the water–water cycle, Calvin–Benson cycle and other physiological processes, were included in detailed models (see chapters in [27]). In this review, we will focus on different steps of the OJIPSMT transient and their relation to various photosynthetic processes (see also a review [22]), and on theoretical results obtained through mathematical simulations, with emphasis on models related to the slow PSMT phase, which had received less attention in the past (see reviews on modeling Chl a fluorescence induction transients [18, 19, 24, 65]).
THE FAST Chl FLUORESCENCE INDUCTION WAVE: MICROSECONDS TO ABOUT A
SECOND
The OJIP wave (up to hundreds of milliseconds) is visually obvious when presented on a logarithmic-time scale [45, 46, 66], since the O-J, J-I and I-P phases have different kinetics (see Fig. 3). In order to compare curves from different samples, we need to normalize the transients by using either: (1) a simple normalization at Fo, by using Ft/Fo (where Ft is the fluorescence at time t), which usually varies between 1 and 5; or (2) a double normalization, i.e. at both Fo and Fm, which gives the relative variable fluorescence at time t, V(t) = (Ft – Fo)/(Fm – Fo) = ΦF(t), where ΦF(t) is the fluorescence yield (with values between zero and 1). The raw fluorescence values at different inflection points are also used to calculate additional fluorescence parameters that characterize much more fully the photosynthetic samples under investigation (see e.g. [20, 21, 23]).
In agreement with the theory of Duysens and Sweers [53], and after a dark adaptation period, most QA molecules are in the oxidized state (i.e. at Fo almost all active PSII units are “open”), being gradually reduced during illumination, until the P level is reached; under saturating light, all QA molecules are reduced in all active PSII units at the P level (i.e. Fm is attained when all active PSII units are “closed”). The inflections of the ChlF induction curve reflect changes in the net reduction rate of QA, which depend on the kinetics of the redox reactions between various components of the photosynthetic electron transport (PSET). This allows the use of the OJIP transient as a quick monitor of both the electron donor and the electron acceptor sides, and of the effects of inhibitors and mutations on these processes [16, 43]. Below, we will discuss the two segments of the fast OJIP rise, O-J and J-I-P.
The O-J Rise
The O-J rise, which under saturating light takes place within ~2 ms, represents the photochemical phase of the ChlF induction [67-69], since the relative height (see Fig. 4b) and initial slope of this phase depend strongly on the number of photons absorbed by the sample (which is proportional to the irradiance and PSII absorption cross section), and is not very sensitive to temperature. Experimental data [70], simulations of the OJIP transient [71-73], as well as mathematical analysis of experimental OJIP curves [74, 75], predict that part of closed PSII centers present at the J step must have undergone more than one turnover, so that at this level PSII units are mainly in QAQB, QA–QB, and QA–QB– states. By increasing light intensity, the PSII fraction in the QA–QB state increases, and the position of J shifts to lower times (Fig. 4b). The dip after J, observed especially at high light intensities (see Fig. 4b), has been assumed to reflect a transient reoxidation of QA– and an accumulation of P680+ (i.e. the oxidized primary donor of PSII that is also a quencher of Chl fluorescence [76, 77]) due to a transient limitation on the PSII donor side [70, 78]. This explanation is supported by mathematical simulations [79].PSII excitonic connectivity. Joliot and Joliot [80] found that in the green alga Chlorella, both oxygen and fluorescence yields had a hyperbolic relationship with the fraction of closed PSII reaction centers. They succeeded in fitting the experimental data (Fig. 5) with a theoretical model based on the concept of excitonic connectivity between PSII reaction centers, in which an exciton from antenna visiting a closed PSII RC goes to another open PSII RC. As a result, the trapping cross section of the open RCs increases as their neighbors become closed (see reviews on PSII excitonic connectivity [81, 82]). Experimental and theoretical data support the idea that PSII excitonic connectivity involves at least four to five PSII RCs [83-86]. In this sense, the quasi-linearity of ΦF versus τav (i.e. average fluorescence lifetime) observed during the fluorescence induction [35, 84, 87-90] may be taken as an argument against the idea of domains containing smaller number of units.
Fig. 5. Evaluation of the connectivity parameter (p) in a cell suspension of a green alga Chlorella. a) Chl a fluorescence induction kinetics in Chlorella cells (solid line) and theoretical transients (dash-dotted lines) calculated for values of the connectivity constant of 0.0, 0.5, and 0.8. b) Rates of oxygen evolution (circles) in Chlorella cells as a function of the fraction of active PSII units, q. See text for details. The figure was redrawn from the original figure by Joliot and Joliot [80].
Equations showing the hyperbolic dependence of the fluorescence yield (ΦF) on the fraction of open RC (q) that were derived using different theoretical models are:
ΦF = (1 – p)(1 – q)/[1 – p(1 – q)], with p = ω(1 – Fo/Fm) [84], (1)
ΦF = (1 – q)/[1 + p2G(Fm/Fo – 1)q] [91], (2)
ΦF = (1 – q)/(1 + Jq) [85], (3)
where p is the connectivity parameter defined as the probability of the excitation energy transfer from a closed PSII RC to a neighboring one; ω has values between 0 (when all PSII units are assumed isolated, i.e. the “puddle” model) and 1 (when all PSII units are assumed interconnected, i.e. the “lake” model); p2G is the overall grouping (G) probability, which depends on the probabilities of excitation transfer between different PSII antenna domains [82, 91, 92]; further, J = CHYP = p2G(Fm/Fo – 1) represents the sigmoidicity parameter (or hyperbola constant). We note that Eq. (1) is a generalization of the relationship derived previously by Joliot and Joliot [80].
While these theoretical approaches have led to different formulae for the relationship between ΦF and q (see above), they are all equivalent, and their parameters are correlated: J = CHYP = p2G(Fm/Fo – 1) = p/(1 – p). It is important to note that p and p2G have different significance and values. Indeed, if we give to J and Fm/Fo ratio the experimental values obtained in higher plants, i.e. J (= CHYP) = 1.5 and Fm/Fo = 5, we obtain: p = 0.6, ω = 0.75 and p2G = 0.375. The overall grouping probability p2G has lower values than ω because it represents the probability for energy transfer between PSII units when they are all open, while ω represents the probability for energy transfer between PSII units when they are all closed [93]. The use of p2G or ω in studies analyzing the PSII excitonic connectivity is recommended, since p and J (or CHYP) depend on Fo and Fm values, which are not influenced by the degree of PSII connectivity [57], and therefore reflect variations that are not exclusively related to PSII excitonic connectivity (see e.g. [94]).
Plotting the difference between double normalized O-J kinetics of two samples, with different degrees of PSII excitonic connectivity, reveals the presence of a “peak” around 100-150 μs (which is labeled as the L-band [95]). Besides this simple qualitative comparative method that may be used to emphasize differences in PSII excitonic connectivity between samples, another method has been used to determine quantitatively the degree of PSII excitonic connectivity in a sample, which requires the measurement of ChlF transient in the presence of 3-(3,4-dichlorophenyl)-1,1-dimethylurea (DCMU) [96]. For several other methods, which employ directly the OJIP transient to evaluate the connectivity parameter (see [71, 82, 97-100]); we note that in [99] and [100], authors used equations that had been derived by Lavergne and Trissl [85] to fit the O-J phase of the fluorescence transient. For the evaluation of the PSII excitonic connectivity, by any method, it is important to have an accurate Fo value, since an increased apparent Fo will lead to a truncated sigmoidal part of the O-J rise, which will be wrongly interpreted as a lower or even absence of PSII excitonic connectivity (see discussion in [86]). However, if the Fo value is accurate, a true Fm is not necessary for a correct evaluation of p2G (or ω) [82]. Finally, we note that there are alternative explanations for the sigmoidicity of the fluorescence transient; these deny the existence of excitonic connectivity between PSII units [70, 101]. Further examination and research is needed to check the validity of these challenges to the widely accepted concept of connectivity between PSII units.
The K step. As mentioned earlier, high temperature treatment leads to the appearance of a new inflection point or a maximum (at ~0.3 ms) in the OJIP transient [50, 51, 102, 103], labeled as K (see Fig. 4a). Under high heat stress (e.g. leaves incubated for 5 min at 47°C), fluorescence decreases after the K step (and the inflections J and I disappear); further, a second maximum equivalent to P appears with a rise time of 0.2-2 s (Fig. 4a). Exposure of plants to high temperature is known to lead to inactivation of Rubisco activase and of the oxygen-evolving complex (OEC) of PSII (the latter by the removal of extrinsic proteins and by the release of calcium and manganese ions from their binding sites), as well as possible damage of the D1 and D2 proteins (see e.g. discussion in [104-106] and references therein). A mathematical model, which includes fast reactions around PSII [107], supports the idea that the K-band reflects inactivation of the OEC (i.e. the PSII donor side). Initially, fluorescence rises, in heat-treated samples, as it does in untreated samples: after charge separation (P680*Phe → P680+Phe–), QA receives an electron from the reduced pheophytin Phe–, while P680+ (a very efficient Chl fluorescence quencher [24]) is rapidly reduced by YZ (Fig. 2). However, further, when QA receives an electron from Phe– for a second time, P680+ cannot be reduced, since, due to an inactive OEC, the YZ+, formed earlier, remains oxidized; therefore, fluorescence is quenched both by P680+ itself, and by a fast charge recombination between QA– and P680+, which leads to the appearance of the K peak, around 300 μs. The fluorescence rise to the second maximum P was shown to be related to slow electron transport from alternate intrinsic PSII donors capable of reducing P680+, as e.g. ascorbate [104-106].
A related effect, an increase of the initial O-J slope, has been observed in higher plants and green algae grown under nutrient (e.g. nitrogen or sulfur) deficiency [108-110]. In this case, the difference between the normalized O-J kinetics of the nutrient-deficient and control samples reveals the presence of a K-band that was suggested to indicate a low to moderate inactivation of the OEC in these samples [111]. However, the interpretation of the K-band appearing in difference curve is not straightforward, as it can have different possible interpretations. Therefore, additional experimental data are necessary to obtain the final conclusion on the meaning of the K-band. Data obtained from thermoluminescence and fluorescence decay measurements show clearly that unlike heating, 72 h sulfur nutrient deprivation does not lead to the inhibition of OEC [110], but a K-band is observed; this K-band was assumed to originate from differences in antenna size and in the redox state of the PQ pool (see details below).
PSII heterogeneity. Another factor that can influence the O-J rise is the heterogeneity of PSII population [112, 113], which may be related to the PSII repair cycle (i.e. the in vivo continuous assembly/disassembly of PSII units that are irreversibly damaged [114, 115]).
The presence of at least two types of PSII units, PSIIα and PSIIβ, has been inferred from analysis of fluorescence transient in samples treated with DCMU [116-119]. The PSIIα centers (~70% of PSII units), which are thought to be dimeric supercomplexes [120] (i.e. two PSII core complexes sharing a common peripheral antenna), which are localized mostly in grana lamellae, have a higher antenna size than the PSIIβ centers, and are excitonically connected. On the other hand, the PSIIβ centers, which represent different stages in PSII maturation and repair cycle, are unconnected monomers located in stroma lamellae [121]. A method to analyze PSII antenna heterogeneity using PSII models is available, in which fluorescence transients in the presence of DCMU, measured at different light intensities, are fitted simultaneously with the assumption that two to four types of PSII, with different antenna sizes, contribute to the fluorescence signal [122].
Under sulfur deficiency (widely used to obtain hydrogen production in green algae) [123], or when oxygen is removed from the system, the heterogeneity of PSII population was shown to change considerably [109, 110]. Antal et al. [110] studied PSII heterogeneity in Chlamydomonas reinhardtii samples using the method described in two papers [116, 117], but without using fluorescence transients in the presence of DCMU; instead, they analyzed ChlF curves induced during a 700 μs pulse of strong actinic blue light (photosynthetic photon flux density (PPFD), 12,000 μmol photons·m–2·s–1), where QA is assumed to be reduced only once, as in samples treated with DCMU. The results of this analysis suggested that the observed changes in PSII heterogeneity in Chlamydomonas cells may involve: (1) a primary inactivation of PSIIβ as compared to PSIIα centers; and (2) an accumulation of PSIIα dimers in a semi-closed state (i.e. dimers with one PSII core closed). Further, the observed decline in sigmoidicity of the PSIIα component was attributed by Antal et al. [110] to a partial closure of PSUs in PSIIα dimers (see the earlier discussion about truncated sigmoidicity). In order to check the validity of these hypotheses, fluorescence data were simulated with a Monte-Carlo model in which only three components of the PSII electron transport were used: P680, Phe, and QA; the OEC, and the secondary donor YZ (i.e. the PSII donor side) were not explicitly included in the above model, these steps being replaced, for simplicity, by reduction of P680+ with a fixed rate constant [124]. In this model, excitation energy in a closed reaction center (P680*QA– state) could be deactivated through heat dissipation or fluorescence emission, or transferred into the neighboring center within a PSIIα dimer, if the latter was in the open state (P680QA) (Fig. 6). Simulations were performed considering different multi-particle systems consisting of only PSIIα (dimers), only PSIIβ (monomers), or both PSII types mixed in different proportions. The simulated O-J fluorescence curves showed good similarity to the experimental kinetics, indicating that the two proposed hypotheses (see above) could explain the much steeper initial fluorescence rise under sulfur or oxygen depletion conditions (see more on oxygen depletion in the next paragraph). Other stress-induced modifications, such as changes in antenna structure and composition, or of energy deactivation pathways in PSII, were also considered as possible mechanisms that may explain the observed changes in fluorescence parameters.
Fig. 6. Model of Antal et al. [110], which includes PSII heterogeneity and was used for simulation of the initial O-J phase of the Chl a fluorescence transient. Two types of PSII are: (1) PSIIα, a dimer of two subunits, PSU1 and PSU2; each PSU has reaction center core proteins D1 and D2, core antenna (CA), and a peripheral antenna – light-harvesting complex of PSII (LHC) (cf. Fig. 2); and (2) PSIIβ, a monomer made up of a single PSU. In this model, excitation energy (EE) can be exchanged only between the two subunits, PSU1 and PSU2, of a PSIIα dimer. The excitation energy flow from antenna to the reaction center, and the electron transport pathways were included in the simulation of the initial O-J fluorescence kinetics. Figure was redrawn from Antal et al. [110].
A fraction of PSIIβ centers (~10% of PSII population in normal samples [125, 126]) do not have the ability to oxidize QA– and reduce the PQ pool due to a non-functional QB-site; these are known as QB-nonreducing PSII [127, 128]. Models that take into account these inactive PSIIβ centers [79, 125, 129] predict that, under low light conditions, the accumulation of closed QB-nonreducing PSII units takes place during the initial part of the fluorescence rise. Under high light, the presence of QB-nonreducing centers was shown to increase the initial slope of the O-J rise and the J-level in simulated curves [130]. In a way, the presence of QB-nonreducing PSII units seems to induce changes in the OJIP wave that resembles those produced by a dark reduced PQ pool, but without an increase in the Fo level (see below).
The influence of the PQ pool dark reduction on the Fo and the J levels. Often a fraction of PSII units with reduced QA is present after a light–dark transition, so that the apparent initial fluorescence Fo is higher than the “true” Fo (i.e. when all active PSII units are open). This happens, for example, when the QB and/or the PQ pool are partially reduced in the dark, as this leads to the reduction of QA through the equilibrium established between QA/QA– and the PQ pool [131, 132]; see also a discussion on the relation between Fo and the redox state of the PQ pool in [133]. In many cases, a short (few seconds) preillumination of a sample with low far-red light can decrease a high apparent Fo through PSI driven oxidation of QA–; we note that this useful feature has been incorporated in some commercial fluorometers [99, 100].
In higher plants and algae, under certain circumstances, the PQ pool can become reduced rather than oxidized in the dark [134-136]; here the PQ pool is nonphotochemically reduced by stromal electron donors, through chlororespiration [137-142]. The absence of oxygen (anaerobiosis) is a well-known condition when the equilibrium in chlororespiration shifts toward PQ pool reduction [139]. Besides the increase of the apparent Fo, a time-dependent increase of the J-step was observed, which eventually becomes an O-J (=P) rise after prolonged treatment in darkness (an hour of anaerobiosis) [143, 144]. Toth et al. [105] have shown that the J-level in OJIP transients, measured under anaerobic conditions, is linearly related to the area above the J-I phase (3-30 ms), which parallels the reduction of the PQ pool (see below); further, they suggest that the J level depends on the availability of oxidized PQ molecules for the QB-site at the beginning of the fluorescence transient, and thus it is a good indicator of the redox state of the PQ pool in the dark. (We note that an in silico experiment with a PSII model [145], which consisted of simulation of two consecutive OJIP transients separated by a short dark period (during which the PQ pool is only partially re-oxidized), led to results that foresaw the conclusions of Toth et al. [105].)
In cyanobacteria, the respiratory and photosynthetic electron transport coexist in the thylakoid membrane and share the same PQ pool and other electron transport components of the intersystem chain (see [7] for a review on photosynthesis of cyanobacteria). This leads to a respiration-driven accumulation of plastoquinol in the dark. As a consequence of the presence of reduced PQ pool in the dark, higher Fo and J levels are often observed in cyanobacteria (see in Fig. 3 the ChlF transient measured in Synechococcus sp. PCC 7942 [146]). Finally, we mention that the reduction of the PQ pool can induce “state changes” in plants, algae, and cyanobacteria [61]; these will be discussed later, in relation to the slow PSMT wave.
The J-I-P Rise
The J-I-P phase of the fluorescence induction curve (rise time ~200 ms, under saturating light) is also called the “thermal” phase of the fast OJIP wave, since it was shown that it is more sensitive to temperature variations, disappearing at subfreezing temperatures, and is much less affected by changes in light intensity than the O-J phase [67] (Fig. 4b). As mentioned in the introduction, we have accepted in this review the conventional approach, where the fluorescence rise during this phase is due to a progressive reduction of QA.PQ pool oxido-reduction. The J-I-P rise is generally correlated with the reduction of the PQ pool (6-12 PQ molecules per PSII) by the PSII-driven electron transport (see reviews [23, 24]). However, mathematical simulations of the OJIP transient have clearly shown that models considering only PQ pool reduction by PSII are not able to describe correctly the thermal phase, because in this case the estimated rise time of the OJIP transient is clearly shorter than the experimental one [71, 72, 79, 145, 147-149]. Indeed, Munday and Govindjee [150] found that PSI activity influences the I-P rise, it being the cause of the dip (D) that is sometimes observed after the I step. Further, they suggested that the fluorescence rise from I to P is the result of a “traffic jam” (or bottleneck) of electrons at the acceptor end of PSI, due to transient dark inactivation of ferredoxin-NADP+-reductase (FNR) and of the Calvin–Benson cycle [151, 152]. Therefore, when the oxidation of the PQ pool by PSI via Cyt b6f was also considered in the models, the theoretical curve of the fast OJIP transient had considerably improved [59, 60, 73, 153-155]. Moreover, it was shown [59, 60] that models including electron transport reactions beyond PSII can be used to simulate absorbance changes at 820 nm (reflecting P700 redox kinetics [156]). Lazar [73] was able to simulate both the OJIP transient and the transmission changes at 820 nm, as measured in [151]: (1) in samples exposed to different light intensities; (2) in samples treated with methyl viologen (MV, a PSI electron acceptor); or with (3) dibromothymoquinone (DBMIB, an inhibitor of PQH2 reoxidation at the Cyt b6f level [157]).
The inflection point I and the subsequent plateau were shown to reflect a transient steady-state of the electron transport, when the reduction of the PQ pool by PSII and its oxidation by PSI via Cyt b6f are in balance [60, 74, 151, 158]. Theoretical results show that at the I step, the PSII centers are mainly in QA–QB– and QA–QB2– states, with a fraction of open PSII units still present that is gradually closed during the I-P phase, whereas at Fm, all active PSII units are closed [73, 154].
The I-P rise was highly retarded in intact chloroplasts treated with decyl-plastoquinone [159], which indicates that this phase is related to the accumulation of PQH2. However, while the PQ pool and the plastocyanin PC (1-4 PC/PSI [160, 161]) are mainly reduced during the J-I rise, the end acceptors of PSI (i.e. 5-7 ferredoxin Fd/PSI and its various acceptors, such as thioredoxin, nitrite reductase, and glutamic acid synthase) are reduced during the I-P rise [160]. Therefore, an increased I level will reflect a slower electron flow to the PSI acceptors [111]. A larger plateau (or a dip) after I will indicate an increased number of PSI end acceptors (often related to alternative electron transfer routes that act as electron sinks, such as the water–water cycle (WWC), Mehler-ascorbate peroxidase pathway, and cyclic electron flow around PSI (CEF-PSI); see Fig. 2). For information on alternative electron transfer routes, see several papers [162-169].
An activation of FNR (Ferredoxin NADP Reductase) can affect considerably the OJIP transient. For example, it was assumed that the two peaks, labeled as G and H, which were observed after the I step in Trebouxia-containing lichens, are due to FNR activation [170]. As mentioned earlier, this type of fast fluorescence transient was also observed in foraminifers [52] and zooxanthellae [171]. A different explanation for the G peak was given by Lazar [172]: based on his PSI fluorescence model, he has suggested that the G peak may be a manifestation of PSI variable fluorescence. In his opinion, this idea is also supported by experimental data showing that PSI can emit significant variable fluorescence under strong reducing conditions (e.g. in the presence of dithionite [173]).
The complementary area over the fluorescence induction curve was shown to be a convenient tool for calculating the number of electron acceptors available to PSII, relative to the concentration of QA [21, 92, 116, 117, 119, 174-176]. As already mentioned, experiments of Munday and Govindjee [150] showed that methyl viologen, an electron acceptor of PSI, abolishes the I-P phase, leading to the suggestion that the “P” level is due to a “traffic jam” of electrons beyond PSI. Since at the I step, electron acceptors at the end of PSI are mainly in the oxidized state [151], the complementary area over the I-P phase can be correlated with the number of these acceptors. In agreement with the role of PSI electron acceptors being reduced during the I-P phase, the I step is absent in ChlF transients measured in PSII membranes [177, 178] or after treatment of thylakoids with DBMIB [152]. On the other hand, the complementary area increase associated with the J-I rise was related to the number of oxidized PQ molecules available at the beginning of the fluorescence measurement [179].
Available data [132, 180] show that PQ pools of different sizes and diffusion rates are accessible to the PSII units. This type of functional PSII heterogeneity was studied by Hsu [181], who verified this hypothesis on fluorescence induction curves, measured at various light intensities and in presence of different concentrations of DCMU, a PSII inhibitor that functions by displacing “QB” from its binding pocket [182].
Transmembrane proton motive force (pmf). The regulation of photosynthetic electron transfer by transmembrane proton motive force (pmf, which is the sum of the membrane potential (ΔΨ) and the pH difference between the stroma and lumen; see Fig. 2) is well known [183, 184]. The existence of an electrogenic process coupled with redox reactions of the PQ pool predicts that a sufficiently large ΔΨ (positive inside) would slow the rate of plastoquinol oxidation, and consequently the electron transfer rate from PSII to PSI [185]. Moreover, an increase by ~10% of the initial fluorescence Fo, induced by a membrane potential of 100 mV, was observed in isolated chloroplasts; it was attributed to the electric field effect on the rate constants of the charge separation and recombination reactions [57], as defined in the reversible radical pair (RRP) model of Schatz et al. [56], which describes the PSII photochemistry (see the rate constants k1 and k–1 in the diagram of this model shown in Fig. 7).
Fig. 7. Diagram of the reversible radical pair (RRP) model for Photosystem II (PSII) photochemistry. In this model, it is assumed that all pigments associated with PSII in the light-harvesting complex (LHC), in the PSII Core complex, and the reaction center P680, form a single pool (LHC-Core-P680), and that the charge separation in PSII is reversible [56]. LHC represents the pigments in light-harvesting proteins; Core represents the pigments of the core reaction center complex of PSII; P680 is the PSII primary electron donor; Phe is pheophytin, the primary PSII electron acceptor; kF is the rate constant of radiative energy dissipation (fluorescence emission, delayed light emission) in the PSII antenna; kHD is the rate constant of nonradiative energy dissipation (internal conversion, quenching by triplet states or exogenous fluorescence quenchers, transfer to another PSII, or energy spillover to PSI) in the PSII antenna; k1 is the rate constant related to the intrinsic rate constant of charge separation; k–1 is the rate constant of radiative charge recombination that leads to re-excitation of the antenna and delayed light emission (DLE); k2 is the rate constant of charge stabilization through electron transfer to QA, a one-electron acceptor plastoquinone; kT is the rate constant of the decay of the radical pair through 3Chl generation; kd is the rate constant of the decay of the radical pair through nonradiative recombination to the ground state. We note that the rate constants k1, k–1, and kd have different values for open than for closed PSII centers. Modified from the original figure by Dau [57].
A PSII model has been developed by Rubin and coworkers [149, 154, 186-193], in which it is assumed that the electron transport rates at the steps directed normally to the membrane surface depend on ΔΨ. The dependence of the rate constants on transmembrane electric potential (ΔΨ) was calculated as (see [194]):
where k+ and k– are the forward and backward rate constants, respectively, at ΔΨ = 0; α is the fraction of ΔΨ that is generated by charge transfer across the membrane; δ is the fraction of α⋅ΔΨ that affects the rate constant of the forward reaction; F is the Faraday constant; R is the gas constant; and T is the absolute temperature. Further, ΔΨ changes are described by a simple exponential law [195]:
ΔΨ = ΔΨ0⋅exp(—t/τΨ),(6)
where ΔΨ0 and τΨ are the initial amplitude and the decay time of ΔΨ, respectively, and t is the time.
Belyaeva et al. [192] simulated the OJIP transient in pea leaves using an extended PSII model in which they took into account the dependence of electron transfer reactions on the lumenal pH (pHL), the stromal pH (pHS), and the ΔΨ. The changes in pHL(t), pHS(t), and ΔΨ(t) during illumination were approximated by sums of exponentials. The coefficients of these functions were evaluated by fitting with the PSII model the fluorescence curves measured at low (300 μmol photons·m–2·s–1) or high (1200 μmol photons·m–2·s–1) light, and in the presence of ionophores (that dissipate the membrane potential, ΔΨ = 0). The fitted values of these parameters were in good agreement with known data on the generation of ΔpH(t) and ΔΨ(t) across the thylakoid membrane in vivo (see Fig. 8).
Fig. 8. Simulation of “fast” Chl a fluorescence (ChlF) induction curves and build-up of transmembrane pH gradient and membrane potential (ΔΨ) using the PSII model of Belyaeva et al. [192]. Experimental fluorescence data on pea leaves (circles) were fitted here with this model. Measurements were made under both low and high light intensities (i.e. 300 and 1200 μmol photons·m–2·s–1) in untreated leaves, as well those treated with an ionophore (valinomycin). Transmembrane ΔpH was calculated as the difference between pHS and pHL, where, pHS is stromal, and pHL is the luminal pH, whereas ΔΨ (membrane potential) was calculated as the difference between ΔΨ(t) and ΔΨ0 (see text for details). a) Simulated curves, fitting data on untreated pea leaves; these had been calculated using an excitation rate constant kL of 600 s–1 (corresponding to 1200 μmol photons·m–2·s–1). b) Simulated curves fitting data on pea leaves treated with valinomycin, which were calculated with an excitation rate constant kL of 600 s–1 (corresponding to 1200 μmol photons·m–2·s–1); c) the same as in (b), but the simulated curves were calculated using kL of 150 s–1 (corresponding to 300 μmol photons·m–2·s–1). Redrawn from the original figure by Belyaeva et al. [192].
The maximum ΔΨ obtained with this model was ~90 mV, and ~40 mV in the stationary state at ΔpH ≈ 1.8. Based on results of these simulations [192], an increased level of nonradiative recombination losses at the reaction center (RC) level under high light compared to low light was obtained. In favor of this mechanism are studies showing that under long-term high light stress, rates of recombination reactions in PSII can be modified [196]. Also, light-induced membrane potential (ΔΨ) is expected, in some cases, to stimulate charge recombination [197]. A similar energy dissipation enhancement, at increased light intensity, had also been suggested by Belyaeva et al. [190, 191], who had used the same model as that of Belyaeva et al. [192] to simulate the fluorescence rise and decay induced by very short (ns) laser flashes. Chlorophyll (Chl) a fluorescence induction measured after a short (femtoseconds to microseconds) single turnover flash (STF) is often used in the study of ultrafast PSII reactions (e.g. excitation energy transfer, charge separation, and stabilization; see an early review by Govindjee and Jursinic [198]). After a STF, fluorescence maximum Fm(STF) is only 50-65% of Fm that was measured in continuous light. Also a significant delay in fluorescence rise is observed, which has been attributed to the time taken for the reduction of the quencher P680+ by YZ [77, 199], or to the photo-generation of a carotene triplet (3Car), which is also a quencher [200]. Results obtained by Belyaeva et al. [189-191] for simulation of ChlF transients after a ns STF are discussed in the Appendix in this paper.
The ChlF transient has been simulated with another model that includes reactions until the end electron acceptors of PSI [154]; here, the rates of reduction of PQ and of oxidation of PQH2 were modulated by using membrane potential (ΔΨ) calculated at each moment of the transient (the most important component of the pmf during the OJIP wave [183]). Results of these simulations predict a significantly large influence of ΔΨ on the fluorescence yield during the thermal phase, which affects the appearance and position of the inflection point I. These conclusions are supported by experiments showing that in the marine diatom Thalassiosira weissflogii the I step of the OJIP transient is missing (or is significantly reduced), but it reappears when ΔΨ is eliminated by treatment with valinomycin [201].
THE PSMT PHASE: SECONDS TO MINUTES
After Chl fluorescence reaches the P level at about 500 ms, it declines to the S level, followed by the slow (seconds to minutes) SMT wave. This second wave, and relatively slow fluorescence change, was first systematically studied in the laboratory of Govindjee [47, 48, 202-207]. The shape of this phase varies in different organisms, depending on their nature and history (Fig. 3) (see a review [15]). For example, in higher plants, the maximum M is often missing; further, an oversupply of CO2, or limitation in NADP+, and/or phosphate pools, leads to several SM oscillations, labeled as S1M1, and S2M2, due to processes that regulate the Calvin–Benson cycle [208, 209]. These Chl a fluorescence oscillations were shown to take place at the same time with oscillations in O2 evolution, CO2 uptake (Fig. 9), and transmembrane ΔpH, which, in general, appear as antiparallel and phase-shifted (to longer times) relative to Chl a fluorescence [14, 210]; see also discussion in [22].
Fig. 9. Oscillations in chlorophyll a fluorescence, CO2 uptake, and rate of O2 emission induced by abrupt re-illumination in a spinach leaf. Vertical bars indicate that anti-parallel fluorescence signal is shifted to shorter times compared to that for carbon uptake. Redrawn from the original figure by Walker and Sivak [210].
Only after the introduction of the PAM (Pulse Amplitude Modulation) fluorescence technique (see above), it was possible to obtain quantitative information on processes that are induced during the slow PSMT phase [211, 212]. It became evident that this phase is modulated not only by the redox state of QA (i.e. by photochemical quenching [213]), but also by short term (seconds to minutes) regulatory processes that are collectively known as nonphotochemical quenching (NPQ) of the excited state of Chl a; it decreases the fluorescence yield without productive energy storage (see reviews [61, 214-216]). These NPQ mechanisms, which provide short-term protection from excessive excitation to PSII, involve adjustments in light harvesting through deactivation of the first excited state of Chl a to the ground state, and are regulated by photosynthetic electron transport and ATP synthesis (with which they are indirectly correlated).
The following general expression at the PSII level can be written at a certain moment of the PSMT wave [61]:
kE[Chl a*]·(IABS/I0) = kF·[Chl a*] + kH·[Chl a*] + kP·[Chl a*] + kNPQ·[Chl a*], (7)
where I0 and IABS are the incident and absorbed light intensities per unit time; [Chl a*] is the concentration of the singlet excited state of Chl a; kE is the excitation rate constant; kH is the rate constant of spontaneous thermal dissipation (that is independent of the PSET); kF is the rate constant of fluorescence emission; kP is the rate constant of the photochemical use of the excitation energy for PSET; and kNPQ is the rate constant of the PSET-regulated thermal dissipation of the excitation energy.
Under certain conditions, only a redistribution of excitation energy between the two photosystems takes place in processes called “state changes”, which involve phosphorylation of LHCII proteins and extensive rearrangements of thylakoid membranes. Although the above-mentioned processes are considered NPQ type mechanisms, they are not “true” NPQ processes, since they can either increase or decrease the fluorescence yield, the dissipation of the thermal energy is not changed, and are followed by productive energy storage (i.e. photochemical, or ΔpH) [215].
Moreover, during the PSMT phase, the FNR and Calvin–Benson cycle are activated via the ferredoxin–thioredoxin system (when the pH of the stroma increases to ~8.8 [217]). The metabolic processes indirectly influence fluorescence quenching mechanisms by increasing ATP consumption (which reduces the ΔpH, and therefore also the part of NPQ sensitive to pH [217]). We note here that involvement of the photochemical quenching component qP during the S-M rise in plants is supported by studies showing simultaneous rise in the rates of O2 evolution [47, 48], or of CO2 uptake [208]; these parallel kinetics have been related to an increase in the rate of photochemistry and fluorescence, but significantly to a parallel decrease in the rate of Chl excitation energy dissipation through internal conversion [48]. In addition, in certain cyanobacteria, the S-M rise, which is quite prominent even in the presence of DCMU, is absent in a mutant that shows no state changes [218]; thus, a large component of S-M rise is suggested to be due to State 2 (low fluorescence) to State 1 (high fluorescence) transition. Similar results have been observed in Chlamydomonas reinhardtii [219]. Thus, any modeling of SMT wave must include the phenomenon of state change as one of its major explanations.
The NPQ level is usually measured using the PAM fluorescence technique in the saturation pulse (SP) mode (see above), by comparing the maximum fluorescence yield measured in a dark-adapted sample obtained after a saturating pulse (Fm), with the maximum fluorescence yield by the same pulse, when the sample is in strong continuous light (Fm′, the prime reflecting that the Fm is being measured when the sample has been in light). Here, the NPQ is activated by exposure to high light; the relaxation of Fm′ to Fm is measured after the continuous light is turned off (Fig. 10). The ratio (Fm – Fm′)/Fm′ is used to characterize the NPQ, and it increases when the quenching is induced in the light, and decreases when the quenching relaxes in the dark (see a discussion about the NPQ in [220]).
Fig. 10. Measurement of nonphotochemical quenching (NPQ) of chlorophyll excitation state using PAM (Pulse Amplitude Modulation) fluorometer in saturation pulse (SP) mode. After application of a saturating pulse on dark-adapted leaves of Arabidopsis plant (grown under 130 μmol photons·m–2·s–1), chlorophyll fluorescence rises from the minimum (Fo) to the maximum (Fm) level. Under continuous moderate actinic light (750 μmol photons·m–2·s–1), fluorescence decreases due to a combination of photochemical quenching (qP) and nonphotochemical quenching (NPQ) of the excited state of chlorophyll. The difference between Fm and the maximal fluorescence under actinic light after a saturating light pulse (Fm′) is a measure of NPQ (qE, qT, and qI, where qE is the energy-dependent NPQ, qT is the state change-dependent NPQ, and qI is photoinhibition-dependent NPQ; see text for details). Fm′ recovers in several minutes after the actinic light is switched off, reflecting the relaxation of the qE component of NPQ. Redrawn from the original figure by Muller et al. [221].
Several types of NPQ have been identified [221] involving different mechanisms, which can be also species dependent, as different strategies among photosynthetic organisms have evolved during evolution, leading to different solutions to the problem of adjustment of thermal energy dissipation [214]. Nonphotochemical quenching of excited state of chlorophyll is of several different types: energy-dependent (qE) (which includes the so-called qZ [222], as well as qL (lutein) and qD (diadinoxanthin)), state change-dependent (qT) [223], and photoinhibition-dependent (qI) [216], which differ in timescales of activation and relaxation. Generally, relative contributions of different NPQ mechanisms are strongly dependent on the light quality and intensity, and duration of light exposure. We note that qT is not necessarily a quenching process since it involves change in antenna size, and not necessarily a change in rate constant of any de-excitation pathway; the State 1 to State 2 transition (qT12) deprives the PSII RC of excitation, while the State 2 to State 1 transition (qT21) supplies extra excitation to PSII RC. Further, the nature of qI has many different causes [115, 224-230].
We discuss below correlations between different photosynthetic processes (e.g. primary reactions at the PSII RC level, linear electron flow (LEF), cyclic electron flow (CEF), alternative electron flows, various NPQ mechanisms, Calvin–Benson cycle, respiration or chlororespiration) and the two segments of fluorescence transient, P-S and S-M-T, of the PSMT wave, as well as theoretical results obtained by mathematical simulations based on different hypotheses.
The P-S Phase: Influence of qE, the High Energy NPQ Component
As seen in Fig. 3, chlorophyll fluorescence intensity shows a decline from the maximum P to a transient steady-state S. The principal causes attributed to the P-S decay include: (1) a gradual reoxidation of plastoquinol (PQH2) by PSI [150, 205, 207]; (2) induction of the qE component of NPQ, triggered by the energization of the thylakoid membrane (i.e. the build-up of pmf, particularly of ΔpH) [231-233]. Below, we will discuss mainly the influence of qE on the P-S decrease, as well as its simulation by several mathematical models available in the literature.
The high energy NPQ component (qE). The P-S phase of the fluorescence transient is usually correlated with energy-dependent quenching (qE), which appears within seconds, and is the most important NPQ component. The qE is triggered by the ΔpH build-up during photosynthetic electron transport [234, 235], and it leads ultimately to the dissipation of excess PSII excitation energy as heat through de-excitation of the first excited state of Chl a in PSII antenna; qE is reversible, within minutes, in darkness (see reviews [215, 236, 237]). Several photosynthetic processes have a strong indirect influence on qE: (1) PSET, which is affected by feedback regulation through reactions of PSII and PSI; (2) ATPase activity; and (3) ATP and NADPH consumption by the Calvin–Benson cycle. Also, in plants, grana stacking has been suggested to affect NPQ [238, 239].
Several types of qE mechanisms have evolved in different species [214], as e.g. LHCII-dependent NPQ mediated by the PsbS protein in higher plants [240], Light-Harvesting Complex Stress-Related (LHCSR) protein in green algae [241, 242] and LHCX6 protein in diatoms [243], as well as phycobilisome-dependent NPQ in cyanobacteria, which is mediated by an Orange Carotenoid Protein, OCP [244, 245] (Fig. 11).
Fig. 11. Models for nonphotochemical quenching (NPQ) of chlorophyll excitation states in cyanobacteria (left), in green alga Chlamydomonas reinhardtii (middle), and in higher plants (right). The model for phycobilisome (PBS)-dependent NPQ, in cyanobacteria, shows involvement of the orange carotene protein, OCP, which after activation with blue-green light changes from an orange to a red form [289, 290]. FRP is the Fluorescence Recovery Protein, which is involved in the detachment of the red OCP from the PBS and its conversion to the inactive orange form; the carotene molecule in the red OCP is 3′-hydroxychinenone, a carotenoid, which is noncovalently bound to the OCP, and induces a decrease in the fluorescence yield of PBSs (see text). The model for stress-induced light-harvesting complex protein (LHCSR)-dependent NPQ, in Chlamydomonas reinhardtii, shows a role for LHCBM1 (a LHC type protein) to act as an antenna-docking site for LHCSR [369]. Further, the model for PSBS-dependent NPQ in higher plants shows a rearrangement of the PSII supercomplex, where CP represents minor LHC proteins (CP29, CP26, and CP24). The carotene molecules in LHCSR, LHC, and LC are epoxy-xanthophylls in the limiting (low) light state (here, the photogenerated transmembrane ΔpH is low); the xanthophylls are in the deepoxidized state in the “flexible” NPQ state (i.e. when the photogenerated transmembrane ΔpH is high, and the photosynthetic organisms show flexibility by inducing diverse, species dependent, NPQ mechanisms). Redrawn from the original figure by Niyogi and Truong [214], and as presented by Papageorgiou et al. [368].
The qE quenching in plants and algae is associated with a decrease of Chl fluorescence lifetime from ~2.0 to ~0.3 ns [246], and by a change in absorption spectrum at 535 nm (ΔA535) [247], which is in the region of S0 → S2 absorption band of a carotenoid (used often to assess transmembrane ΔpH [248]). Moreover, qE was shown to induce structural changes in the thylakoid membrane, which have been attributed to conformational changes within PSII antenna [239, 249, 250].
During qE, a significant amount of excitation energy is suggested to be dissipated as heat, through processes triggered by ΔpH in PSII antenna complexes [251, 252], that, in higher plants, involve a PsbS protein [240] and xanthophyll cycle epoxides zeaxanthin (Z) and antheraxanthin (A) [253, 254]. Further, CP26 and CP29, minor PSII light-harvesting complexes, are also involved in qE [236, 255, 256]. However, since the xanthophyll cycle is activated in tens of seconds [257], it may contribute to fluorescence quenching later than in the P-S decay, as proposed by Nilkens et al. [222] who defined a separate zeaxanthin-dependent NPQ component, qZ (see above). However, the constitutive [Z+A], present in the thylakoid membrane after dark adaptation, was shown to participate in fluorescence quenching during the P-S decay [258].
Many aspects of qE are not yet understood, such as structural changes that create high-energy state of the membrane. One hypothesis is that the macro-rearrangement of the membrane may induce conformational change in specific proteins, which could affect interactions between pigments in antenna complexes and alter energy transfer dynamics [259]. The mechanism of quenching and its location are still a matter of debate, since both Chl–Car quenching [260, 261], and Chl–Chl quenching [262] have been proposed (see discussion in [215] and references therein). These hypotheses are, however, not mutually exclusive.
Quenching of excited state of Chl that involves dissipation processes at the PSII RC level (i.e. RC quenching through charge recombination) has also been proposed to take place during the P-S phase (see a review [263]). However, convincing evidence for the main part of qE to be antenna based phenomenon, not involving charge recombination processes, is the fact that Chl emission spectra at 77 K in leaves, measured during qE quenching, showed selective quenching in PSII light-harvesting complexes [264]. Finally, there are a number of studies suggesting that, during the P-S phase, the ΔpH induces formation, in the grana margins of PSI–PSII supercomplexes that allow “spillover” of excitation energy from short-wavelength absorbing PSII to the longer-wavelength absorbing PSI; the fluorescence yield is reduced in this case, since PSI fluorescence is much lower than that of PSII fluorescence [265]. However, the involvement of excitation spillover during the P-S decay has been considered improbable in at least two publications [231, 266].
Dependence of qE on ΔpH. Briantais et al. [231] found a linear relation between the P-S amplitude and the intrathylakoid proton concentration. The qE dependence on pH has been quantitatively studied [259, 267, 268], and found to follow a Hill type of relationship (an empirical equation originally derived from the oxygen-binding curve of human hemoglobin [269], which describes the fraction of a receptor saturated by a ligand as a function of ligand concentration, and takes into account the degree of cooperativity involved in the ligand binding to the receptor). For example, 9-AA (amino acridine) quenching acid titrations (used to measure pH) were fitted to a curve defined by the following Hill equation [259]:
qE = qEmax·pHn/(pHn + pH0n), (8)
where qEmax is the theoretical maximum qE; pH is the pH of the bulk medium; pH0 (pK) is the pH value at which qE = 0.5·qEmax; and n is the sigmoidicity parameter (the so-called Hill coefficient, which is related to the cooperativity of ligand binding). If n = 1, the model is reduced to the Michaelis–Menten equation, indicating a non-cooperative reaction; if n > 1, qE kinetics is sigmoidal, indicating an allosteric, or positive cooperative reaction; and if n < 1, qE increases asymptotically toward qEmax, indicating a negative cooperative reaction (see also a discussion on qE kinetics in [220]).
Models of qE based on antenna quenching. According to Bradbury and Baker [213], ChlF induction from the P level to the steady-state T level may be explained simply by an interplay between photochemical quenching qP (defined as the fraction of open PSII units at a certain moment of the fluorescence transient) and qE, at least at low light (~100 μmol photons·m–2·s–1) and a given metabolic state. This approach has been used in all the qE models that will be presented below, because possible fluorescence modulation through state changes (qT) and photoinhibition (qI) had been neglected in these studies. This implies that further research is needed where none of the known phenomenon that affects the P to T phase will be neglected.
Modeling qE in higher plants. Laisk et al. (1997) model. Laisk et al. [270], see also [59, 60], have simulated nonphotochemical quenching of excited state of Chl a induced by transmembrane pH gradient in higher plants, and studied interdependence between quantum yields of photochemical and nonphotochemical quenching. They modified their previous model of C3 photosynthesis [271, 272], in which the fluorescence yield was estimated by using a reversible radical pair (RRP) model of PSII RC reactions, and where processes related to the build-up of transmembrane ΔpH had already been incorporated. The processes contributing to the formation and the use of ΔpH in this model were: (1) water “splitting”; (2) reduction of PQ, followed by oxidation of PQH2 (as well as inclusion of an active “Q cycle” [273]); (3) ATP synthesis, assuming the consumption of 4H+/ATP formed; (4) proton leakage, proportional to the proton concentration difference between the lumen and the stroma; (5) pseudo-cyclic electron flow from the electron acceptor side of PSI (i.e. the Mehler-type reduction of O2 [163]); and (6) malate dehydrogenase-mediated shuttle of NADPH from the chloroplast to the cytosol [274]. In the model of Laisk et al. [270], protonation of PSII antenna quenching sites was assumed to trigger qE. Once activated, these quenching sites were assumed to induce conformational changes followed by an increase in the fraction of excitation energy dissipated as heat, at the expense of that emitted as fluorescence. The fraction of activated quencher sites was evaluated by considering fast protonation of the quenching sites, the activation being treated in a digital manner (yes/no). The rate constant of nonphotochemical quenching (kN′) was calculated, using Eq. (9); here, conformational changes, induced by protonation of the quenching sites in the antenna, were relatively slow compared to the protonation steps (see details in [270]):
dkN′/dt = RC50(QH·kNm′ − kN′), (9)
where RC50 is the rate constant of conformational change (assumed to be 0.03 s–1); QH (with values between 0 and 1) is a parameter related to the equilibrium of the allosteric proton sites with free protons in the lumen; and kNm′ is the maximum value of kN′.
Further, the rate constant of PSII electron transport (from the donor to the acceptor side) was calculated as a function of light intensity and losses due to qE quenching and fluorescence. Simulated (O)PSMT curves by Laisk et al. [59], obtained with a model that included a qE mechanism similar to that in [270], was quite similar to the experimental ChlF transients (curve 1 in Fig. 12).
Fig. 12. Simulated (O)PSMT fluorescence transients. Simulated Chl a fluorescence induction curves, in dark-adapted leaf illuminated with continuous actinic light, calculated by Laisk et al. [59] (curve 1), and by Zhu et al. [62] (curve 2). O (origin) is the first measured minimum fluorescence level; P is the peak; S stands for semi-steady state; M for a maximum; and T for a terminal steady state level. Redrawn after the original figures by Laisk et al. [59] and by Zhu et al. [62].
Moreover, results obtained in [270] suggest an approximate complementarity between the quantum yield of photochemical quenching (YP), and that of nonphotochemical quenching (YN), i.e. YP + YN ≈ 0.8, which implies a good balance between electron and proton pressures: a decrease in the quantum yield of photochemical quenching (YP) is accompanied by an increase in the quantum yield of energy dissipation (YN). On the other hand, as mentioned earlier, an increase in the quantum yield of energy dissipation (YN) is related to a decrease in Chl excitation lifetime [246]. Since shorter lifetimes of Chl singlet excited state implies a reduction in triplet Chl (3Chl*) formation [228], and, thus, production of reactive oxygen species and radicals (that induce photodamage of the photosynthetic apparatus [224]), Laisk and coworkers concluded that the complementarity between the photochemical and nonphotochemical quenching plays a photoprotective role.
Lambrev et al. [275] used a RRP model to evaluate the quantum yield of 3Chl generated at the PSII RC level in presence of different types of NPQ. They reached a similar conclusion as Laisk et al. [270], regarding photoprotection against 3Chl through NPQ of the excited state of Chl in the antenna: they have shown that NPQ at the antenna level shorten the average Chl excited-state lifetime and increase proportionally both the photoprotection and the fluorescence quenching factors. Moreover, they found that NPQ at the antenna level assures a higher protection against photodamage induced by 3Chl* than a reduction in antenna size.
Serodio and Lavaud (2011) model. Serodio and Lavaud [276] have presented a simpler model than that used by Laisk and coworkers to simulate qE quenching, based on its dependence on the xanthophyll cycle in plants and diatoms. The relationship between qE (labeled below as NPQ) and the irradiance E was described by a Hill equation:
NPQ(E) = NPQm·En/(E50n + En),(10)
where NPQ(E) is related to the fraction of violaxanthin (V) or diadinoxanthin (DD) molecules deepoxidized into zeaxanthin (Z) or diatoxanthin (DT), which are then “activated” by protonation; NPQm is the maximum NPQ value reached during illumination; E50 is the irradiance level at which NPQ attains a value of 50% of NPQm; and n is the sigmoidicity parameter of the curve (the Hill coefficient). Results obtained with this model were compared to NPQ versus E curves measured in Arabidopsis thaliana and in the diatom Nitzschia palea, in which two different types of xanthophyll cycles (violaxanthin–antheraxanthin–zeaxanthin and diadinoxanthin–diatoxanthin) exist. A systematic delay in the NPQ buildup, relative to the saturation of photochemistry, was observed in this study. Moreover, results obtained by Serodio and Lavaud suggest that in the organisms possessing a diadinoxanthin cycle, the same level of NPQ is induced at a lower irradiance than in those possessing a violaxanthin cycle.
Ebenhoh et al. (2011) model. Another simple model of the qE kinetics is by Ebenhoh et al. [277] (see Fig. 13). In this model, a quasi-steady-state approximation for the fast dynamics of PSII charge separation and oxygen evolution was assumed; this is based on the fact that the dynamics of qE quenching is slow (i.e. in seconds), and thus processes faster than these can be assumed to be in a stationary state.
Fig. 13. Diagram of Ebenhoh et al. [277] model. Light-harvesting complexes (LHC) absorb light, and the excitation energy is transferred to open PSII RCs (A1 state), leading to charge separation (A2 state); an active quencher (N) inhibits this process. The donor side of the RC is reduced by the oxygen-evolving complex (OEC), resulting in A3 state of PSII and release of protons in the lumen following water splitting. On the acceptor side of PSII, PQ is reduced to plastoquinol (PQH2), which, for protonation, receives protons from stroma. PQH2 is re-oxidized by Cyt b6f, which is not shown in the figure, and protons are released into the lumen. High proton concentration in the lumen activates a quencher (N0 → N), where N0 and N represent the inactive and active form of the quencher, respectively. The production of ATP from ADP and inorganic phosphate (Pi) is driven by the transmembrane proton gradient. ATP is consumed by external processes. State A3 can be excited, but the excitation energy is not used for charge separation, the non-quenched fraction of this excitation energy being emitted as fluorescence (wavy arrow). The stoichiometries of reactions are not shown. Redrawn from the original figure by Ebenhoh et al. [277].
Light harvesting in PSII, followed by excitation energy transfer, and charge separation were described by a single transition from the open RC (state A1) to the closed RC (state A2), which could be partially inhibited by a direct quencher (i.e. zeaxanthin). The quencher, which can have either an inactive (N0) or an active (N) form (with N0 + N = 1), was assumed to be activated following a pH-dependent Hill-type reaction of the form:
v6 = k6·(1 − N)·([H+]n/([H+]n + KQn)), (11)
where v6 is the activation rate of the quencher (dependent on the luminal pH); k6 is the maximum rate constant of quencher activation; [H+] is the proton concentration in the lumen; n is the sigmoidicity parameter (the Hill coefficient); and KQ is a constant at pH = 6. When fitted to the available experimental data, the above equation led to a Hill coefficient n of 5.3 [278]. (For the inactivation rate (v7), a simple mass action law was assumed.)
The calculated proton budget (i.e. the relative contribution of different processes to the build-up of the transmembrane pH gradient) in this model included (see Fig. 13): (1) water splitting by OEC, coupled to transition of PSII RC from state A2 to a third state A3; (2) redox reactions at the PQ level during electron transport; and (3) ATP synthesis (14 H+/3 ATP [279]) and consumption (in the Calvin–Benson cycle or other metabolic processes). As can be seen in Fig. 13, Cyt b6f complex, PSI, all the end acceptors of PSI, and Calvin–Benson cycle, were not included explicitly in this model; for simplicity, all these steps were replaced by a fixed rate constant (v4) of PQH2 oxidation. F, the fluorescence signal (0 ≤ F ≤ 1) was calculated taking into account the fraction of PSII RCs in the A3 state and the non-quenched fraction of the excitation emitted as fluorescence, i.e. equal to 1 − N (with N representing the fraction of excitation energy dissipated as heat). With this very simplified model of photosynthesis, Ebenhoh and coworkers were able to simulate chlorophyll fluorescence yield, and compare these results with the experimental data obtained in a typical PAM experiment for qE evaluation (Fig. 10). The simulation, of both the induction (in high light) and decay (in low light) of qE, matched qualitatively the experimental results. However, several discrepancies between the model and experimental data had to be attributed to excessive simplifications used in the model.
Zhu et al. (2012) model. Another model of complete photosynthesis, in which the qE quenching has been simulated, is by Zhu et al. [62]; it incorporates two of their earlier models, one for PSII light reactions [72], and another for dark reactions [280]. NPQ of the excited state of Chl a is assumed to be influenced by [Z+A], but only after protonation of acidic ligands in PSII antenna, under low luminal pH. A proton budget was calculated based on protons translocated during water oxidation, redox reaction at the PQ level, the Q-cycle at the Cyt b6f complex, cyclic electron flow around PSI, NADP+ reduction, and ATP synthesis (assuming 4.67 H+/ATP) [281]). Moreover, the ion transport (i.e. of Ca2+, Mg2+, and Cl–) across the thylakoid membrane, as well as the buffer capacities of stroma and lumen, were taken into account for the evaluation of ΔΨ. The rate of qE quenching was simulated using the equations described by Laisk et al. [269] (see above), and a pKa value of the putative antenna ligands of 4.5 [247]. The maximum rate constant for heat dissipation was assumed to be inversely related to a so-called Xstate, defined to equal [Z]/([V] + [Z] + [A]), where the sum ([V] + [Z] + [A]) was considered to remain constant during the OJIPSMT fluorescence transient [62]. The stability (and performance) of this model was checked by setting several experiments in silico, including the simulation of the OJIPSMT transient (see in Fig. 12 the PSMT phase simulated by Zhu et al.), as well as the fluorescence yield kinetics in a typical PAM experiment, used for the evaluation of qE.
Zaks et al. (2012) model. Zaks et al. [282] compared the qE kinetics in Arabidopsis thaliana leaves at both low (100 μmol photons·m–2·s–1), and high (1000 μmol photons·m–2·s–1) light intensities with curves simulated by a mathematical model that was inspired by state-space models of engineering control theory, and qE models published earlier (as those presented above). The equations of the model were of the form:
dX/dt = F(X; p) + G(I(t); p), (12)
where X is a vector that contains all the variables of the model; p is a vector that contains all the parameters of the model; and I is light intensity (the input). Sets of differential equations were grouped in eight separated modules labeled F1 through F8, corresponding to particular processes that describe the time-evolution of the X components: i.e. (1) light harvesting; (2) qE quenching; (3) electron transfer through the PQ pool; (4) PQH2 oxidation at the Cyt b6f complex; (5) electron transfer through plastocyanin (PC) and PSI to ferredoxin (Fd); (6) reduction of intermediates in the stroma by reduced Fd; (7) activation of the proton efflux via the ATP synthase; and (8) the proton and ion dynamics in the lumen and stroma. The Calvin–Benson cycle was, however, not considered in the model, the Fd being assumed to be rapidly reoxidized with a single rate constant.
The qE quenching was modulated by the fraction of activated quenching sites [Q] in PSII antenna, with the assumption that each site is activated by the presence of a deepoxidized xanthophyll [257] and an activated PsbS protein [240] (see Fig. 14a that shows a feedback loop governing the qE used in this model). Here, quenching was assumed to occur infinitely fast, so that the quenching sites always remain “open” (in contrast to the PSII RCs, which are closed when QA is reduced). On the other hand, the activation of the PsbS and the enzyme violaxanthin deepoxidase (VDE) was triggered by low lumen pH, but with different pKas and Hill coefficients (see Fig. 14b). A fixed concentration of zeaxanthin epoxidase, and a constant rate of zeaxanthin epoxidation, was assumed.
Fig. 14. Modeling the qE (i.e. the energy-dependent component of NPQ) in plants. a) Scheme of the feedback loop governing qE (solid frames), and the timescales of processes giving rise to qE (dashed frames). b: 1) Fitting parameters of individual reactions that contribute to the triggering of qE. The qE in plants is triggered by low lumen pH and involves protonation of the PsbS protein, of the enzyme V deepoxidase (VDE), and probably of other light-harvesting proteins [215]; the pKa and the Hill coefficient of each protonation step needs to be evaluated, and the interaction between quenching pigments and protonated proteins that leads to a qE state needs to be characterized, in order to fully understand the qE triggering; 2) fitting effective parameters of overall qE triggering. In absence of experimental data on individual reactions triggering qE, the relationship between qE and lumen pH is fitted phenomenologically to the overall data, and gives an effective pKa and Hill coefficient. Redrawn from the original figures by Zaks et al. [282].
Further, the above model also incorporated an effective PsbS dosage factor, FPsbS, which represents the fraction of the “potential” qE sites that are modulated by the PsbS protein [283], which was fixed at 0.6 for the Arabidopsis thaliana wild type (to fit experimental data). The fraction of quenching sites in the PSII antenna that are able to dissipate excitation energy by qE was calculated as:
[Q] = FPsbS·[PsbS]*·([Z] + [A]), (13)
where [PsbS]* is the fraction of PSII units with a protonated PsbS; [Z] and [A] are the fractions of zeaxanthin and antheraxanthin binding sites in PSII that contain zeaxanthin, and antheraxanthin, which perform qE.
The proton budget was determined, just as was done in other models described above, by taking into account the following processes: (1) water splitting at PSII; (2) proton pumping at Cyt b6f; (3) proton efflux through ATP synthesis; and (4) parsing of the pmf into separate ΔpH and ΔΨ components by ion movement across the thylakoid membrane (with ΔΨ decreasing over time [183, 284]). The CEF-PSI was implicitly considered in this model, its contribution to the proton budget being compensated by altering the necessary H+/ATP ratio of ATP synthase to 12 : 3, which gives a 3 : 2 ratio of ATP to NADPH production [285].
The difference in NPQ between the wild type and npq4 mutant of Arabidopsis thaliana was the experimental observable to which the model was fit in this study, since it could be used as a measure of the NPQ (of the excited state of chlorophyll) due only to the qE component. The simulated qE kinetics curve obtained with this model was in reasonable agreement with the experimental data. Finally, the results obtained with this model suggest that qE quenching does not affect the luminal pH in plants, even if the quenching is triggered by it, and therefore does not regulate the linear electron flow under steady state conditions.
Modeling qE in Chl a-containing cyanobacteria. Similar to eukaryotes, Chl a-containing cyanobacteria evolved photoprotective NPQ mechanisms in order to dissipate excess absorbed energy as heat, which involves an orange carotene protein (OCP) [245, 286-290]. The NPQ in cyanobacteria can be monitored using the usual PAM experiment, in which the modulated low-intensity measuring light used was at 650 nm (mostly absorbed by PBSs), and the fluorescence (emitted from both Chl and PBSs [291]) was detected at λ > 700 nm. In this case, a decrease in fluorescence levels could be the result of a decrease of either the PBSs emission, or the Chl-antenna emission, or caused by a decrease of the energy transfer from the PBS to PSII. Therefore, other types of measurements were made to resolve between these possible fluorescence changes [287].
The OCP acts as a blue-green (450-500 nm) light sensor. After its activation, the OCP changes from an orange to a red form. Further, besides its role as a photoreceptor, OCP also reduces the amount of energy transferred from the PBSs to PSII and PSI by a quenching process as described below. The quenching is triggered by 3′-hydroxyechinenone, a carotenoid, which is noncovalently bound to the OCP; it induces a decrease in the fluorescence yield of PBSs at 660-680 nm, simultaneously with a reduction of excitation energy transfer from PBSs to both the photosystems I and II (Fig. 11). This NPQ can take place even under conditions when the PQ pool is completely oxidized (and therefore is not due to a state change), as it was shown to be unaffected by DCMU treatment [244]. Another protein, the Fluorescence Recovery Protein (FRP), is involved in the detachment of the red OCP from the phycobilisome and its reversion to the inactive orange form, being essential in the recovery of the full antenna capacity under low light conditions after exposure to high irradiance (see reviews [289, 290]). Finally, it is important to note that the above-described NPQ mechanism is not universal in all cyanobacteria, as only the strains containing the OCP gene can perform a blue-light induced photoprotective mechanism [292].
Gorbunov et al. (2011) model. The only model of the NPQ kinetics in cyanobacteria to our knowledge is by Gorbunov et al. [293], based on measurements in Synechocystis sp. PCC 6803. In this model, the flux of excitation energy from phycobilisomes to PSII is assumed to decrease during NPQ induction. The experimental data showed that OCP in dark-adapted Synechocystis cells is not normally attached to the PBS, but it becomes attached to it (and forms quenching centers) only after it is activated by blue-green light (Fig. 11). These results led Gorbunov et al. to the idea that the formation of a quenched state in cyanobacteria is a multistep process involving both photoinduced and dark reactions.
This hypothesis was checked with a three-state kinetic model, in which the conversion of the OCP from its dark stable state (OCP0) to the quenched state (OCPq) takes place via an intermediate nonquenching state of OCP (OCPi). For simplicity, the transition of OCP0 to OCPi was assumed, on the short-term, to be irreversible. The rate of this light driven transition was considered to be proportional to the product of photon flux density (E) and effective absorption cross-section (σ), with σ (that depends on wavelength of actinic light, λ) given by the product of the optical absorption cross-section (σopt) of OCP and the quantum yield of the formation of quenching centers. Results of the analysis of the Gorbunov et al. model were in agreement with experiments. The maximum fluorescence yield in light (Fm′) was related to OCP as follows:
Fm′ = Fm·([OCP0] + [OCPi]) + FNPQ·[OCPNPQ], (14)
where Fm is the maximum fluorescence yield in dark-adapted state, and FNPQ is the fluorescence yield in the OCPNPQ state.
By fitting the model to experimental data, Gorbunov et al. [293] were able to evaluate different parameters of the system, such as the effective absorption cross-section of NPQ activation, or the rates, activation energy, and quantum yield for the formation of the quenched states (not discussed here).
Models of qE based on both antenna quenching and reaction center (RC) quenching. Although major focus in this field of research has been on NPQ mechanisms based on antenna quenching, alternative mechanisms based on dissipation of excess excitation at PSII RC level have historical precedence [294-302]; also see reviews [263, 303]. The PSII bipartite model of Kitajima and Butler [36] has often been used to classify NPQ either as antenna quenching type (i.e. through exciton deactivation in antenna complexes), or as RC quenching type (i.e. through increased P680* deactivation), since conforming to this model, the antenna quenching is associated with Fo quenching, while the RC quenching is not. However, this distinction does not hold true when the RRP model is used (Fig. 7; also see reference [57]).
An important condition for efficient dissipation of excess excitation energy within PSII RC is believed to be the presence, under steady state conditions, of a high fraction of reduced QA [304]. RC quenching mechanisms were suggested to play an important role in photoprotection during acclimation of higher plants, green algae, and cyanobacteria to low temperatures, or to high growth irradiance [305]. Several reactions are assumed to be involved in RC quenching that lead to dissipation of excess excitation (see Fig. 7; cf. Fig. 2); they are: (1) charge recombination of the primary PSII radical pair P680+Phe−, especially when the Oxygen Evolving Complex (OEC) is inactivated; (2) charge recombination between QA− (or QB−) and the S states of OEC [231, 294]; (3) direct nonradiative P680+QA− recombination [304]; (4) PSII cyclic electron flow: Cyt b559 → ChlZ → β-Car → P680+. Often, a particular RC quenching mechanism is favored by alterations in the free energy gap between different redox components implicated in the process (especially between QA and QB, or between P680+ and QA−), which may lead to an increase in the fraction of reduced QA under steady state conditions. We will not discuss here details of different RC quenching mechanisms.
Bukhov et al. (2001) model. Bukhov et al. [298] have presented a mathematical model, which involves two potential RC quenching mechanisms, as well as antenna quenching. Fluorescence data obtained in leaves of Spinacia oleracea and Arabidopsis thaliana, and in the moss Rhytidiadelphus squarrosus were used to test this model, which includes reactions at the PSII RC level. In contrast to the RRP model, the rate constant of the charge separation (P680*Phe → P680+Phe−) does not depend on the redox state of QA in this model. Instead, based on the idea of Klimov et al. [55, 306], the major part of the variable fluorescence (Fv = Fm – Fo) is considered to be ns DLE (delayed light emission) resulting from radiative recombination of the radical pair P680+Phe−. However, we note that this hypothesis contradicts time-resolved fluorescence studies in several laboratories [56, 85, 307-309]. Thus, Bukhov et al. model [298] has not been generally accepted (see discussion in [57]).
In contrast to the RRP model, however, the model of Bukhov et al. predicts differences in the relation between Fo quenching and Fv quenching, depending on whether the quenching originates from the antenna or the RC. These types of differences were, indeed, observed experimentally by Bukhov et al., and led them to conclude that: (1) antenna quenching is the predominant mechanism in the moss Rhytidiadelphus squarrosus, but (2) RC quenching is more significant in spinach and Arabidopsis. Moreover, both types of quenching were found to be activated by thylakoid protonation, but only the antenna quenching was strongly enhanced by zeaxanthin. Further research is needed to come to firm conclusions on this aspect.
The S-M-T Phase: Influence of State Changes, Calvin–Benson Cycle, and Photoinhibition
The S-M-T phase of the slow PSMT wave is quite complex, because many interconnected dynamic processes take place within this timescale. The Calvin–Benson cycle and several other correlated physiological processes are induced during this period, as well as other NPQ mechanisms besides qE (i.e. qZ, qT, and qI), which make the photosynthetic apparatus readjust its functions through different regulatory processes until a final steady-state is reached (at the T level).Influence of “State changes”. State changes (i.e. State 1 ↔ State 2) are short term regulatory mechanisms characteristic of all oxygenic photosynthetic organisms, which alter the balance of excitation energy distribution between the two photosystems under changing light regimes and/or metabolic needs, in order to optimize the photosynthetic yield [61, 223, 310-316]. State changes are accompanied by macro- and micro-structural changes in the thylakoid membranes [249].
State 1, as compared to State 2, has higher rates of PSII reaction, higher Chl fluorescence intensity at room temperature, and higher ratio of PSII emission (F685 and F696) to PSI emission (F720-F740) at 77 K (see reviews [61, 223]).
In higher plants and algae, state transitions take place through association/dissociation of mobile PSII antenna from PSII to PSI and then from PSI to PSII following their phosphorylation/dephosphorylation by a protein kinase/dephosphatase [317]; the activation of these enzymes is regulated by the redox state of plastoquinone [318]; further, it involves the binding of PQH2 to the Qp site of the cytochrome b6f complex (see Fig. 2) [319]. State transitions are usually assumed, especially in Chlamydomonas, to regulate the ratio of cyclic (CEF-PSI) to linear electron flow (LEF), and consequently, the ATP/ADP ratio in the cells [223]. However, the connection between state changes and the CEF-PSI is being questioned in some studies. The formation of CEF supercomplexes (i.e. PSI–LHCI–LHCII–FNR–Cyt b6f–PGRL1 [320, 321]) was thought to contribute to the enhancement of CEF-PSI rates in State 2, since they are more abundant in State 2 than in State 1 conditions. However, it was shown [322] that these changes have no direct correlation with state changes, the CEF-PSI being in fact regulated only by the redox power (i.e. the degree of PQ pool reduction).
Besides differences in antenna organization and its composition between plants and cyanobacteria, state transitions are assumed to be relatively similar in these organisms. State transitions in cyanobacteria are attributed to changes in the energetic coupling of the PBSs with PSI and PSII ([323], see reviews [324, 325]). This energetic coupling has been discussed in terms of two basic models, i.e. (1) “mobile PBS” (PBSs transfer excitation energy to PSII and PSI alternatively, through their movement along the thylakoid membranes [326-328]; and (2) “spillover of energy” (i.e. PBSs transfer excitation energy only to PSII units, which then transfer part of it to PSIs in a spillover manner; see references [310, 329]). Generally, PBS mobility is believed to be responsible for state transitions. This hypothesis is supported by experiments on cyanobacteria, using glycine betaine, in which state transitions induced by blue light (that lead to State 1) and orange light (that lead to State 2) were shown to depend on PBS mobility [330]. However, this is not entirely true, since redox-induced state changes (as State 1 → State 2 during a period of dark adaptation (see below), or State 2 → State 1 induced by blue light in the presence of DBMIB) were shown to depend on both PBS mobility and spillover [329].
As we mentioned earlier, in cyanobacteria there is a respiration-driven accumulation of plastoquinol in the dark. The presence of a highly reduced PQ pool will lead to a State 1 → State 2 change, and therefore cyanobacteria are frequently in State 2 after a dark adaptation period [331, 332]; this is in contrast to algae and most plants that normally are in State 1 after a dark adaptation period. In principle, both Fo and Fm (considering only Chl a contribution) should be lower in State 2 than in State 1. However, the presence of reduced PQ pool induces an increase in the measured Fo value in State 2, due to reduction of a fraction of QA molecules. Tsimilli-Michael et al. [146] used variable to initial fluorescence ratio (Fv/Fo) and the relative height of the J-level (VJ = (FJ – Fo)/(Fm – Fo)) as indicators of the plastoquinone redox poise and the state (1 or 2) of cyanobacteria in the dark. This type of analysis may also apply to higher plants and algae that undergo a State 1 → State 2 change in the dark due to reactions related to chlororespiration, as those reported by others [333-338]. Further, the higher M level, than that of the P level, often observed in cyanobacteria (Fig. 3) has been attributed to a subsequent State 2 → State 1 change taking place during the S to M rise [146, 218].
Gordienko and Karavaev (2003) model. Modeling state changes has many inherent difficulties, especially due to scarce quantitative information about processes that control them, and insufficient available data on fluorescence kinetics associated with them. One mathematical model simulating the impact of a State 1 → State 2 change on the slow fluorescence is by Gordienko and Karavaev [339]. This model does not include components beyond the electron acceptors of PSI, and also it does not include mechanisms related to NPQ of the excited state of Chl a. The state change was modeled simply as a redistribution of the excitation energy between PSII and PSI as a result of LHCII phosphorylation, which was dependent on the activity of a LHCII kinase. The activation of the LHCII kinase was assumed to depend on the degree of reduction of the intersystem electron transfer intermediates, and consisted in the formation of a LHCII kinase–LHCII complex. The simulations showed that fluorescence beyond the maximum fluorescence level P is quenched progressively, due to changes in excitation distribution between PSI and PSII.
However, the kinetics of the state transition was too rapid, the time for reaching the fluorescence steady-state being ~0.4-4 s. In our opinion, the ideas used by Gordienko and Karavaev to model the influence of state changes on ChlF induction are valuable, but they should be re-evaluated, preferably in the framework of a more complex model (e.g. one that may include qE and the Calvin–Benson cycle), which would facilitate a comparison with experimental data.
Influence of the Calvin–Benson cycle. The Calvin–Benson cycle connects the so-called light reactions with CO2 fixation (and other parts of carbon metabolism) (Fig. 2); it involves at least 11 enzymes acting on many intermediates in a complex network of reactions. Usually, the model that includes the Calvin–Benson cycle is of kinetic or stoichiometric type (see a review [340] and references therein), and often represents the core part in models of complete photosynthesis [59, 60, 62, 270, 341]. Such studies of photosynthesis have both fundamental and practical importance, since these models allow the investigation of different possibilities to drive or improve the biological systems in order to obtain higher photosynthesis rates, and, consequently higher biomass [342]. However, we do not discuss these aspects, but we focus on dynamic models that illustrate the influence of the Calvin–Benson cycle on the slow PSMT wave.
Models of Laisk et al. (2006, 2009) and Zhu et al. (2012). Simulated PSMT waves have been presented by Laisk et al. [59, 60] and Zhu et al. [342], with C3 photosynthesis models including light reactions, proton and electron transport, carbon metabolism, exchange of intermediates between cytosol and stroma, photorespiration, amino acid synthesis, and various regulatory mechanisms. The curves obtained with these models (Fig. 12) show a general resemblance with the experimental PSMT waves, with a relative fast fluorescence decrease from the maximum P to the transitory steady-state S (induced by qE quenching), followed by the S-M-T phase induced by the activation of the Calvin–Benson cycle; we note that, after the maximum M, the fluorescence decreases to the terminal steady-state T in curves simulated by Laisk et al., but remains constant in those simulated by Zhu et al. (Fig. 12).
Models of Chl a fluorescence oscillations induced by sudden external perturbations. As mentioned earlier, the OJIPSMT transient show under certain conditions several S-M oscillations. The study of this type of dynamic response of the photosynthetic apparatus is important, since it can provide valuable insight into the regulation mechanisms of photosynthesis.
Oscillations of photosynthesis, and their dependence upon irradiance, temperature, and oxygen concentration, were discovered in 1949 by Van der Veen [343, 344]. Later, it was shown that after a sudden transition from low light to high light, or a change in CO2 concentration, slow (~60 s) damped oscillations of Chl a fluorescence take place simultaneously with antiparallel oscillations in oxygen evolution and CO2 uptake [208, 210] (Fig. 9). Moreover, it was shown that photosynthesis oscillations are also accompanied by inverse oscillations in the ATP/ADP and NADPH/NADP ratios, and in other related metabolite pools (see a review [345]). Interestingly, microscopic studies of ChlF kinetics in intact leaves have revealed a very heterogeneous distribution of fluorescence oscillations among the individual cells [346, 347]. One important conclusion in the study of these oscillations is that the maximum rate of photosynthesis is not determined by maximum enzymic capacity, but is subject to control by a feedback mechanism.
Some of the proposed mechanisms for photosynthesis oscillations are: (1) an imbalance in the supply of ATP and NADPH to the Calvin–Benson cycle [348]; (2) an imbalance in fructose 2,6-bisphosphate control of sucrose synthesis and release of inorganic phosphate (Pi) [210]; (3) sugar transport between mesophyll cells [346]; (4) independent changes in ATP/ADP and in ΔpH [349]; and (5) changes in ΔΨ related to oscillating ion fluxes [350]. Different hypotheses were tested in a number of theoretical studies by using kinetic models [351-356], in which photosynthesis oscillations were modeled by introducing an arbitrary delay somewhere in the sequence of the biochemical events.
Oscillations in Chl a fluorescence were simulated with several models including photosynthetic electron transport, formation of ATP, and its subsequent use in the Calvin–Benson cycle [59, 60, 357-360]; see a discussion in [65]. Here we briefly comment only on a model developed by Laisk et al. [60], in which simulations of photosynthesis and fluorescence oscillations induced by a transition from limiting to saturating CO2 concentration are presented; these oscillations could not be reproduced by models that postulate a phase shift in the main carbon stream, as in e.g. [361]; it appeared to Laisk et al. [60] that the mechanism producing the oscillations is related to the pathway of alternative electron flow, which is characterized by rates ~50 times slower than the main electron and carbon fluxes. Based on this hypothesis, simulated curves were in much better agreement with the experimental ones than those obtained earlier [59].
CONCLUDING REMARKS
This review on the relation of Chl a transient to photosynthesis has emphasized the role of various mathematical models that have been used to understand different parts of chlorophyll fluorescence transient. A major point is that by fitting fluorescence curves with the models, we can now determine quantitatively several important parameters for different steps of the electron transport chain of photosynthesis [190-192]. To us, this is an important step forward as compared to the earlier qualitative description of the fluorescence induction curves.
Chlorophyll fluorescence transient, as obtained with saturating exciting light, includes two major phases: (1) the OJIP phase that is over within a second, where O is the “dark” fluorescence level, P is the peak, J and I are inflections [46, 69]; and (2) PSMT phase that lasts for minutes, where S is the semi-steady state, M is a maximum and T is terminal steady state [47, 48]. We have discussed in this review the influence of various photosynthetic processes on different segments of the entire fluorescence transient, emphasizing the necessity and importance of modeling and simulation in the analysis of different hypotheses emerging from experimental studies. Indeed, mathematical models are essential to understand the dynamic behavior of complex biological systems. Moreover, fitting of experimental data with appropriate models has led to the estimation of a number of parameters characterizing the photosynthetic apparatus, which is not, otherwise, possible.
We have reviewed here numerous simulation studies of the fast OJIP kinetics, which includes excitation connectivity among several PSII units; PSII heterogeneity, and influence of different factors as e.g. transmembrane pH gradient, membrane potential ΔΨ, heat stress, and various chemical reactants (also see reviews by [23, 24, 65, 154]). On the other hand, very few modeling studies on the PSMT wave are available, perhaps, because of the complexity of the phenomena that controls this phase. Since the processes influencing this segment of the chlorophyll fluorescence transient are numerous and strongly interrelated, mathematical simulation of this phase of fluorescence transient is imperative.
Although there has been an increased interest in quantitative studies based on mathematical modeling of the kinetics of several nonphotochemical quenching (NPQ) of the excited state of Chl a, further quantitative research is needed to evaluate the many suggested mechanisms that invoke different regulatory mechanisms (see various chapters in a forthcoming book [362]). Further, we note that quenching mechanisms at the reaction centers, which can fine-tune the entire process, have been often neglected in the available models simulating fluorescence induction kinetics; also, state transitions, which, under certain conditions, strongly influence fluorescence during the PSMT wave, have not yet been included in the available models. Moreover, it is also important to note that since NPQ processes are species dependent [214], it is necessary to establish specific models for each individual case, while for the moment, with few exceptions, only NPQ mechanisms taking place in higher plants have been modeled. In conclusion, construction of new models, including all photosynthetic processes influencing chlorophyll fluorescence, is necessary for a better understanding of the chlorophyll fluorescence transient in plants, algae, and cyanobacteria.
Our special gratitude goes to the late Gernot Renger for fruitful discussions and the opportunity to work with him over the many years. We are grateful to Eugene Maksimov for the photograph of leaves with which we are honoring Academician A. A. Krasnovsky at his 100th birth anniversary. We thank George C. Papageorgiou for reading this text and for making suggestions that have improved our text. We gratefully acknowledge contributions of many that made this review possible. A. S. thanks Reto J. Strasser in whose laboratory she began her research on modeling of chlorophyll a fluorescence. G. R. and A. R. thank the following (in alphabetical order) for their contributions to their research: A. M. Abaturova, T. K. Antal, N. E. Belyaeva, A. A. Bulychev, A. N. Dyakonova, I. B. Kovalenko, S. S. Khrushchev, T. E. Krendeleva, G. V. Lebedeva, A. V. Maslakov, V. Z. Pashchenko, T. Yu. Plusnina, and F.-J. Smitt. Govindjee thanks all his past collaborators on chlorophyll a fluorescence studies including the following (in alphabetical order): Fred Cho, Julian Eaton-Rye, Adam Gilmore, Ted Mar, Prasanna Mohanty, John C. Munday, George C. Papageorgiou, Alaka Srivastava, Sandra Stirbet, Reto Strasser, Daniel Wong, Chunhe Xu, and Xinguang Zhu.
The work of G. R. and A. R. was supported by the Russian Foundation for Basic Research grants (11-04-010019 and 11-04-01268) and FCP 14.512.11.0097. Govindjee is thankful, for constant support, to the most wonderful staff in the Office of Information Technology, Life Sciences, as well as in the Departments of Plant Biology and of Biochemistry, and in the Center of Biophysics & Quantitative Biology, at the University of Illinois at Urbana-Champaign. This review was completed while he was a Visiting Professor in the Department of Botany at Ravenshaw University, Cuttack, India.
APPENDIX
Simulation of Chl a fluorescence induction after a 10-ns laser flash by Belyaeva et al. [188-190]. Since the parameters that control photosynthesis and chlorophyll fluorescence are very complex and involve many steps, it is very difficult to obtain detailed information on them, especially under continuous light. To simplify the process, we have made measurements using flashing light for excitation of photosynthetic samples. This leads to simultaneous oxidation of all PS II reaction centers, and provides synchronization of electron transfer processes in all the photosystems contained in the sample. Thus, it was possible to obtain further new information on the various parameters of the system.
The late Gernot Renger and coworkers [363, 364] measured rise in chlorophyll fluorescence in leaves of Arabidopsis thaliana and in the green alga Chlorella pyrenoidosa starting at 100 ns after a 10 ns laser flash (λ = 532 nm), followed by its decay up to 10 s; these transients were analyzed with a model, in which Chl a fluorescence was assumed to be modulated by three quenchers: P680+, 3Car, and QA.
Several of these laser induced fluorescence transients from A. thaliana, and from C. pyrenoidosa, were simulated and fitted by Rubin and coworkers [189-191] by incorporating the “3-quencher” concept in a PSII model based on earlier models [149, 186, 365]. The PSII model involved 28 different redox states of PSII, and included a reversible radical pair (RRP) model for PSII photochemistry [56] (see Fig. 7 in the body of the paper). Electron transport rates of the steps directed normally to the membrane surface were assumed to be influenced by ΔΨ, the membrane potential (see the text of this review); however, the luminal and stromal pH values were assumed to be constant, since ΔpH formation was slow.
Experimental fluorescence data on A. thaliana, measured at different flash intensities, and the corresponding simulated data, presented by Belyaeva et al. [191] are shown in Fig. 15.
Fig. 15. Simulation and fitting of Chl a fluorescence rise and decay data from leaves of Arabidopsis thaliana. The PSII model used for simulation was that from Belyaeva et al. [191]. Illumination was with 10 ns laser flashes of different intensities. Chlorophyll a fluorescence kinetics induced in these experiments were measured from 100 ns to 10 s. The initial fluorescence Fo was measured with a low intensity measuring light, 50 μs before the flash. Experimental fluorescence data (circles), with laser flashes, were obtained at: 7.5·1015 photons/cm2 (dark blue), 6.2·1015 photons/cm2 flash (magenta), 3.0·1015 photons/cm2 flash (beige); and 5.4·1014 photons/cm2 flash (light green). The dotted magenta lines are traces of excitation rate constants kL(t) calculated using the equation kL(t) = kL-Max·exp(–t/τL) kL-Min, which were normalized to a coefficient of 10–7; here, kL-Max is the maximum photon density of the laser pulse, τL is the pulse duration, and kL-Min = 0.2 s−1 corresponds to photon density of the measuring light pulse. Numerical fits (lines) of fluorescence data, for the various flash intensities, were calculated using different maximum excitation rate constants kL-Max values: 7.2·109 s–1 (dark blue); 6.0·108 s–1 (red); 2.9·108 s–1 (brown); and 5.2·107 s–1 (green). Redrawn from the original figure by Belyaeva et al. [191].
In this study, an exponentially decaying function was used to simulate the actinic flash. At maximum STF intensity, P680 molecules are rapidly oxidized (to P680+) up to 95%, after which, in ~2 μs, they are reduced by Yz; the charge separation is subsequently stabilized by rapid electron transfer from Pheo− to QA. Quenching by 3Car was shown to play an important part during the first ~5 μs, decreasing to very low values after ~10 μs. The maximum fluorescence level was reached in about 50 μs after excitation. The fitting of fluorescence data with the PSII model also allowed evaluation of the rate constant of nonradiative recombination between P680+ and Phe– in closed PSII centers (i.e. with QA–); surprisingly, these simulations showed that the rate constant of this dissipative reaction increased from 3·108 to 8·108 s–1 when the flash intensity was increased from 5.4·1014 to 7.5·1016 photons·cm–2 per flash. Thus it is possible to evaluate rate constants of even those electron transfer steps, which cannot be determined experimentally.
REFERENCES
1.Croce, R., and van Amerongen, H. (2011) J.
Photochem. Photobiol. B, 104, 142-153.
2.Muh, F., Glockner, C., Hellmich, J., and Zouni, A.
(2012) Biochim. Biophys. Acta, 1817, 44-65.
3.Nelson, N., and Yocum, C. F. (2006) Annu. Rev.
Plant Biol., 57, 521-565.
4.Rabinowitch, E., and Govindjee (1969)
Photosynthesis, Wiley, N. Y.
5.Ke, B. (2001) Photosynthesis: Photobiochemistry
and Photobiophysics. Advances in Photosynthesis and Respiration
(Govindjee, series ed.) Vol. 10, Kluwer Academic, Dordrecht.
6.Blankenship, R. E. (2002) Molecular Mechanisms
of Photosynthesis, Blackwell Science, Oxford.
7.Shevela, D., Bjorn, L. O., and Govindjee (2013) in
Natural and Artificial Photosynthesis: Solar Power as an Energy
Source (Razeghifard, R., ed.) John Wiley and Sons, Hoboken, NJ, pp.
13-64 (in press).
8.Govindjee, Amesz, J., and Fork, D. C. (eds.) (1986)
Light Emission by Plants and Bacteria, Academic Press,
Orlando.
9.Papageorgiou, G. C., and Govindjee (eds.) (2004)
Chlorophyll a Fluorescence: A Signature of Photosynthesis. Advances
in Photosynthesis and Respiration (Govindjee and Sharkey, T. D.,
series eds.) Vol. 19, Springer, Dordrecht, The Netherlands.
10.Latimer, P., Bannister, T. T., and Rabinowitch,
E. (1956) Science, 124, 585-586.
11.Manodori, A., and Melis, A. (1986) Plant
Physiol., 82, 185-189.
12.Chow, W. S., Fan, D.-Y., Oguchi, R., Jia, H.,
Losciale, P., Park, Y.-I., He, J., Oquist, G., Shen, Y.-G., and
Anderson, J. M. (2012) Photosynth. Res., 113, 63-74.
13.Kautsky, H., and Hirsch, A. (1931)
Naturwissenschaften, 19, 964.
14.Govindjee and Papageorgiou, G. C. (1971)
Photophysiology, 6, 1-50.
15.Papageorgiou, G. C. (1975) in Bioenergetics of
Photosynthesis (Govindjee, ed.) Academic Press, New York, pp.
319-372.
16.Govindjee (1995) Aust. J. Plant Physiol.,
22, 131-160.
17.Klughammer, C., and Schreiber, U. (2008) PAM
Appl. Notes, 1, 27-35 (http://www.walz.com/).
18.Lazar, D. (1999) Biochim. Biophys. Acta,
1412, 1-28.
19.Lazar, D. (2006) Funct. Plant Biol.,
33, 9-30.
20.Strasser, R. J., Srivastava, A., and
Tsimilli-Michael, M. (2000) in Probing Photosynthesis:
Mechanism, Regulation and Adaptation (Yunus, M., Pathre, U.,
and Mohanty, P., eds.) Taylor and Francis, London, pp. 443-480.
21.Strasser, R. J., Tsimilli-Michael, M., and
Srivastava, A. (2004) in Chlorophyll a Fluorescence: a Signature of
Photosynthesis. Advances in Photosynthesis and Respiration
(Papageorgiou, G. C., and Govindjee, eds.) Vol. 19, Springer,
Dordrecht, pp. 321-362.
22.Papageorgiou, G. C., Tsimilli-Michael, M., and
Stamatakis, K. (2007) Photosynth. Res., 94, 275-290.
23.Stirbet, A., and Govindjee (2011) J.
Photochem. Photobiol. B, 104, 236-257.
24.Stirbet, A., and Govindjee (2012) Photosynth.
Res., 113, 15-61.
25.Schansker, G., Toth, S. Z., Kovacs, L.,
Holzwarth, A. R., and Garab, G. (2013) Photosynth. Res.,
doi:10.1007/s11120-013-9806-5.
26.Falkowski, P. G., and Raven, J. A. (2007)
Aquatic Photosynthesis, 2nd Edn., Princeton University Press,
Princeton, NJ.
27.Laisk, A., Nedbal, L., and Govindjee (eds.)
(2009) Photosynthesis in silico: Understanding Complexity from
Molecules to Ecosystems. Advances in Photosynthesis and Respiration
(Govindjee and Sharkey, T. D., series eds.) Vol. 29, Springer,
Dordrecht.
28.Eaton-Rye, J. J., Tripathy, B. C., and Sharkey,
T. D. (eds.) (2011) Photosynthesis: Plastid Biology, Energy
Conversion and Carbon Assimilation, Advances in Photosynthesis
and Respiration (Govindjee and Sharkey, T. D., series eds.) Vol.
34, Springer, Dordrecht.
29.Rottgers, R. (2007) Deep-Sea Res.,
54, 437-451.
30.Serodio, J., Ezequiel, J., Frommlet, J., Laviale,
M., and Lavaud, J. (2013) Plant Physiol., 163,
1089-1102.
31.Adams, W. W., III, and Demmig-Adams, B. (2004) in
Advances in Photosynthesis and Respiration (Papageorgiou, G. C.,
and Govindjee, eds.) Vol. 19, Springer, Berlin, pp. 583-604.
32.Logan, B. A., Adams, W. W., III, and
Demmig-Adams, B. (2007) Funct. Plant Biol., 34,
853-859.
33.Kalaji, H. M., Goltsev, V., Bosa, K.,
Allakhverdiev, S. I., Strasser, R. J., and Govindjee (2012)
Photosynth. Res., 114, 69-96.
34.Mar, T., Govindjee, Singhal, G. S., and Merkelo,
H. (1972) Biophys. J., 12, 797-808.
35.Briantais, J.-M., Merkelo, H., and Govindjee
(1972) Photosynthetica, 6, 133-141.
36.Kitajima, M., and Butler, W. L. (1975)
Biochim. Biophys. Acta, 408, 297-305.
37.Itoh, S., and Sugiura, K. (2004) in
Chlorophyll a Fluorescence: A Signature of Photosynthesis. Advances
in Photosynthesis and Respiration (Papageorgiou, G. C., and
Govindjee, eds.) Vol. 19, Springer, Dordrecht, pp. 231-250.
38.Franck, F., Juneau, P., and Popovic, R. (2002)
Biochim. Biophys. Acta, 162, 239-246.
39.Pfundel, E. (1998) Photosynth. Res.,
56, 185-195.
40.Gilmore, A. M., Itoh, S., and Govindjee (2000)
Philos. Trans. R. Soc. Lond. B, 335, 1-14.
41.Pfundel, E., Klughammer, C., Meister, A., and
Cerovic, Z. G. (2013) Photosynth. Res., 114, 189-206.
42.Tian, L., Dinc, E., and Croce, R. (2013)
Poster at 16th Int. Photosynthesis Congr., St. Louis, Mo, USA,
August.
43.Govindjee (2004) in Chlorophyll a
Fluorescence: a Signature of Photosynthesis. Advances in Photosynthesis
and Respiration (Papageorgiou, G. C., and Govindjee, eds.) Vol. 19,
Springer, Dordrecht, pp. 1-41.
44.Schreiber, U. (1986) Photosynth. Res.,
9, 261-272.
45.Strasser, R. J., and Govindjee (1991) in
Regulation of Chloroplast Biogenesis (Argyroudi-Akoyunoglou, J.
H., and Akoyunoglou, G., eds.) Plenum Press, New York, pp. 423-426.
46.Strasser, R. J., and Govindjee (1992) in
Research in Photosynthesis (Murata, N., ed.) Vol. 2, Kluwer
Academic Publishers, Dordrecht, pp. 29-32.
47.Papageorgiou, G. C., and Govindjee (1968)
Biophys. J., 8, 1299-1315.
48.Papageorgiou, G. C., and Govindjee (1968)
Biophys. J., 8, 1316-1328.
49.Sunil, B., Riazunnisa, K., Krishna, S. T.,
Schansker, G., Strasser, R. J., Raghavendra, S., and Mohanty, P. (2008)
Indian J. Biochem. Biophys., 45, 37-43.
50.Guisse, B., Srivastava, A., and Strasser, R. J.
(1995) Arch. Sci. Geneve, 48, 147-160.
51.Srivastava, A., Guisse, B., Greppin, H., and
Strasser, R. J. (1997) Biochim. Biophys. Acta, 1320,
95-106.
52.Tsimilli-Michael, M., Pecheux, M., and Strasser,
R. J. (1998) Arch. Sci. Geneve, 51, 205-240.
53.Duysens, L. M. N., and Sweers, H. E. (1963) in
Studies on Microalgae and Photosynthetic Bacteria, Japanese
Society of Plant Physiologists, University of Tokyo Press, Tokyo, pp.
353-372.
54.Van Gorkom, H. J., Pulles, M. P. J., and Etienne,
A.-L. (1978) in Photosynthetic Oxygen Evolution (Metzner, H.,
ed.) Academic Press, London, UK, pp. 135-145.
55.Klimov, V. V. (2003) Photosynth. Res.,
76, 247-253.
56.Schatz, G. H., Brock, H., and Holzwarth, A. R.
(1988) Biophys. J., 54, 397-405.
57.Dau, H. (1994) J. Photochem. Photobiol. B,
26, 3-27.
58.Samson, G., Prasil, O., and Yaakoubd, B. (1999)
Photosynthetica, 37, 163-182.
59.Laisk, A., Eichelmann, H., and Oja, V. (2006)
Photosynth. Res., 90, 45-66.
60.Laisk, A., Eichelmann H., and Oja, V. (2009) in
Photosynthesis in silico: Understanding Complexity from Molecules to
Ecosystems. Advances in Photosynthesis and Respiration (Laisk, A.,
Nedbal, L., and Govindjee, eds.) Vol. 29, Springer, Dordrecht, pp.
295-322.
61.Papageorgiou, G. C., and Govindjee (2011) J.
Photochem. Photobiol. B: Biol., 104, 258-270.
62.Zhu, X.-G., Wang, Y., Ort, D. R., and Long, S. P.
(2012) Publications from USDA-ARS/UNL Faculty, Paper 1137.
63.Antal, T. K., Kovalenko, I. B., Rubin, A. B., and
Tyystjarvi, E. (2013) Photosynth. Res., 117, 1-30.
64.Renger, G., and Schulze, A. (1985)
Photobiochem. Photobiophys., 9, 79-87.
65.Lazar, D., and Schansker, G. (2009) in
Photosynthesis in silico: Understanding Complexity from Molecules to
Ecosystems. Advances in Photosynthesis and Respiration (Laisk, A.,
Nedbal, L., and Govindjee, eds.) Vol. 29, Springer, Dordrecht, pp.
85-123.
66.Bannister, T. T., and Rice, G. (1968) Biochim.
Biophys. Acta, 162, 555-580.
67.Delosme, R. (1967) Biochim. Biophys. Acta,
143, 108-128.
68.Neubauer, C., and Schreiber, U. (1987) Zeit.
Naturforsch., 42c, 1246-1254.
69.Strasser, R. J., Srivastava, A., and Govindjee
(1995) Photochem. Photobiol., 61, 32-42.
70.Schansker, G., Toth, S. Z., Kovacs, L.,
Holzwarth, A. R., and Garab, G. (2011) Biochim. Biophys. Acta,
1807, 1032-1043.
71.Stirbet, A., Govindjee, Strasser, B. J., and
Strasser, R. J. (1998) J. Theor. Biol., 193, 131-151.
72.Zhu, X.-G., Govindjee, Baker, N. R., deSturler,
E., Ort, D. R., and Long, S. P. (2005) Planta, 223,
114-133.
73.Lazar, D. (2009) Photosynthetica,
47, 483-498.
74.Antal, T. K., and Rubin, A. B. (2008)
Photosynth. Res., 96, 217-226.
75.Makarov, S. S., Grachev, E. A., and Antal, T. K.
(2012) Math. Biol. Bioinform., 7, 508-528.
76.Okayama, S., and Butler, W. L. (1972) Biochim.
Biophys. Acta, 267, 523-527.
77.Shinkarev, V. P., and Govindjee (1993) Proc.
Natl. Acad. Sci. USA, 90, 7466-7469.
78.Schreiber, U., and Neubauer, C. (1990)
Photosynth. Res., 25, 279-293.
79.Lazar, D. (2003) J. Theor. Biol.,
220, 469-503.
80.Joliot, A., and Joliot, P. (1964) CR Acad.
Sci. Paris, 258, 4622-4625.
81.Stirbet, A. (2013) Photosynth. Res.,
116, 189-214.
82.Tsimilli-Michael, M., and Strasser, R. J. (2013)
Photosynth. Res., 117, 289-320.
83.Joliot, P., Bennoun, P., and Joliot, A. (1973)
Biochim. Biophys. Acta, 305, 317-328.
84.Paillotin, G. (1976) J. Theor. Biol.,
58, 237-252.
85.Lavergne, J., and Trissl, H.-W. (1995)
Biophys. J., 68, 2474-2492.
86.Laisk, A., and Oja, V. (2013) Photosynth.
Res., 117, 431-448.
87.Moya, I. (1974) Biochim. Biophys. Acta,
368, 214-227.
88.Lavorel, J., and Etienne, A.-L. (1977) in
Topics in Photosynthesis. Primary Processes of Photosynthesis
(Barber, J., ed.) Vol. 2, Elsevier/North-Holland Biomedical Press,
Amsterdam, pp. 203-268.
89.Holzwarth, A. R. (1987) in The Light
Reactions (Barber, J., ed.) Elsevier, Amsterdam, pp. 95-157.
90.Schmuk, G., and Moya, I. (1994) Remote Sens.
Environ., 47, 72-76.
91.Strasser, R. J. (1978) in Chloroplast
Development (Argyroudi-Akoyunoglou, J. H., and Akoyunoglou, G.,
eds.) Elsevier Biomedical, Amsterdam, pp. 513-538.
92.Strasser, R. J. (1981) in Proc. Fifth Int.
Congr. on Photosynthesis, Halkidiki, Greece, 1980 (Akoyunoglou, G.,
ed.) Vol. 3, Balaban International Science Services, Philadelphia, pp.
727-737.
93.Butler, W. L. (1980) Proc. Natl. Acad. Sci.
USA, 77, 4697-4701.
94.Koblizek, M., Kaftan, D., and Nedbal, L. (2001)
Photosynth. Res., 68, 141-152.
95.Yusuf, M. A., Kumar, D., Rajwanshi, R., Strasser,
R. J., Tsimilli-Michael, M., Govindjee, and Sarin, N. M. (2010)
Biochim. Biophys. Acta, 1797, 1428-1438.
96.Strasser, R. J., Tsimilli-Michael, M., and
Greppin, H. (1997) in Travelling Shot on Plant Development
(Penel, C., Simon, P., and Greppin, H., eds.) Rochat-Baumann, Geneva,
pp. 99-129.
97.Stirbet, A., and Strasser, R. J. (2001) in
Proc. 12th Int. Congr. on Photosynthesis, CSIRO Publishing,
Colingwood.
98.Strasser, R. J., and Stirbet, A. (2001) Math.
Comput. Simul., 56, 451-461.
99.Schreiber, U., Klughammer, C., and Kolbowski, J.
(2011) PAM Appl. Notes, 1, 1-21 (http://www.walz.com).
100.Schreiber, U., Klughammer, C., and Kolbowski,
J. (2012) Photosynth. Res., 113, 127-144.
101.Vredenberg, W. J. (2008) Photosynth.
Res., 96, 83-97.
102.Pospisil, P., and Tyystjarvi, E. (1999)
Photosynth. Res., 32, 55-66.
103.Oukarroum, A., Goltsev, V., and Strasser, R. J.
(2013) PLoS ONE, 8, e59433;
doi:10.1371/journal.pone.0059433.
104.Toth, S. Z., Schansker, G., and Strasser, R. J.
(2007) Photosynth. Res., 93, 193-203.
105.Toth, S. Z., Puthur, J. T., Nagy, V., and
Garab, G. (2009) Plant Physiol., 149, 1568-1578.
106.Toth, S. Z., Nagy, V., Puthur, J. T., Kovacs,
L., and Garab, G. (2011) Plant Physiol., 156,
382-392.
107.Strasser, B. J. (1997) Photosynth. Res.,
52, 147-155.
108.Antal, T. K., Volgusheva, A. A., Kukarskih, G.
P., Bulychev, A. A., Krendeleva, T. E., and Rubin, A. B. (2006)
Physiol. Plant., 128, 360-367.
109.Antal, T. K., Krendeleva, T. E., and Rubin, A.
B. (2007) Photosynth. Res., 94, 13-22.
110.Antal, T. K., Kolacheva, A., Maslakov, A.,
Riznichenko, G. Yu., Krendeleva, T. E., and Rubin, A. B. (2013)
Photosynth. Res., 114, 143-154.
111.Tsimilli-Michael, M., and Strasser, R. J.
(2008) in Mycorrhiza: State of the Art, Genetics and
Molecular Biology, Eco-Function, Biotechnology,
Eco-Physiology, Structure and Systematics (Varma, A., ed.)
3rd Edn., Springer, Dordrecht, pp. 679-703.
112.Govindjee (1990) Photosynth. Res.,
25, 151-160.
113.Lavergne, J., and Briantais, J.-M. (1996) in
Oxygenic Photosynthesis: the Light Reactions (Ort, D. R., and
Yocum, C. F., eds.) Kluwer Academic Publishers, Dordrecht, pp.
265-287.
114.Danielsson, R., Suorsa, M., Paakkarinen, V.,
Albertsson, P. A., Styring, S., Aro, E.-M., and Mamedov, F. (2006)
J. Biol. Chem., 281, 14241-14249.
115.Vass, I., and Aro, E.-M. (2008) in Primary
Processes of Photosynthesis: Basic Principles and Apparatus.
Comprehensive Series in Photochemical and Photobiological Sciences
(Renger, G., ed.) Vol. 8, Royal Society of Chemistry, Cambridge,
pp. 393-411.
116.Melis, A., and Homann, P. (1975) Photochem.
Photobiol., 21, 431-437.
117.Melis, A., and Homann, P. (1976) Photochem.
Photobiol., 23, 343-350.
118.Melis, A. (1978) FEBS Lett., 95,
202-206.
119.Melis, A., and Duysens, L. N. M. (1979)
Photochem. Photobiol., 29, 373-382.
120.Dekker, J. P., and Boekema, E. J. (2005)
Biochim. Biophys. Acta, 1706, 12-39.
121.Albertsson, P.-A., Andreasson, E., and
Svensson, P. (1990) FEBS Lett., 273, 36-40.
122.Lazar, D., Tomek, P., Ilik, P., and Naus, J.
(2001) Photosynth. Res., 68, 247-257.
123.Antal, T. K., Krendeleva, T. E., Pashchenko, V.
Z., Rubin, A. B., Stensjo, K., Tyystjarvi, E., Los, D. A., Carpentier,
R., Nishihara, H., and Allakhverdiev, S. (2012) in State of the Art
and Progress in Production of Biohydrogen (Azbarm, N., and Levin,
D., eds.) Bentham Science Publishers, Bussum, pp. 25-54.
124.Maslakov, A., Antal, T. K., and Riznichenko, G.
Yu. (2012) in Materials of the Conf. “Synergetics in Science.
8th Kurdyumov’s Reading” [in Russian], Tver, Tverskoi
SU, pp. 167-171.
125.Tomek, P., Ilik, P., Lazar, D., Stroch, M., and
Naus, J. (2003) Plant Sci., 164, 665-670.
126.Schansker, G., and Strasser, R. J. (2005)
Photosynth. Res., 84, 145-151.
127.Melis, A. (1985) Biochim. Biophys. Acta,
808, 334-342.
128.Graan T., and Ort, D. R. (1986) Biochim.
Biophys. Acta, 852, 320-330.
129.Hsu, B.-D. (1992) Plant Sci., 81,
169-174.
130.Strasser, R. J., and Stirbet, A. (1998)
Math. Comput. Simul., 48, 3-9.
131.Diner, B. (1977) Biochim. Biophys. Acta,
466, 247-258.
132.Joliot, P., Lavergne, J., and Beal, D. (1992)
Biochim. Biophys. Acta, 1101, 1-12.
133.Hohmann-Marriott, H. M., Takizawa, K.,
Eaton-Rye, J. J., Mets, L., and Minagawa, J. (2010) FEBS Lett.,
584, 1021-1026.
134.Groom, Q. J., Kramer, D. M., Crofts, A. R., and
Ort, D. R. (1993) Photosynth. Res., 36, 205-215.
135.Field, T. S., Nedbal, L., and Ort, D. R. (1998)
Plant Physiol., 116, 1209-1218.
136.Haldimann, P., and Tsimilli-Michael, M.
(2005) Biochim. Biophys. Acta, 1706, 239-249.
137.Bennoun, P. (1982) Proc. Natl. Acad. Sci.
USA, 79, 4352-4356.
138.Garab, G., Lajko, F., Mustardy, L., and Marton,
L. (1989) Planta, 179, 349-358.
139.Cournac, L., Josse, E. M., Joet, T., Rumeau,
D., Redding, K., Kuntz, M., and Peltier, G. (2000) Phil. Trans. R.
Soc. B, 355, 1447-1454.
140.Cournac, L., Latouche, G., Cerovic, Z.,
Redding, K., Ravenel, J., and Peltier, G. (2002) Plant
Physiol., 129, 1921-1928.
141.Peltier, G., and Cournac, L. (2002) Annu.
Rev. Plant Biol., 53, 523-550.
142.Houille-Vernes, L., Rappaport, F., Wollman,
F.-A., Alric, J., and Johnson, X. (2011) Proc. Natl. Acad.
Sci. USA, 108, 20820-20825.
143.Harris, G. C., and Heber, U. (1993) Plant
Physiol., 101, 1169-1173.
144.Haldimann, P., and Strasser, R. J. (1999)
Photosynth. Res., 62, 67-83.
145.Stirbet, A., and Strasser, J. R. (1995)
Arch. Sci. Geneve, 48, 41-60.
146.Tsimilli-Michael, M., Stamatakis, K., and
Papageorgiou, G. C. (2009) Photosynth. Res., 99,
243-255.
147.Stirbet, A., and Strasser, R. J. (1996)
Math. Comp. Sim., 42, 245-253.
148.Stirbet, A., Govindjee, Strasser, B. J., and
Strasser, R. J. (1995) in Photosynthesis: from Light to
Biosphere (Mathis, P., ed.) Vol. 2, Kluwer Academic Publishers,
Dordrecht, pp. 919-922.
149.Lebedeva, G. V., Belyaeva, N. E., Demin, O. V.,
Riznichenko, G. Y., and Rubin, A. B. (2002) Biophysics,
47, 968-980.
150.Munday, J. C., and Govindjee (1969) Biophys.
J., 9, 1-21.
151.Schansker, G., Toth, S. Z., and Strasser, R. J.
(2005) Biochim. Biophys. Acta, 1706, 250-261.
152.Schansker, G., Toth, S. Z., and Strasser, R. J.
(2006) Biochim. Biophys. Acta, 1757, 787-797.
153.Kroon, B. M. A., and Thoms, S. (2006) J.
Phycol., 42, 593-609.
154.Rubin, A. B., and Riznichenko, G. Yu. (2009) in
Photosynthesis in silico: Understanding Complexity from Molecules to
Ecosystems. Advances in Photosynthesis and Respiration (Laisk, A.,
Nedbal, L., and Govindjee, eds.) Vol. 29, Springer, Dordrecht, pp.
151-176.
155.Xin, C.-P., Yang, J., and Zhu, X.-G. (2013)
Photosynth. Res., 117, 339-354.
156.Harbinson, J., and Woodward, F. I. (1987)
Plant Cell Env., 10, 131-140.
157.Trebst, A., Hart, E., and Draber, W. (1970)
Z. Naturforsch., 25b, 1157-1159.
158.Joly, D., and Carpentier, R. (2007) J.
Photochem. Photobiol. B, 88, 43-50.
159.Joly, D., and Carpentier, R. (2009)
Photochem. Photobiol. Sci., 8, 167-173.
160.Bohme, H. (1978) Eur. J. Biochem.,
83, 137-141.
161.Schottler, M. A., Kirchhoff, H., and Weis, E.
(2004) Plant Physiol., 136, 4265-4274.
162.Asada, K., Schreiber, U., and Heber, U. (1993)
Plant Cell Physiol., 34, 39-50.
163.Asada, K. (1999) Annu. Rev. Plant Physiol.
Plant Mol. Biol., 50, 601-639.
164.Munekage, Y., Hojo, M., Meurer, J., Endo, T.,
Tasaka, M., and Shikanai, T. (2002) Cell, 110,
361-371.
165.Munekage, Y., Hashimoto, M., Miyake, C.,
Tomizawa, K.-I., Endo, T., Tasaka, M., and Shikanai, T. (2004)
Nature, 429, 579-582.
166.Cardol, P., Gloire, G., Havaux, M., Remacle,
C., Matagne, R., and Franck, F. (2003) Plant Physiol.,
133, 2010-2020.
167.Bukhov, N., and Carpentier, R. (2004)
Photosynth. Res., 82, 17-33.
168.Miyake, C. (2010) Plant Cell
Physiol., 51, 1951-1963.
169.Kramer, D. M., and Evans, J. R. (2011) Plant
Physiol., 155, 70-78.
170.Ilik, P., Schansker, G., Kotabova, E., Vaczi,
P., Strasser, R. J., and Bartak, M. (2006) Biochim. Biophys.
Acta, 1757, 12-20.
171.Hill, R., Larkum, A. W. D., Frankart, C., Kuhl,
M., and Ralph, P. J. (2004) Photosynth. Res., 82,
59-72.
172.Lazar, D. (2013) J. Theor. Biol.,
335, 249-264.
173.Ikegami, I. (1976) Biochim. Biophys.
Acta, 449, 245-258.
174.Malkin, S., and Kok, B. (1966) Biochim.
Biophys. Acta, 126, 413-432.
175.Murata, N., Nishimura, M., and Takamiya, A.
(1966) Biochim. Biophys. Acta, 120, 23-33.
176.Xu, C., Rogers, S. M. D., Goldstein, C.,
Widholm, J. M., and Govindjee (1989) Photosynth. Res.,
21, 93-106.
177.Pospisil, P., and Dau, H. (2000) Photosynth.
Res., 65, 41-52.
178.Heredia, P., and De Las Rivas, J. (2003) J.
Plant Physiol., 160, 1499-1506.
179.Toth, S. Z., Schansker, G., Garab, G., and
Strasser, R. J. (2007) Biochim. Biophys. Acta, 1767,
295-305.
180.Lavergne, J., Bouchaud, J.-P., and Joliot, P.
(1992) Biochim. Biophys. Acta, 1101, 13-22.
181.Hsu, B.-D. (1992) Biochim. Biophys.
Acta, 1140, 30-36.
182.Vermaas, W. F. J., Renger, G., and Dohnt, G.
(1984) Biochim. Biophys. Acta, 764, 194-202.
183.Avenson, T. J., Kanazawa, A., Cruz, J. A.,
Takizawa, K., Ettinger, W. E., and Kramer, D. M. (2005) Plant Cell
Env., 28, 97-109.
184.Foyer, C. H., Neukermans, J., Queval, G.,
Noctor, G., and Harbinson, J. (2012) J. Exp. Bot., 63,
1637-1661.
185.Graan, T., and Ort, D. R. (1983) J. Biol.
Chem., 258, 2831-2836.
186.Riznichenko, G. Yu., Lebedeva, G. V., Demin, O.
V., and Rubin, A. B. (1999) Kinetic J. Biol. Phys., 25,
177-192.
187.Lebedeva, G. V., Belyaeva, N. E., Riznichenko,
G. Yu., Rubin, A. B., and Demin, O. V. (2000) J. Phys. Chem.,
74, 1702-1710.
188.Belyaeva, N. E., Lebedeva, G. V., and
Riznichenko, G. Yu. (2003) in Mathematics Computer Education
(Riznichenko, G. Yu., ed.) [in Russian], Vol. 10, Progress-Traditsiya,
Moscow, pp. 263-276.
189.Belyaeva, N. E., Pashchenko, V.
Z., Renger, G., Riznichenko, G. Yu., and Rubin, A.
B. (2006) Biophysics, 51, 860-872.
190.Belyaeva, N. E., Schmitt, F.-J., Paschenko, V.
Z., Renger, G., Riznichenko, G. Yu., and Rubin, A. B. (2008)
Photosyn. Res., 98, 105-119.
191.Belyaeva, N. E., Schmitt, F.-J., Paschenko, V.
Z., Riznichenko, G. Y., Rubin, A. B., and Renger, G. (2011)
BioSystems, 103, 188-195.
192.Belyaeva, N. E., Bulychev, A. S., Riznichenko,
G. Yu., and Rubin, A. B. (2011) Biophysics, 56,
464-477.
193.Riznichenko, G. Y., Belyaeva, N. E., Kovalenko,
I. B., and Rubin, A. B. (2009) Biophysics, 54, 10-22.
194.Reynolds, J. A., Johnson, E. A., and Tanford,
C. (1985) Proc. Natl. Acad. Sci. USA, 82, 6869-6873.
195.Bulychev, A. A., and Vredenberg, W. J. (1999)
Physiol. Plant., 105, 577-584.
196.Vass, I., and Cser, K. (2009) Trends Plant
Sci., 14, 200-205.
197.Vos, M. H., and Van Gorkom, H. J. (1990)
Biophys. J., 58, 1547-1555.
198.Govindjee and Jursinic, P. (1979) Photochem.
Photobiol. Rev., 4, 125-205.
199.Butler, W. L. (1972) Proc. Natl. Acad. Sci.
USA, 69, 3420-3422.
200.Duysens, L. N. M., van der Schatte-Olivier, T.
E., and den Haan, G. A. (1972) in Progress in Photobiology
(Schenck, G. O., ed.) Proc. VI Int. Congr. on Photobiology,
Bochum, 1972, Abstract No. 277.
201.Antal, T. K., Osipov, V., Matorin, D. N., and
Rubin, A. B. (2011) J. Photochem. Photobiol. B, 102,
169-173.
202.Papageorgiou, G. C., and Govindjee (1967)
Biochim. Biophys. Acta, 131, 173-178.
203.Mohanty, P., Papageorgiou, G. C., and Govindjee
(1971) Photochem. Photobiol., 14, 667-682.
204.Mohanty, P., Braun, B. Z., and Govindjee (1973)
Biochim. Biophys. Acta, 292, 459-476.
205.Mohanty, P., and Govindjee (1973) Biochim.
Biophys. Acta, 305, 95-104.
206.Mohanty, P., and Govindjee (1973) Plant Cell
Physiol., 14, 611-629.
207.Mohanty, P., and Govindjee (1974) Plant
Biochem. J., 1, 78-106.
208.Walker, D. A., Sivak, M. N., Prinsley, R., and
Cheesbrough, J. K. (1983) Plant Physiol., 73,
542-549.
209.Govindjee and Satoh, K. (1986) in Light
Emission by Plants and Bacteria (Govindjee, Amesz, J., and Fork, D.
C., eds.) Academic Press, Orlando, pp. 497-537.
210.Walker, D. A., and Sivak, M. N. (1985) in
Regulation of Carbon Partitioning in Photosynthetic Tissue
(Heath, R. L., and Preiss, J., eds.) Proc. 8th Ann. Symp. in Plant
Physiology, 11-12 January 1985, University of California,
Riverside, American Society of Plant Physiology, Rockville, Maryland,
pp. 93-108.
211.Demmig-Adams, B., Adams, W. W., III, Barker, D.
H., Logan, B. A., Bowling, D. R., and Verhoeven, A. S. (1996)
Physiol. Plant., 98, 254-264.
212.Baker, N. R. (2008) Annu. Rev. Plant
Biol., 59, 89-113.
213.Bradbury, M., and Baker, N. R. (1984)
Biochim. Biophys. Acta, 765, 275-281.
214.Niyogi, K. K., and Truong, T. B. (2013)
Curr. Opin. Plant Biol., c16, 1-8.
215.Papageorgiou, G. C., and Govindjee (2014) in
Non-Photochemical Quenching and Energy Dissipation in Plants,
Algae and Cyanobacteria (Demmig-Adams, B., Garab, G., Adams, W. W.,
III, and Govindjee, eds.) Springer, Dordrecht (in press).
216.Adams, W. W., III, Muller, O., Cohu, C. M., and
Demmig-Adams, B. (2014) in Non-Photochemical Quenching and Energy
Dissipation in Plants, Algae and Cyanobacteria
(Demmig-Adams, B., Garab, G., Adams, W. W., III, and Govindjee, eds.)
Springer, Dordrecht (in press).
217.Kalituho, L., Beran, K. C., and Jahns, P.
(2007) Plant Physiol., 143, 1861-1870.
218.Kana, R., Kotabova, E., Komarek, O., Sediva,
B., Papageorgiou, G. C., Govindjee, and Prasil, O. (2012) Biochim.
Biophys. Acta, 1817, 1237-1247.
219.Kodru, S., Nellaepalli, S., Malavath, T.,
Devadasu, E., Subramanyam, R., and Govindjee (2013) Abstract of
Poster #146, 16th Int. Photosynthesis Congr., St. Louis, Mo, USA,
August.
220.Holzwarth, A. R., Lenk, D., and Jahns, P.
(2013) Biochim. Biophys. Acta, 1827, 786-792.
221.Muller, P., Li, X.-P., and Niyogi, K. K. (2001)
Plant Physiol., 125, 1558-1566.
222.Nilkens, M., Kress, E., Lambrev, P.,
Miloslavina, Y., Muller, M., Holzwarth, A. R., and Jahns, P. (2010)
Biochim. Biophys. Acta, 1797, 466-475.
223.Minagawa, J. (2011) Biochim. Biophys.
Acta, 1807, 897-905.
224.Matsubara, S., and Chow, W. S. (2004) Proc.
Natl. Acad. Sci. USA, 101, 18234-18239.
225.Apel, K., and Hirt, H. (2004) Annu. Rev.
Plant Biol., 55, 373-399.
226.Hakala, M., Tuominen, I., Keranen, M.,
Tyystjarvi, T., and Tyystjarvi, E. (2005) Biochim. Biophys.
Acta, 1706, 68-80.
227.Demmig-Adams, B., and Adams, W. W., III (2006)
New Phytol., 172, 11-21.
228.Vass, I. (2011) Physiol. Plant.,
142, 6-16.
229.Allahverdieva, Y., and Aro, E.-M. (2012) in
Photosynthesis: Plastid Biology, Energy Conversion and Carbon
Assimilation, Advances in Photosynthesis and Respiration
(Eaton-Rye, J. J., Tripathy, B. C., and Sharkey, T. D., eds.) Vol. 34,
Springer, Dordrecht, pp. 275-297.
230.Tyystjarvi, E. (2013) Int. Rev. Cell Mol.
Biol., 300, 243-303.
231.Briantais, J.-M., Vernotte, C., Picaud, M., and
Krause, G. H. (1979) Biochim. Biophys. Acta, 548,
128-138.
232.Krause, G. H., and Jahns, P. (2004) in
Chlorophyll Fluorescence: a Signature of Photosynthesis.
Advances in Photosynthesis and Respiration (Papageorgiou, G. C.,
and Govindjee, eds.) Vol. 19, Springer, Dordrecht, The Netherlands, pp.
463-495.
233.Barber, J. (2004) Photosynth. Res.,
80, 137-144.
234.Murata, N., and Sugahara, K. (1969) Biochim.
Biophys. Acta, 189, 182-192.
235.Wraight, C. A., and Crofts, A. R. (1970)
Eur. J. Biochem., 17, 319-327.
236.Ruban, A. V., Johnson, M. P., and Duffy, C. D.
P. (2012) Biochim. Biophys. Acta, 1817, 167-181.
237.Zaks, J., Amarnath, K., Sylak-Glassman, E. J.,
and Fleming, G. R. (2013) Photosynth. Res., 116,
389-409.
238.Goss, R., Oroszi, S., and Wilhelm, C. (2007)
Physiol. Plant., 131, 496-507.
239.Johnson, M. P., Perez-Bueno, M. L., Zia, A.,
Horton, P., and Ruban, A. V. (2009) Plant Physiol., 149,
1061-1075.
240.Li, X. P., Bjorkman, O., Shih, C., Grossman, A.
R., Rosenquist, M., Jansson, S., and Niyogi, K. K. (2000)
Nature, 403, 391-395.
241.Peers, G., Truong, T. B., Ostendorf, E., Busch,
A., Elrad, D., Grossman, A. R., Hippler, M., and Niyogi, K. K. (2009)
Nature, 462, 518-522.
242.Bonente, G., Ballottari, M., Truong, T. B.,
Morosinotto, T., Ahn, T. K., Fleming, G. R., Niyogi, K. K., and Bassi,
R. (2010) PLoS Biol., e1000577.
243.Zhu, S. H., and Green, B. R. (2010) Biochim.
Biophys. Acta, 1797, 1449-14457.
244.Wilson, A., Ajlani, G., Verbavatz, J.-M., Vass,
I., Kerfeld, C. A., and Kirilovsky, D. (2006) Plant Cell,
18, 992-107.
245.Kirilovsky, D., Kana, R., and Prasil, O. (2014)
in Non-Photochemical Quenching and Energy Dissipation in
Plants, Algae and Cyanobacteria (Demmig-Adams, B., Garab,
G., Adams, W. W., III., and Govindjee, eds.) Springer, Dordrecht (in
press).
246.Gilmore, A. M., Hazlett, T. L., and Govindjee
(1995) Proc. Natl. Acad. Sci. USA, 92, 2273-2277.
247.Gilmore, A. M. (1997) Physiol. Plant.,
99, 197-209.
248.Sivak, M. N., Heber, U., and Walker, D. A.
(1985) Planta, 163, 419-423.
249.Anderson, J. M., Chow, W. S., and De Las Rivas,
J. (2008) Photosynth. Res., 98, 575-587.
250.Johnson, M. P., Brain, A. P. R., and Ruban, A.
V. (2011) Plant Sign. Behav., 6, 1386-1390.
251.Mullineaux, C. W., Ruban, A. V., anad Horton,
P. (1994) Biochim. Biophys. Acta, 1185, 119-123.
252.Holzwarth, A. R., Miloslavina, Y., Nilkens, M.,
and Jahns, P. (2009) Chem. Phys. Lett., 483, 262-267.
253.Demmig-Adams, B., Adams, W. W., III, Heber, U.,
Neimanis, S., Winter, K., Kruger, A., Czygan, F.-C., Bilger, W., and
Bjorkman, O. (1990) Plant Physiol., 92, 293-301.
254.Jahns, P., Latowski, D., and Strzalka, K.
(2009) Biochim. Biophys. Acta, 1787, 3-14.
255.Bassi, R., Pineau, B., Dainese, P., and
Marquardt, J. (1993) Eur. J. Biochem., 212, 297-303.
256.Gilmore, A. M., Hazlett, T. L., Debrunner, P.
G., and Govindjee (1996) Photosynth. Res., 48,
171-187.
257.Niyogi, K. K., Grossman, A. R., and Bjorkman,
O. (1998) Plant Cell, 10, 1121-1134.
258.Holub, O., Seufferheld, M. J., Gohlke, C.,
Govindjee, Heiss, G. J., and Clegg, R. M. (2007) J. Microsc.,
225, 90-120.
259.Johnson, M. P., and Ruban, A. V. (2011) J.
Biol. Chem., 286, 19973-19981.
260.Ahn, T. K., Avenson, T. J., Ballottari, M.,
Cheng, Y. C., Niyogi, K. K., Bassi, R., and Fleming, G. R. (2008)
Science, 320, 794-797.
261.Duffy, C. D. P., Chmeliov, J., Macernis, M.,
Sulskus, J., Valkunas, L., and Ruban, A. V. (2013) J. Phys. Chem.
B, 117, 10974-10986.
262.Muller, M. G., Lambrev, P., Reus, M., Wientjes,
E., Croce, R., and Holzwarth, A. R. (2010) Chemphyschem.,
11, 1289-1296.
263.Huner, N. P. A., Ivanov, A. G., Sane, P. V.,
Pocock, T., Krol, M., Balseris, A., Rosso, D., Savitch, L. V., Hurry,
V. M., and Oquist, G. (2008) in Photoprotection,
Photoinhibition, Gene Regulation, and Environment
(Demmig-Adams, B., Adams, W. W., III, and Mattoo, A. K., eds.)
Springer, pp. 155-173.
264.Ruban, A. V., Young, A. J., and Horton, P.
(1993) Plant Physiol., 102, 741-750.
265.Tikkanen, M., Suorsa, M., Gollan, P. J., and
Aro, E.-M. (2012) FEBS Lett., 586, 2911-2916.
266.Malkin, S., Wong, D., Govindjee, and Merkelo,
H. (1980) Photobiochem. Photobiophys., 1, 83-89.
267.Takizawa, K., Cruz, J. A., Kanazawa, A., and
Kramer, D. M. (2007) Biochim. Biophys. Acta, 1767,
1233-1244.
268.Johnson, M. P., Zia, A., and Ruban, A. V.
(2012) Planta, 235, 193-204.
269.Hill, A. V. (1910) J. Physiol.,
40, iv-vii.
270.Laisk, A., Oja, V., Rasulov, B., Eichelmann,
H., and Sumberg, A. (1997) Plant Physiol., 115,
803-815.
271.Laisk, A., Eichelmann, H., Oja, V., Eatherall,
A., and Walker, D. A. (1989) Proc. R. Soc. Lond. B, 237,
389-415.
272.Laisk, A. (1993) Proc. R. Soc. Lond.
B, 251, 243-251.
273.Cramer, W. A., Yamashita, E., and Hasan, S. S.
(2013) in Encyclopedia of Biological Chemistry (Lane, M. D., and
Lennarz, W. J., eds.) 2nd Edn., Vol. 4, Academic Press, Waltham MA, pp.
167-171.
274.Usuda, H., Ku, M. S. B., and Edwards, G. E.
(1984) Plant Physiol., 76, 238-243.
275.Lambrev, P. H., Miloslavina, Y., Jahns, P., and
Holzwarth, A. R. (2012) Biochim. Biophys. Acta, 1817,
760-769.
276.Serodio, J., and Lavaud, J. (2011)
Photosynth. Res., 108, 61-76.
277.Ebenhoh, O., Houwaart, T., Lokstein, H.,
Schleded, S., and Tirok, K. (2011) Biosystems, 103,
196-204.
278.Pfundel, E., and Dilley, R. A. (1993) Plant
Physiol., 101, 65-71.
279.Seelert, H., Poetsch, A., Dencher, N. A.,
Engel, A., Stahlberg, H., and Muller, D. J. (2000) Nature,
405, 418-419.
280.Zhu, X.-G., De Sturler, E., and Long, S. P.
(2007) Plant Physiol., 145, 513-526.
281.Vollmar, M., Schilieper, D., Winn, M., and
Buechner, C. (2009) J. Biol. Chem., 284,
18228-18235.
282.Zaks, J., Amarnath, K., Kramer, D. M., Niyogi,
K. K., and Fleming, G. R. (2012) Proc. Natl. Acad. Sci. USA,
109, 15757-15762.
283.Li, X.-P., Muller-Moule, P., Gilmore, A. M.,
and Niyogi, K. K. (2002) Proc. Natl. Acad. Sci. USA, 99,
15222-15227.
284.Cruz, J. A., Sacksteder, C. A., Kanazawa, A.,
and Kramer, D. M. (2001) Biochemistry, 40, 1226-1237.
285.Kramer, D. M., Avenson, T. J., and Edwards, G.
E. (2004) Trends Plant Sci., 9, 349-357.
286.El-Bissati, K., Delphin, E., Murata, N.,
Etienne, A.-L., and Kirilovsky, D. (2000) Biochim. Biophys.
Acta, 1457, 229-242.
287.Kirilovsky, D. (2007) Photosynth. Res.,
93, 7-16.
288.Stadnichuk, I. N., Yanyushin, M. F.,
Zharmukhamedov, S. K., Maksimov, E. G., Muronets, E. M., and
Pashchenko, V. Z. (2011) Dokl. Biochem. Biophys., 439,
167-170.
289.Kirilovsky, D., and Kerfeld, C. A. (2012)
Biochim. Biophys. Acta, 1817, 158-166.
290.Kirilovsky, D., and Kerfeld, C. A. (2013)
Photochem. Photobiol. Sci., 12, 1135-1143.
291.Campbell, D., Hurry, V., Clarke, A.,
Gustafsson, P., and Oquist, G. (1998) Microbiol. Mol. Biol.
Rev., 6, 667-683.
292.Boulay, C., Abasova, L., Six, C., Vass, I., and
Kirilovsky, D. (2008) Biochim. Biophys. Acta, 1777,
1344-1354.
293.Gorbunov, M. Y., Kuzminov, F. I., Fadeev, V.
V., Kim, J. D., and Falkowski, P. G. (2011) Biochim. Biophys.
Acta, 1807, 1591-1599.
294.Weis, E., and Berry, J. A. (1987) Biochim.
Biophys. Acta, 894, 198-208.
295.Krause, G. H., and Weis, E. (1991) Ann. Rev.
Plant Physiol. Plant Mol. Biol., 42, 313-349.
296.Vass, I., Styring, S., Hundal, T., Koivuniemi,
A., Aro, E.-M., and Andersson, B. (1992) Proc. Natl. Acad. Sci.
USA, 89, 1408-1412.
297.Walters, R. G., and Horton, P. (1993)
Photosynth. Res., 36, 119-139.
298.Bukhov, N. G., Heber, U., Wiese, C., and
Shuvalov, V. A. (2001) Planta, 212, 749-758.
299.Ivanov, A. G., Sane, P. V., Zeinalov, Y.,
Malmberg, G., Gardestrom, P., Huner, N. P. A., and Oquist, G. (2001)
Planta, 213, 575-585.
300.Ivanov, A. G., Sane, P. V., Zeinalov, Y.,
Simidjiev, I., Huner, N. P. A., and Oquist, G. (2002) Planta,
215, 457-465.
301.Sane, P. V., Ivanov, A. G., Sveshnikov, D.,
Huner, N. P. A., and Oquist, G. (2002) J. Biol. Chem.,
277, 32739-32745.
302.Sane, P. V., Ivanov, A. G., Hurry, V. M.,
Huner, N. P. A., and Oquist, G. (2003) Plant Physiol.,
132, 2144-2151.
303.Ivanov, A. G., Hurry, V., Sane, P. V., Oquist,
G., and Huner, N. P. A. (2008) J. Plant Biol., 51,
85-96.
304.Oquist, G., and Huner, N. P. A. (2003) Annu.
Rev. Plant Biol., 54, 329-355.
305.Huner, N. P. A., Oquist, G., and Sarhan, F.
(1998) Trends Plant Sci., 3, 224-230.
306.Klimov, V. V., Klevanik, A. V., Shuvalov, V.
A., and Krasnovsky, A. A. (1977) FEBS Lett., 82,
183-186.
307.Holzwarth, A. R. (1991) in Chlorophylls
(Scheer, H., ed.) CRC Press, Boca Raton, pp. 1125-1151.
308.Dau, H., and Sauer, K. (1992) Biochim.
Biophys. Acta, 1102, 91-106.
309.Leibl, W., Breton, J., Deprez, J., and Trissl,
H.-W. (1989) Photosynth. Res., 22, 257-275.
310.Murata, N. (1969) Biochim. Biophys.
Acta, 172, 242-251.
311.Murata, N. (2009) Photosynth. Res.,
99, 155-160.
312.Bonaventura, C., and Myers, J. (1969)
Biochim. Biophys. Acta, 189, 366-383.
313.Allen, J. F. (1992) Biochim. Biophys.
Acta, 1098, 275-335.
314.Allen, J. F. (2003) Science, 299,
1530-1532.
315.Kargul, J., and Barber, J. (2008) FEBS
Lett., 275, 1056-1068.
316.Lemeille, S., and Rochaix, J. D. (2010)
Photosynth. Res., 106, 33-46.
317.Bennett, J., Steinback, K. E., and Arntzen, C.
J. (1980) Proc. Natl. Acad. Sci. USA, 77, 5253-5257.
318.Allen, J. F., Bennett, J., Steinback, K. E.,
and Arntzen, C. J. (1981) Nature, 291, 25-29.
319.Wollman, F.-A., and Lemaire, C. (1988)
Biochim. Biophys. Acta, 933, 85-94.
320.Iwai, M., Takizawa, K., Tokutsu, R., Okamuro
A., Takahashi, Y., and Minagawa, J. (2010) Nature, 464,
1210-1213.
321.Galka, P., Santabarbara, S., Khuong, T. T. H.,
Degand, H., Morsomme, P., Jennings, R. C., Boekema, E. J., and
Caffarri, S. (2012) Plant Cell, 24, 2963-2978.
322.Takahashi, H., Clowez, S., Wollman, F.-A.,
Vallon, O., and Rappaport, F. (2013) Nature Commun.,
DOI:10.1038/ncomms2954.
323.Mullineaux, C. W., Tobin, M. J., and Jones, G.
R. (1997) Nature, 390, 421-424.
324.Allen, J. F., and Mullineaux, C. W. (2004) in
Chlorophyll a Fluorescence: a Signature of Photosynthesis. Advances
in Photosynthesis and Respiration (Papageorgiou, G. C., and
Govindjee, eds.) Vol. 19, Springer, Dordrecht, pp. 447-461.
325.Papageorgiou, G. C., and Stamatakis, K. (2004)
in Chlorophyll a Fluorescence: a Signature of Photosynthesis.
Advances in Photosynthesis and Respiration (Papageorgiou, G. C.,
and Govindjee, eds.) Vol. 19, Springer, Dordrecht, pp. 663-678.
326.Allen, J. F., Sanders, C. E., and Holmes, N. G.
(1985) FEBS Lett., 193, 271-275.
327.Yang, S., Su, Z., Li, H., Feng, J., Xie, J.,
Xia, A., Gong, Y., and Zhao, J. (2007) Biochim. Biophys. Acta,
1767, 15-21.
328.Kana, R. (2013) Photosynth. Res.,
116, 465-479.
329.Li, D., Xie, J., Zhao, J., Xia, A., Li, D., and
Gong, Y. (2004) Biochim. Biophys. Acta, 1608,
114-121.
330.Murata, N., Mohanty, P. S., Hayashi, H., and
Papageorgiou, G. C. (1992) FEBS Lett., 296, 187-189.
331.Mullineaux, C. W., and Allen, J. F. (1986)
FEBS Lett., 205, 155-160.
332.Mao, H.-B., Li, G.-F., Ruan, X., Wu, Q.-Y.,
Gong, Y.-D., Zhang, X.-F., and Zhao, N.-M. (2002) FEBS Lett.,
519, 82-86.
333.Bulte, L., and Wollman, F. A. (1990)
Biochim. Biophys. Acta, 1016, 253-258.
334.Bulte, L., Gans, P., Rebeille, F., and Wollman,
F. A. (1990) Biochim. Biophys. Acta, 1020, 72-80.
335.Volgusheva, A. A., Zagidullin, V. E., Antal, T.
K., Korvatovsky, B. N., Krendeleva, T. E., Paschenko, V. Z., and Rubin,
A. B. (2007) Biochim. Biophys. Acta, 1767, 559-564.
336.Volgusheva, A. A., Kukarskikh, G. P., Antal, T.
K., Lavrukhina, O. G., Krendeleva, T. E., and Rubin, A. B. (2008)
Biofizika, 53, 787-796.
337.Nellaepalli, S., Mekala, N. R., Zsiros, O.,
Mohanty, P., and Subramanyam, R. (2011) Biochim. Biophys. Acta,
1807, 1177-1184.
338.Nellaepalli, S., Kodru, S., Tirupathi, M., and
Subramanyam, R. (2012) PLoS ONE, 7, e49839;
doi:10.1371/journal.pone.004983.
339.Gordienko, T. V., and Karavaev, V. A. (2003)
Biol. Bull., 30, 34-39.
340.Jablonsky, J., Bauwe, H., and Wolkenhauer, O.
(2011) BMC Sys. Biol., 5, 185.
341.Farquhar, G. D., von Caemmerer, S., and Berry,
J. A. (1980) Planta, 149, 78-90.
342.Zhu, X.-G., Long, S. P., and Ort, D. R. (2010)
Annu. Rev. Plant Biol., 61, 235-261.
343.Van der Veen, R. (1949) Physiol. Plant.,
2, 217-234.
344.Van der Veen, R. (1949) Physiol. Plant.,
2, 287-296.
345.Walker, D. A. (1992) Photosynth. Res.,
34, 387-395.
346.Siebke, K., and Weis, E. (1995) Photosynth.
Res., 45, 225-237.
347.Ferimazova, N., Kupper, H., Nedbal, L., and
Trtilek, M. (2002) Photochem. Photobiol., 76,
501-508.
348.Ogawa, T. (1982) Biochim. Biophys. Acta,
681, 103-109.
349.Fridlyand, L. E. (1998) J. Theor. Biol.,
193, 739-741.
350.Buschmann, P., and Gradmann, D. (1997) J.
Theor. Biol., 188, 323-332.
351.Laisk, A. (1977) Kinetics of Photosynthesis
and Photorespiration in C3 Plants [in Russian], Nauka, Moscow, p.
196.
352.Giersch, C. (1986) Arch. Biochem.
Biophys., 245, 263-270.
353.Laisk, A., and Walker, D. A. (1986) Proc. R.
Soc. Lond. B, 227, 281-302.
354.Laisk, A., Siebke, K., Gerst, U., Eichelmann,
H., Oja, V., and Heber, U. (1991) Planta, 185,
554-562.
355.Ryde-Pettersson, U. (1991) Eur. J.
Biochem., 198, 613-619.
356.Kukushkin, A. K. (1997) Biofizika,
42, 1224-1234.
357.Karavaev, V. A., and Kukushkin, A. K. (1993)
Biofizika, 38, 958-975.
358.Rovers, W., and Giersch, C. (1995)
Biosystems, 35, 63-73.
359.Khuznetsova, S. A., and Kukushkin, A. K. (1999)
Biofizika, 44, 448-454.
360.Lazar, D., Kana, R., Klinkovsky, T., and Naus,
J. (2005) Photosynthetica, 43, 13-27.
361.Giersch, C., Sivak, M. N., and Walker, D. A.
(1991) Proc. R. Soc. Lond. B, 245, 77-83.
362.Demmig-Adams, B., Garab, G., Adams, W. W., III,
and Govindjee (eds.) (2014) Non-Photochemical Quenching and Energy
Dissipation in Plants, Algae and Cyanobacteria, Springer,
Dordrecht (in press).
363.Steffen, R., Christen, G., and Renger, G.
(2001) Biochemistry, 40, 173-180.
364.Steffen, R., Eckert, H.-J., Kelly, A. A.,
Dormann, P., and Renger, G. (2005) Biochemistry, 44,
3123-3133.
365.Belyaeva, N. E. (2004) PhD thesis [in
Russian], Moscow.
366.Baniulis, D., Yamashita, E., Zhang, H., Hasan,
S. S., and Cramer, W. A. (2008) Photochem. Photobiol.,
84, 1349-1358.
367.Hasan, S. S., Yamashita, E., Baniulis, D., and
Cramer, W. A. (2013) Proc. Natl. Acad. Sci. USA, 110,
4297-4302.
368.Papageorgiou, G. C., Garcia-Mendoza, E.,
Matsubara, S., and Govindjee (2013) Paper presented at Int.
Conf. on “Photosynthesis Research for Sustainability, June
5-9, 2013 (for information on the conference, see Allakhverdiev, S. I.,
Huseynova, I. M., and Govindjee (2013) Photosynth. Res.,
118, 297-307).
369.Ferrante, P., Ballottari, M., Bonente, G.,
Giuliano, G., and Bassi, R. (2012) J. Biol. Chem., 287,
16276-16288.