Secretion of Adipocytes and Macrophages under Conditions of Inflammation and/or Insulin Resistance and Effect of Adipocytes on Preadipocytes under These Conditions
Yu-Tao Wei1,2,3, Dong-Sheng Xia3,4, Wen-Kai Yang3,5, Xian-Guo Wang3, Xin-Zhong Chen3*, and Nian-Guo Dong3
1Department of Thoracic and Cardiovascular Surgery, Second Hospital Affiliated with the Medical College of Shihezi University (Department of Thoracic and Cardiovascular Surgery, Hospital of Xingjian Production and Construction Corps), Wulumuqi 830002, Xinjiang, China2Department of Thoracic and Cardiovascular Surgery, First Hospital Affiliated with the Medical College of Shihezi University, Shihezi 832008, Xinjiang, China
3Department of Cardiovascular Surgery, Union Hospital, Tongji Medical College, Huazhong University of Science and Technology, Wuhan 430022, Hubei, China; E-mail: cxz1202065@163.com; wytgyh@163.com
4Department of Cardiovascular Surgery, Henan Provincial People’s Hospital, Zhengzhou 450000, Henan, China
5Department of Cardiac Surgery, Jiangxi Provincial People’s Hospital, Nanchang 330006, Jiangxi, China
* To whom correspondence should be addressed.
Received August 23, 2013; Revision received March 28, 2014
The purpose of the present study was to examine changes in preadipocytes following the coculture of preadipocytes and adipocytes and the effects on the secretion of adipocytes and macrophages following induction of inflammation and insulin resistance. Mature adipocytes and RAW264.7 macrophages were treated with lipopolysaccharide and insulin to establish models of inflammation and insulin resistance, respectively. The mRNA expression levels of IL-6, MCP-1, and TNF-α in all adipocyte treatment groups were significantly greater compared with the control, and that of adiponectin was less (P < 0.05). In the RAW264.7 macrophages, the mRNA expression levels of IL-6 and TNF-α were greater than those in the control group (P < 0.05). Moreover, the results of this study confirmed that adipocytes and macrophages increased the secretion of inflammatory factors under conditions of induced inflammation and insulin resistance. In addition, 3T3-L1 adipocytes inhibited the proliferation and differentiation of preadipocytes when cocultured with adipocytes under conditions of inflammation and/or insulin resistance, and the phenotype of preadipocytes did not change.
KEY WORDS: insulin resistance, adipocytes, preadipocytes, adipokinesDOI: 10.1134/S0006297914070086
Abbreviations: C/EBP, CCAAT-enhancer-binding protein; DAPI, 4′,6-diamidino-2-phenylindole; IBMX, 3-isobutyl-1-methylxanthine; IL-6, interleukin-6; IR, insulin resistance; MCP-1, monocyte chemotactic protein-1; MTT, methyl thiazolyl tetrazolium; PBS, phosphate-buffered saline; PID, post-induction day; PPARγ, peroxisome proliferator-activated receptor gamma; Pref-1, preadipocyte differentiation factor 1; RT-qPCR, real-time quantitative polymerase chain reaction; TNF-α, tumor necrosis factor-alpha.
Obesity, hyperlipidemia, hypertension, insulin resistance, diabetes, and
metabolic syndrome can cause chronic inflammation and metabolic
disarray, and all are risk factors of atherosclerosis [1-7]. In mammals, adipose tissue
(body fat) consists of two main types, brown and white. Brown fat
generates body heat in newborns and in hibernating animals, while the
principle purpose of white fat in healthy animals is energy storage.
White adipose can be further divided into subcutaneous adipose, which
is responsible for weight gain [8], while visceral
adipose tissue is the last of the energy reserves and secretes a
variety of hormones and cytokines such as tumor necrosis factor-alpha
(TNF-α), interleukin-6 (IL-6), monocyte chemotactic protein-1
(MCP-1), resistin, and adiponectin. For this reason, adipocytes have
recently become recognized as endocrine cells [9].
Under disease conditions such as obesity, atherosclerosis, insulin
resistance, diabetes, and others, adipocytes begin forming endocrine
disorders leading to endocrine, autocrine, and paracrine dysfunction
[10-12]. Inflammation and
metabolic disorders lead to the activation of endocrine hormones and
cytokine secretion, which can progress to a variety of metabolic
abnormalities and is closely related to the development of coronary
atherosclerosis [9, 13-19]. When coculturing macrophages and preadipocytes
from C57B6J mice, Charriere et al. found that preadipocytes are
transformed into macrophage precursors [20]. Given
all these described features, insulin resistance and a chronic
inflammatory state are risk factors for the development of coronary
heart disease. Thus, it is necessary to examine the changes in
preadipocytes following the coculture of preadipocytes and adipocytes
and its effects on the secretion of adipocytes and macrophages
following induction of inflammation and insulin resistance. In this
study, we used RAW264.7 macrophages and 3T3-L1 preadipocytes to explore
the possible pathogenesis of the development of coronary heart
disease.
MATERIALS AND METHODS
Experimental materials, essential drugs, and reagents. The murine preadipocyte (3T3-L1, GNM25) and macrophage (RAW264.7, TCM13) cell lines were purchased from the Shanghai Chinese Academy of Sciences Cell Bank. The cells were maintained in Dulbecco’s modified Eagle’s medium (DMEM) containing 10% fetal bovine serum (FBS), 100 μg/ml penicillin, and streptomycin at 37°C in a 5% CO2 saturated incubator. DMEM (12800017), FBS (10099141), and 0.25% trypsin (25200056) were purchased from Gibco (USA). Lipopolysaccharide (L2880), insulin (1342106), dexamethasone (D4902), 3-isobutyl-1-methylxanthine (IBMX, I7018), 4′,6-diamidino-2-phenylindole (DAPI, D9542), penicillin (P3032), streptomycin (S9137), and the dye oil red O (O1391) were from Sigma (USA); and mouse monoclonal antibodies (KP1) to CD68, ab955, F4/80 (rat monoclonal, ab6640), and Mac-1 (rat monoclonal, ab1211) were from Abcam (UK). The transwell chambers (3380) were purchased from Corning (USA), and the Trizol (10296010) and reverse transcriptase kits (12574018) were from Invitrogen (USA). The polymerase chain reaction (PCR) amplification reagents kit (Tap enzyme, 10× PCR buffer, MgCl2, and dNTP, RR037A) was purchased from Takara (Japan).
Recovery and culture with 3T3-L1 preadipocytes and RAW264.7 macrophage cells. The 3T3-L1 preadipocytes were seeded in 6-well plates at a density of 8000 cells/cm2 and cultured according to standard conditions. Briefly, the cells were grown in 5% CO2 in DMEM containing 10% FBS, 2 mM L-glutamine, and a 1% penicillin–streptomycin mixture. Two days after the cells reached confluency, the cells were induced to differentiate in high-glucose DMEM containing 10% FBS, 10 mg/liter insulin, 0.5 mM IBMX, and 1 μM dexamethasone for 2 days. Fresh medium containing only insulin was changed every 2 days. Post-induction at day (PID) 0 refers to preadipocytes prior to induction. When 90% of the adipocytes presented the phenotype following PID 8, all analyses were conducted. RAW264.7 macrophage cells were seeded onto 6-well plates at a density of 8000 cells/cm2 and cultured according to standard conditions.
Establishing inflammation and insulin resistance models in 3T3-L1 adipocytes. Prior to the assays, 3T3-L1 adipocytes were washed and maintained overnight in DMEM without FBS. Assays were conducted both under basal conditions and after stimulation with lipopolysaccharide (1 μg/ml, 18 h) [21] and/or insulin (1.7 μM, 18 h) [22] on differentiated cells. The concentrations and incubation times used were similar to those used in other experimental models [21, 22].
Cell treatment groups. Four treatment groups of 3T3-L1 adipocytes were created: A-1, the negative control (treated with an equivalent amount of phosphate-buffered saline, PBS); A-2, (insulin-resistance, treated with insulin, 1.7 μM, 18 h); A-3, inflammation (treated with lipopolysaccharide, 1 μg/ml, 18 h); and A-4, inflammation + insulin resistance (treated with lipopolysaccharide, 1 μg/ml, 18 h + insulin, 1.7 μM, 18 h). Four treatment groups of RAW264.7 macrophages were created using the same culture conditions and cell treatments as for the adipocytes as follows: B-1, negative control (treated with an equivalent amount of PBS); B-2, insulin-resistance; B-3, inflammation; B-4, inflammation + insulin resistance. Four treatment groups were also created with RAW264.7 macrophages and 3T3-L1 preadipocytes cocultured in transwell chambers. The RAW264.7 macrophages in the upper chamber and 3T3-L1 preadipocytes in the lower chamber were divided into C-1 to C-4 groups and were cultured for 48 h. The C-1 to C-4 groups in the lower chamber underwent routine testing and induction of differentiation. (Both RAW264.7 macrophages and 3T3-L1 preadipocytes were detected at the same order of magnitude.)
Real-time quantitative polymerase chain reaction (RT-qPCR) detection of gene expression. Total RNA was extracted from the RAW264.7 macrophages and 3T3-L1 preadipocytes stored in liquid nitrogen using TRIzol reagent (Invitrogen, USA) following the manufacturer’s instructions. Reverse transcription reactions were conducted using a Transcriptor First Strand cDNA Synthesis Kit (Roche, USA). The oligonucleotide primer sequences were designed by Premier Primer 5.0 software as shown in Table 1, and β-actin was used as the internal control. The synthesized first-strand cDNA samples were subjected to RT-qPCR with SYBR Green PCR Master Mix (Toyobo Bio-Technology, China), and PCR was performed using an ABI Prism 7700 Sequence Detector (Applied Biosystems, Japan). The abundance of each gene product was calculated using regression analyses against a standard curve generated by 2-fold serial dilutions of positive PCR controls for each gene. The adiponectin, TNF-α, IL-6, MCP-1, preadipocyte differentiation factor 1 (Pref-1), CCAAT-enhancer-binding protein (C/EBP) α, and PPAR-γ values were normalized against β-actin for each sample. The mRNA quantification was performed in triplicate for each well and in three wells for each experimental condition. The integrity of the PCR products was confirmed using dissociation curve analyses with 2.0 software (Applied Biosystems).
Table 1. Real-time quantitative RT-PCR
primers
Note: a) adiponectin; b) tumor necrosis factor-alpha; c) interleukin-6;
d) monocyte chemotactic factor 1; e) preadipocyte differentiation
factor 1; f) CCAAT enhancer binding protein alpha; g) peroxisome
proliferator-activated receptor gamma.
Methyl thiazolyl tetrazolium (MTT) assay for proliferation of cocultured 3T3-L1 preadipocytes. The C-1 to C-4 treatment groups were tested using an MTT assay. In a dark room, 20 μl of MTT solution was added to each well containing cells, the cells were incubated for 4 h, the supernatant was discarded, and then 150 μl of dimethyl sulfoxide was added to each well. The culture plate was then placed in a shaker and transferred to a microplate reader to measure the absorbance at 490 nm (Table 2).
Table 2. MTT assay for proliferation of
cocultured 3T3-L1 preadipocytes
Note: OD490 nm, optical density at 490 nm; OD490 nm: x̅ ± s;
*P < 0.05, #P < 0.01
Test for differentiation of cocultured 3T3-L1 preadipocytes. The culture medium was discarded from the culture plates, the cells were washed gently with PBS three times, then 4% paraformaldehyde was added, and the cells were incubated at room temperature for 1 h. Next, the fixative was discarded, 2 ml of oil red O solution was added, and the mixture was incubated at 37°C for approximately 2 h. (The oil red O solution was made by dissolving 0.42 g of oil red O in 120 ml of isopropanol, and the solution was allowed to stand overnight at room temperature before filtering off the undissolved dye. The filtrate was then collected, 90 ml of double-distilled water was added, the resultant mixture was filtered after standing overnight at 4°C to fully dissolve, and it was set aside for further testing.) Finally, the cells were observed under an inverted microscope (IX73, Olympus, Japan), showing cytoplasmic lipid droplets stained red. The 100% isopropanol extracts of the oil red O-stained cells were analyzed by a microplate reader (168-1130; Bio-Rad, USA) for absorbance at 490 nm (Table 3).
Table 3. Test for differentiation of
cocultured 3T3-L1 preadipocytes - oil red O staining
Note: OD490 nm, optical density at 490 nm; OD490 nm: x̅ ± s;
*P < 0.05, #P < 0.01
Immunofluorescence staining of cocultured 3T3-L1 preadipocytes. Adipose cells were added to the upper portion of a transwell chamber, while preadipocytes were added to the lower portion, and both were cultured for 24 h. The media were changed 12 h after the addition of 1 μg/ml DAPI. Then, the 3T3-L1 preadipocytes were washed once with PBS and fixed with 4% paraformaldehyde for 20 min at room temperature. The cells were rinsed with PBS at room temperature three times for 5 min each, and then placed at room temperature with PBS containing 10% FBS for 30 min. Next, the cells were warmed at 37°C for 30 min with the specific primary antibody in 0.1% Tween-20 in PBS at room temperature, and then the cells were rinsed three times for 5 min each. A DyLight488-conjugated goat anti-mouse IgG antibody (A23210 Abbkine, USA) [23] was added, and the cells were warmed at 37°C for 30 min. The cells were then placed in a solution containing 0.1% Tween-20 in PBS at room temperature and again rinsed three times for 5 min each. Finally, the cells were observed under a fluorescence microscope (IX83; Olympus, Japan) with the appropriate excitation band, and photos were recorded.
Statistical analyses. Data are presented as means ± standard deviation for each experimental condition. Differences between groups were evaluated using a non-independent t-test and analysis of variance. A P value < 0.05 was used to determine statistical significance. All statistical analyses were performed using the SPSS12.0 statistical package.
RESULTS
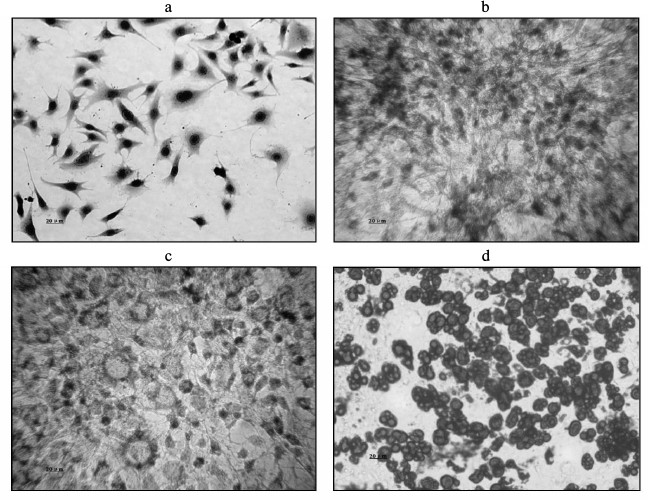
Morphological changes during 3T3-L1 preadipocyte differentiation. 3T3-L1 preadipocytes presented a typical spindle shape, and no lipid droplets were present in the cytoplasm. Their morphology was similar to that of fibroblasts (Fig. 1a, trypan blue staining). Oil red O staining showed the induction of differentiation within PID 2 as small cytoplasmic lipid droplets appeared (Fig. 1b). On PID 4, the cells became large compared with the previously round shape, and the size of the cytoplasmic lipid droplets began to increase (Fig. 1c). By PID 8, they had become large round cells, with an even greater increase in the accumulation of cytoplasmic lipid droplets (Fig. 1d).
Fig. 1. Comparison of morphological changes during 3T3-L1 preadipocyte cell differentiation. a) Cell morphology before differentiation (Trypan blue staining). b) Induction of differentiation after 2 days, showing lipid droplets generated in the cytoplasm (oil red O staining). c) Induction of differentiation at 4 days, showing an increase in lipid droplets compared with the cytoplasm (oil red O staining). d) Induction of differentiation at 8 days, showing a large number of lipid droplets in the cytoplasm (oil red O staining).
3T3-L1 adipocyte RT-qPCR. Compared with the A-1 control group, IL-6, MCP-1, and TNF-α mRNA expression levels of the other groups were significantly greater (P < 0.05), and adiponectin mRNA was less (P < 0.05). The greatest difference in the mRNA levels of adiponectin, IL-6, MCP-1, and TNF-α was between the A-4 inflammation + insulin resistance group and the A-1 control group (P < 0.01) (Fig. 2).
Fig. 2. Results of 3T3-L1 adipocyte RT-qPCR (groups A-1, A-2, A-3, and A-4; * P < 0.05, # P < 0.01). A-1, PBS control; A-2, insulin resistance; A-3, inflammation; A-4, inflammation + insulin resistance. Compared with the A-1 control group, IL-6, MCP-1, and TNF-α mRNA expression levels of the other groups were significantly increased (P < 0.05), and adiponectin mRNA decreased (P < 0.05). In the A-4 inflammation + insulin resistance group, expression levels of adiponectin, IL-6, MCP-1, and TNF-α mRNA were significantly changed (P < 0.01).
RAW264.7 macrophage RT-qPCR. In the B-2, B-3, and B-4 RAW264.7 macrophage groups, treatment with lipopolysaccharide and high insulin led to increased mRNA levels of IL-6 and TNF-α (P < 0.05). These changes were especially significant in the B-4 insulin resistance + inflammation group (P < 0.01), indicating that under conditions of inflammation, insulin resistance promotes RAW264.7 macrophages to secrete more inflammatory cytokines (Fig. 3).
Fig. 3. Results of RAW264.7 macrophage RT-qPCR (groups B-1, B-2, B-3, and B-4; * P < 0.05, # P < 0.01). B-1, PBS control; B-2, insulin resistance; B-3, inflammation; B-4, inflammation + insulin resistance. The B-2, B-3, and B-4 RAW264.7 macrophage groups in the presence of lipopolysaccharide and high insulin led to enhanced mRNA expressions of IL-6 and TNF-α (P < 0.05). In the B-4 insulin resistance + inflammation group, the changes in the expression levels of IL-6 and TNF-α mRNA were more significant than those of the other treatment groups (P < 0.01). These results indicate that during inflammation, insulin resistance can promote RAW264.7 macrophages to secrete more inflammatory cytokines.
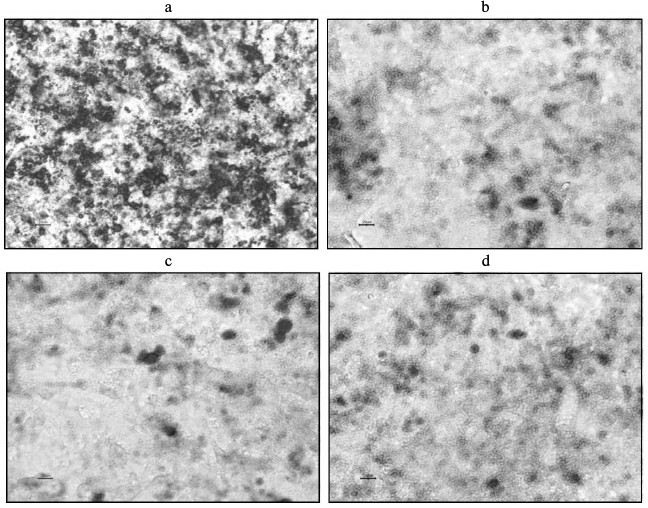
Proliferation and differentiation following coculture of 3T3-L1 preadipocytes. As revealed in the MTT assay, proliferation of the 3T3-L1 preadipocytes in the insulin resistance, inflammation, and inflammation + insulin resistance groups was inhibited compared to that of the PBS control group (P < 0.05; Table 2). The 3T3-L1 preadipocyte differentiation and maturation also played an inhibitory role (induction following 8 days; P < 0.05; Table 2). Differentiation and maturation were also inhibited in these groups. The 3T3-L1 adipose cell and intracellular lipid droplet size were reduced, and the cells had not significantly matured (Fig. 4).
Fig. 4. Induction of 3T3-L1 preadipocytes after 8 days (oil red-O staining). a) C-1, PBS (control) group; b) C-2, insulin resistance group; c) C-3, inflammation group; d) C-4, inflammation + insulin resistance group. (Compared with the C-1 control group, the sizes of 3T3-L1 adipose cells and intracellular lipid droplets were smaller in the other groups, and the cells did not significantly differentiate.)
Compared with the C-1 control group, the expression levels of Pref-1 mRNA in the C-2, C-3, and C-4 groups were increased to varying degrees, while those of PPARγ and C/EBPα were decreased (Fig. 5). In each case, the difference was significant (P < 0.05), indicating that under conditions of induced inflammation and insulin resistance, the differentiation of 3T3-L1 preadipocytes to adipocytes was inhibited.
Fig. 5. Results of RT-qPCR (groups C-1, C-2, C-3, C-4; * P < 0.05). C-1, PBS control; C-2, insulin resistance; C-3, inflammation; C-4, inflammation + insulin resistance. With the C-1 control group, the expression levels of Pref-1 mRNA remaining in each group increased to varying degrees, and the expression levels of PPARγ and C/EBPα mRNA decreased. There was a statistically significant difference (P < 0.05), indicating that when cells are cultured under conditions of inflammation and insulin resistance with 3T3-L1 adipose cells, differentiation from 3T3-L1 preadipocytes to adipocytes is inhibited.
Immunofluorescence following coculture with 3T3-L1 cells. Immunofluorescence labeling of 3T3-L1 preadipocytes in groups C-1 to C-4 failed to reveal the presence of CD68, F4/80, or Mac-1, suggesting that none of these cells acquired this phenotype (data not shown).
DISCUSSION
Visceral adipose tissue is the last of the energy reserves and secretes a variety of hormones and cytokines such as TNF-α, IL-6, MCP-1, resistin, and adiponectin. For this reason, the adipocyte or fat cell has recently become recognized as an endocrine cell [24]. During inflammation and in metabolic disorders, endocrine hormones activate cytokines, potentially causing a variety of metabolic abnormalities including obesity, diabetes, cardiovascular disease, and metabolic syndrome [25-29]. In the present study, the 3T3-L1 adipocyte cell line was used to analyze induced inflammation, insulin resistance, and insulin resistance plus inflammation in adipocytes, and the mRNA expressions of the cytokines adiponectin, TNF-α, IL-6, and MCP-1 under these conditions were measured. We found that in each of the treatment groups (induced inflammation, insulin resistance, and insulin resistance + inflammation), the mRNA expression of the antiinflammatory factor adiponectin was significantly reduced, while those of the inflammatory cytokines TNF-α, IL-6, and MCP-1 were significantly increased compared to the untreated controls. Thus, inflammation and insulin resistance in adipocytes leads to endocrine disruption, and antiinflammatory cytokines decrease the secretion of inflammatory cytokines and increase local adipose tissue inflammation.
Preadipocytes play a role in various regulatory factors through the activation of multiple genes associated with adipocytes. They also coordinate these genes under the control of a complex physiological process of biochemical differentiation before turning into mature adipocytes [30-32]. As revealed in the MTT assay, proliferation of the 3T3-L1 preadipocytes in the insulin resistance, inflammation, and inflammation + insulin resistance groups was inhibited compared to that of the PBS control group. This result indicates that the mature fat cells can significantly affect adipocyte proliferation and differentiation under conditions of inflammation or insulin resistance, especially under both inflammation and insulin resistance conditions. Through the regulation of acetyl-coenzyme A carboxylase, fatty acid synthase hormone-sensitive lipase, and other gene expressions via PPARγ, leptin is inhibited and energy intake increases, forming adipose cells [33, 34]. By regulating the key enzyme in the transcription factor, C/EBPα, the expression of adipocyte cell protein affects the differentiation process [35]. The role of the C/EBP family of transcription factors in adipose cell differentiation has been confirmed [36]. The expressions of C/EBPβ and C/EBPδ temporarily increase during the initial stage of adipocyte differentiation [37]. Together, they promote the expression of PPARγ and C/EBPα, which control and promote adipocyte cell differentiation to the terminal stage [35]. Hormone-induced mediators express PPARγ and C/EBPα, thereby regulating adipose cell differentiation and gene expression, which allows adipose cells to produce a characteristic phenotype [37]. PPARγ and C/EBPα synergistically promote adipose cell differentiation.
The Pref-1 gene encodes a 385-amino acid transmembrane protein, which is expressed prior to adipose cell differentiation. Pref-1 can maintain the undifferentiated state of 3T3-L1 preadipocytes if Pref-1 inhibits the differentiation of adipose cells [38-40]. We found that when preadipocytes were cocultured with adipocytes, Pref-1 mRNA expression levels increased and C/EBPα and PPARγ mRNA levels decreased under conditions of inflammation or insulin resistance, especially under both inflammation and insulin resistance conditions. These results indicate that changes occurred between Pref-1, C/EBPα, PPARγ, and inflammatory factors, which is consistent with Castro-Munozledo’s [41] study. Thus, TNF-α can directly inhibit the expression of C/EBPα and PPARγ and produce an inhibitory effect on adipocyte cell differentiation [41]. As adipocytes can secrete a variety of inflammatory cytokines under conditions of inflammation or insulin resistance, especially under both inflammation and insulin resistance conditions, it is unclear which one plays the major role. Further external validation studies are needed to determine the specific mechanism.
The mRNA expression levels of IL-6 and TNF-α were greater than those in the control group in the RAW264.7 macrophages (P < 0.05). Macrophages are a plastic and pluripotent cell population, both in vivo and in vitro, under the different influences of the microenvironment and function [42, 43]. There are two types of macrophages in adipose tissue. The first activates M1-type macrophages, and the other is the fat tissue itself containing the M2 macrophage alternative for the activation of macrophages [44, 45]. A large number of macrophages are involved in obesity and insulin resistance in adipose tissue [44]. It has been reported that macrophage infiltration in visceral adipose tissue is significantly greater than that in subcutaneous fat [46, 47]. Cousin et al. [48] found that preadipocytes have functions similar to macrophages. They combined macrophages and preadipocytes in vitro and found that some characteristics of preadipocytes are similar to the macrophage phenotype (CD86+, F4/80, Mac-1, CD45+, CD80+). This result implies that macrophages promote phenotypic changes through secreting cytokines, including inflammatory cytokines. Given that adipocytes secrete more inflammatory cytokines under inflammation and/or insulin resistance conditions like macrophages, we cocultured preadipocytes and adipocytes. However, this study found no conversion of adipocytes to a preadipocyte phenotype during inflammation and insulin resistance conditions. Therefore, other mechanisms may be involved in the phenotype change. Whether the environment of the body can cause a phenotypic transformation by adipocytes requires further study.
Under conditions of induced inflammation and insulin resistance, 3T3-L1 adipocytes decreased the mRNA expression levels of adiponectin and increased those of TNF-α, IL-6, and MCP-1. Under the same conditions, TNF-α and IL-6 mRNA expression levels were increased in RAW264.7 macrophages. Mature 3T3-L1 adipocytes inhibited the proliferation and differentiation of 3T3-L1 preadipocytes, but the transwell chamber assays did not cause phenotypic changes in the 3T3-L1 preadipocytes.
This work was supported by the National Natural Science Fund of China (Grants 30872541 and 81270265) and the Natural Science Fund of Shihezi University (Grant ZRKX2010YB22).
REFERENCES
1.Barton, M. (2000) Obesity and aging: determinants
of endothelial cell dysfunction and atherosclerosis, Pflugers.
Arch., 460, 825-837.
2.Caccamo, G., Bonura, F., Bonura, F., Vitale, G.,
Novo, G., Evola, S., Evola, G., Grisanti, M. R., and Novo, S. (2010)
Insulin resistance and acute coronary syndrome, Atherosclerosis,
211, 672-675.
3.Kang, M., Wang, H., and Wei, W. (2005) Immune
vasculitis induced atherosclerosis, J. Huazhong. Univ. Sci. Technol.
Med. Sci., 25, 533-535.
4.Ragbir, S., and Farmer, J. A. (2010) Dysfunctional
high-density lipoprotein and atherosclerosis, Curr. Atheroscler.
Rep., 12, 343-348.
5.Rho, Y. H., Chung, C. P., Solus, J. F., Raggi, P.,
Oeser, A., Gebretsadik, T., Shintani, A., and Stein, C. M. (2010)
Adipocytokines, insulin resistance, and coronary atherosclerosis in
rheumatoid arthritis, Arthritis Rheum., 62,
1259-1264.
6.Stamatelopoulos, K. S., Kitas, G. D., Papamichael,
C. M., Chryssohoou, E., Kyrkou, K., Georgiopoulos, G., Protogerou, A.,
Panoulas, V. F., Sandoo, A., Tentolouris, N., Mavrikakis, M., and
Sfikakis, P. P. (2009) Atherosclerosis in rheumatoid arthritis versus
diabetes: a comparative study, Arterioscler. Thromb. Vasc.
Biol., 29, 1702-1708.
7.Tokgozoglu, L. (2009) Atherosclerosis and the role
of inflammation, Turk. Kardiyol. Dern. Ars., 37 (Suppl.
4), 1-6.
8.Chowdhury, B., Sjostrom, L., Alpsten, M., Kostanty,
J., Kvist, H., and Lofgren, R. (1994) A multicompartment body
composition technique based on computerized tomography, Int. J.
Obes. Relat. Metab. Disord., 18, 219-234.
9.Halberg, N., Wernstedt-Asterholm, I., and Scherer,
P. E. (2008) The adipocyte as an endocrine cell, Endocrinol. Metab.
Clin. North. Am., 37, 753-768.
10.Bouloumie, A., Curat, C. A., Sengenes, C.,
Lolmede, K., Miranville, A., and Busse, R. (2005) Role of macrophage
tissue infiltration in metabolic diseases, Curr. Opin. Clin. Nutr.
Metab. Care, 8, 347-354.
11.Okamoto, Y., Kihara, S., Ouchi, N., Nishida, M.,
Arita, Y., Kumada, M., Ohashi, K., Sakai, N., Shimomura, I., Kobayashi,
H., Terasaka, N., Inaba, T., Funahashi, T., and Matsuzawa, Y. (2002)
Adiponectin reduces atherosclerosis in apolipoprotein E-deficient mice,
Circulation, 106, 2767-2770.
12.Ronti, T., Lupattelli, G., and Mannarino, E.
(2006) The endocrine function of adipose tissue: an update, Clin.
Endocrinol. (Oxford), 64, 355-365.
13.Assoumou, H. G., Pichot, V., Barthelemy, J. C.,
Dauphinot, V., Celle, S., Gosse, P., Kossovsky, M., Gaspoz, J. M., and
Roche, F. (2010) Metabolic syndrome and short-term and long-term heart
rate variability in elderly free of clinical cardiovascular disease:
the PROOF study, Rejuvenation Res., 13, 653-663.
14.Cancello, R., Tordjman, J., Poitou, C., Guilhem,
G., Bouillot, J. L., Hugol, D., Coussieu, C., Basdevant, A., Bar Hen,
A., Bedossa, P., Guerre-Millo, M., and Clement, K. (2006) Increased
infiltration of macrophages in omental adipose tissue is associated
with marked hepatic lesions in morbid human obesity,
Diabetes, 55, 1554-1561.
15.Fain, J. N. (2006) Release of interleukins and
other inflammatory cytokines by human adipose tissue is enhanced in
obesity and primarily due to the nonfat cells, Vitam. Horm.,
74, 443-477.
16.Fukuhara, A., Matsuda, M., Nishizawa, M., Segawa,
K., Tanaka, M., Kishimoto, K., Matsuki, Y., Murakami, M., Ichisaka, T.,
Murakami, H., Watanabe, E., Takagi, T., Akiyoshi, M., Ohtsubo, T.,
Kihara, S., Yamashita, S., Makishima, M., Funahashi, T., Yamanaka, S.,
Hiramatsu, R., Matsuzawa, Y., and Shimomura, I. (2005) Visfatin: a
protein secreted by visceral fat that mimics the effects of insulin,
Science, 307, 426-430.
17.Iacobellis, G., Corradi, D., and Sharma, A. M.
(2005) Epicardial adipose tissue: anatomic, biomolecular and clinical
relationships with the heart, Nat. Clin. Pract. Cardiovasc.
Med., 2, 536-543.
18.Padwal, R. S., and Sharma, A. M. (2010)
Prevention of cardiovascular disease: obesity, diabetes and the
metabolic syndrome, Can. J. Cardiol., 26, 18C-20C.
19.Weyer, C., Foley, J. E., Bogardus, C., Tataranni,
P. A., and Pratley, R. E. (2000) Enlarged subcutaneous abdominal
adipocyte size, but not obesity itself, predicts type II diabetes
independent of insulin resistance, Diabetologia, 43,
1498-1506.
20.Charriere, G., Cousin, B., Arnaud, E., Andre, M.,
Bacou, F., Penicaud, L., and Casteilla, L. (2003) Preadipocyte
conversion to macrophage. Evidence of plasticity, J. Biol.
Chem., 278, 9850-9855.
21.Knutson, V. P., and Balba, Y. (1997) 3T3-L1
adipocytes as a cell culture model of insulin resistance, In
vitro Cell. Dev. Biol. Anim., 33, 77-81.
22.Lu, B., Lu, Y., Moser, A. H., Shigenaga, J. K.,
Grunfeld, C., and Feingold, K. R. (2008) LPS and proinflammatory
cytokines decrease lipin-1 in mouse adipose tissue and 3T3-L1
adipocytes, Am. J. Physiol. Endocrinol. Metab., 95,
E1502-1509.
23.He, Z., Tian, F., Zhu, Y., Lavlinskaia, N., and
Du, H. (2011) Long-period gratings in photonic crystal fiber as an
optofluidic label-free biosensor, Biosens. Bioelectron.,
26, 4774-4778.
24.Halberg, N., Wernstedt-Asterholm, I., and
Scherer, P. E. (2008) The adipocyte as an endocrine cell,
Endocrinol. Metab. Clin. North. Am., 37, 753-768.
25.Iacobellis, G., Corradi, D., and Sharma, A. M.
(2005) Epicardial adipose tissue: anatomic, biomolecular and clinical
relationships with the heart, Nat. Clin. Pract. Cardiovasc.
Med., 2, 536-543.
26.Trayhum, P., and Beatte, J. H. (2001)
Physiological role of adipose tissue: white adipose tissue as an
endocrine and secretory organ, Proc. Nutr. Soc., 60,
329-339.
27.Fukuhara, A., Matsuda, M., Nishizawa, M., Segawa,
K., Tanaka, M., Kishimoto, K., Matsuki, Y., Murakami, M., Ichisaka, T.,
Murakami, H., Watanabe, E., Takagi, T., Akiyoshi, M., Ohtsubo, T.,
Kihara, S., Yamashita, S., Makishima, M., Funahashi, T., Yamanaka, S.,
Hiramatsu, R., Matsuzawa, Y., and Shimomura, I. (2005) Visfatin: a
protein secreted by visceral fat that mimics the effects of insulin,
Science, 307, 426-430.
28.Jensen, M. D. (2008) Role of body fat
distribution and the metabolic complications of obesity, J.
Clin. Endocrinol. Metab., 93, S57-S63.
29.Antuna-Puente, B., Feve, B., Fellahi, S., and
Bastard, J. P. (2008) Adipokines: the missing link between insulin
resistance and obesity, Diabetes Metab., 34, 2-11.
30.Ailhaud, G. (1999) Cell surface receptors,
nuclear receptors and ligands that regulate adipose tissue development,
Clin. Chim. Acta, 286, 181-190.
31.Rosen, E. D., Walkey, C. J., Puigserver, P., and
Spiegelman, B. M. (2000) Transcriptional regulation of adipogenesis,
Genes Dev., 14, 1293-1307.
32.Soukas, A., Socci, N. D., Saatkamp, B. D.,
Novelli, S., and Friedman, J. M. (2001) Distinct transcriptional
profiles of adipogenesis in vivo and in vitro, J.
Biol. Chem., 276, 34167-34174.
33.Dodson, M. V., Vierck, J. L., Hausman, G. J.,
Guan, L. L., Fernyhough, M. E., Poulos, S. P., Mir, P. S., and Jiang,
Z. (2010) Examination of adipose depot-specific PPAR moieties,
Biochem. Biophys. Res. Commun., 394, 241-242.
34.Long, L., and Wang, P. (2006) Advance in the
study on peroxisomal proliferators activated receptors and their
control of adipose cell differentiation, Chin. Gen. Pract.,
9, 68-71.
35.Takahashi, S., Tanaka, T., Kodama, T., and Sakai,
J. (2006) Peroxisome proliferator-activated receptor delta (PPARdelta),
a novel target site for drug discovery in metabolic syndrome,
Pharmacol. Res., 53, 501-507.
36.Diehl, A. M., Michaelson, P., and Yang, S. Q.
(1994) Selective induction of CCAAT/enhancer binding protein isoforms
occurs during rat liver development, Gastroenterology,
106, 1625-1637.
37.Li, X., Huang, H. Y., Chen, J. G., Jiang, L.,
Liu, H. L., Liu, D. G., Song, T. J., He, Q., Ma, C. G., Ma, D., Song,
H. Y., and Tang, Q. Q. (2006) Lactacystin inhibits 3T3-L1 adipocyte
differentiation through induction of CHOP-10 expression, Biochem.
Biophys. Res. Commun., 350, 1-6.
38.Lee, J. H., Kim, K. A., Kwon, K. B., Kim, E. K.,
Lee, Y. R., Song, M. Y., Koo, J. H., Ka, S. O., Park, J. W., and Park,
B. H. (2007) Diallyl disulfide accelerates adipogenesis in 3T3-L1
cells, Int. J. Mol. Med., 20, 59-64.
39.Kim, K. A., Kim, J. H., Wang, Y., and Sul, H. S.
(2007) Pref-1 (preadipocyte factor 1) activates the MEK/extracellular
signal-regulated kinase pathway to inhibit adipocyte differentiation,
Mol. Cell. Biol., 27, 2294-2308.
40.Wang, Y., Kim, K. A., Kim, J. H., and Sul, H. S.
(2006) Pref-1, a preadipocyte secreted factor that inhibits
adipogenesis, J. Nutr., 136, 2953-2956.
41.Castro-Munozledo, F., Beltran-Langarica, A., and
Kuri-Harcuch, W. (2003) Commitment of 3T3-F442A cells to adipocyte
differentiation takes place during the first 24-36 h after adipogenic
stimulation TNF-alpha inhibits commitment, Exp. Cell. Res.,
284, 163-172.
42.Gordon, S. (2007) Macrophage heterogeneity and
tissue lipids, J. Clin. Invest., 117, 89-93.
43.Gordon, S., and Taylor, P. R. (2005) Monocyte and
macrophage heterogeneity, Nat. Rev. Immunol., 5,
953-964.
44.Gordon, S. (2003) Alternative activation of
macrophages, Nat. Rev. Immunol., 3, 23-35.
45.Mantovani, A., Sica, A., and Locati, M. (2005)
Macrophage polarization comes of age, Immunity,
23, 344-346.
46.Weisberg, S. P., McCann, D., Desai, M.,
Rosenbaum, M., Leibel, R. L., and Ferrante, A. W., Jr. (2003) Obesity
is associated with macrophage accumulation in adipose tissue, J.
Clin. Invest., 112, 1785-1788.
47.Tchoukalova, Y. D., Sarr, M. G., and Jensen, M.
D. (2004) Measuring committed preadipocytes in human adipose tissue
from severely obese patients by using adipocyte fatty acid binding
protein, Am. J. Physiol. Regul. Integr. Comp. Physiol.,
287, R1132-1140.
48.Cousin, B., Munoz, O., Andre, M., Fontanilles, A.
M., Dani, C., Cousin, J. L., Laharrague, P., Casteilla, L., and
Penicaud, L. (1999) A role for preadipocytes as macrophage-like cells,
FASEB J., 13, 305-312.