Downregulation of miR-221, -30d, and -15a Contributes to Pathogenesis of Prostate Cancer by Targeting Bmi-1
Hanqing Xuan, Wei Xue*, Jiahua Pan, Jianjun Sha, Baijun Dong, and Yiran Huang
Department of Urology, Ren Ji Hospital, School of Medicine, Shanghai Jiao Tong University, No. 1630 Dong Fang Road, Shanghai 2000127, China; fax: +86-21-6838-3716; E-mail: weixuerh@sohu.com; xuanhq@163.com* To whom correspondence should be addressed.
Received May 20, 2014; Revision received August 3, 2014
Prostate cancer is the second leading cause of cancer-related deaths of men. Bmi-1, a member of PcG family of proteins, has been implicated in the pathogenesis of prostate cancer, and disturbed profile of microRNAs (miRNAs) has been found in prostate cancer tissues. How Bmi-1 is regulated by miRNAs is unclear. In this study, we screened 18 miRNAs that potentially repress the expression of Bmi-1 using a dual luciferase system and found that 12 miRNAs could bind with the 3′-untranslated region of Bmi-1 mRNA. Using qRT-PCR, we found that expression of miR-221, -15a, and -30d was significantly reduced in prostate cancer tissues. Subsequent functional study indicated that miR-221 and miR-30d can repress prostate cancer cell proliferation, and this effect can be partially rescued by Bmi-1 overexpression. Our study constructs the relation between downregulated miR-221 and miR-30d and prostate cancer pathogenesis. These results indicate that miR-221 and miR-30d are candidate tumor suppressor miRNAs in prostate cancer and therefore serve as potential clinical classification markers and therapeutic targets for human prostate cancer.
KEY WORDS: miRNA, prostate cancer, Bmi-1, cell proliferationDOI: 10.1134/S0006297915030037
Abbreviations: AGO2, Argonaute RISC catalytic component 2; Bmi-1, B-cell specific Moloney leukemia virus insertion region homolog 1 (oncoprotein from PcG (polycomb group)); GAPDH, glyceraldehyde-3-phosphate dehydrogenase; miRNA, microRNA; PCa, prostate cancer; siRNA, small interfering RNA; 3′-UTR, 3′-untranslated region.
Prostate cancer (PCa), the second leading cause of cancer-related deaths
of men, is a complex and multifactorial disease including genetic
variation and environmental factors. In spite of the heavy social
burden and bad clinical outcomes of PCa, the molecular mechanisms
underlying prostate carcinogenesis remain poorly understood.
Increasing evidence indicates that polycomb group (PcG) proteins, which were identified initially in Drosophila as epigenetic gene silencers of homoeotic genes, play a crucial role in cancer development and recurrence [1]. Bmi-1 (B-cell specific Moloney leukemia virus insertion region homolog 1), a member of PcG family of proteins, is a marker used in stem cell biology, and increased expression of Bmi-1 has been found to be associated with chemoresistance [2]. Recent studies show that Bmi-1 is positively correlated with prostate cancer pathogenesis [3, 4]. There are also reports that Bmi-1 is a crucial regulator of prostate stem cell self-renewal and malignant transformation [5].
MicroRNAs (miRNAs) are a kind of short noncoding RNAs that suppress the expression of protein-coding genes by partially complementary binding, especially to the 3′-untranslated regions (3′-UTRs) of messenger RNAs (mRNAs). According to the predicted results of bioinformatics, more than 60% of protein-coding genes are regulated by miRNA. The miRNA expression changes are involved in the initiation, progression, and metastasis of human cancers, and it is believed that miRNAs function as both tumor suppressors and oncogenes in cancer development [6, 7]. There are also reports indicating that disturbed expression of miRNAs is involved in the pathogenesis of PCa [8-10].
In this study, we constructed a Bmi-1 3′-UTR reporter system and screened 18 miRNAs that potentially repress the expression of Bmi-1. We examined 12 selected miRNAs in prostate cancer tissues and found that the expression of miR-221, -30d, and -15a was significantly reduced. Our work partially unveils the correlations between miRNAs and prostate cancer pathogenesis and provides potential biomarkers or targets for clinical diagnosis and treatment of PCa.
MATERIALS AND METHODS
Tissue sample. Patients (age 65-75) who underwent prostate biopsy between May 2011 and November 2013 at Ren Ji Hospital were selected. We randomly chose 30 prostate cancer patients’ tissues and adjacent normal tissues to detect the expression of Bmi-1 and miRNAs.
Cell culture. PC-3 cells were grown at 37°C and in 5% CO2 in RPMI-1640 supplemented with fetal bovine serum (FBS) plus 2 mM L-glutamine (HyClone, USA). HEK293T cells were cultured in Dulbecco’s Modified Eagle Medium (DMEM) containing 10% fetal bovine serum (HyClone), 100 IU/ml penicillin, and 10 mg/ml streptomycin. All cells were maintained at 37°C under an atmosphere of 5% CO2. MiR-221, miR-30d mimics, and AGO2 siRNAs were purchased from Shanghai Gene Pharma (China).
Western blotting. Protein extracts were boiled in SDS/β-mercaptoethanol sample buffer, and 20 μg samples were loaded onto each lane of 12% polyacrylamide gels. The proteins were separated by electrophoresis, and the proteins in the gels were blotted onto PVDF membranes (Amersham Pharmacia Biotech, UK) by electrophoretic transfer. The membrane was incubated with rabbit anti-Bmi-1 polyclonal antibody (Abcam, USA) and mouse anti-GAPDH monoclonal antibody (Santa Cruz Biotechnology Inc., USA) overnight at 4°C. The specific protein–antibody complex was detected using horseradish peroxidase-conjugated goat anti-rabbit or rabbit anti-mouse IgG. Detection by the chemiluminescence reaction was carried using an ECL kit (Pierce, USA). The GAPDH signal was used as a loading control.
Stem-loop RT-qPCR. Quantitative RT-PCR analysis was used to determine the relative expression level of selected miRNAs. Total RNA was extracted from tissues using Trizol reagent (Invitrogen, USA) according to the manufacturer’s instructions. The expression levels of 12 candidate miRNAs were detected by TaqMan miRNA RT-Real Time PCR. Single-stranded cDNA was synthesized using a TaqMan MicroRNA Reverse Transcription Kit (Applied Biosystems, USA) and then amplified using a TaqMan Universal PCR Master Mix (Applied Biosystems) together with miRNA-specific TaqMan MGB probes (Applied Biosystems). The U6 snRNA (non-coding small nuclear RNA) was used for normalization. Each sample in each group was measured in triplicate, and the experiment was repeated at least three times for the detection of each miRNA.
Dual luciferase assay. The full length of 1948 bp Bmi-1 3′-UTR was cloned downstream of the firefly luciferase coding region in the pmirGLO vector (Promega, USA) to generate luciferase reporter vector. For luciferase reporter assays, HEK293T cells were seeded in 48-well plates. MiR-221 or miR-30d mimics and luciferase reporter vectors were cotransfected using Lipofectamine 2000 (Invitrogen). Two days later, the cells were harvested and assayed with the Dual-Luciferase Assay (Promega). Each treatment was performed in triplicate in three independent experiments. The results were expressed as relative luciferase (LUC) activity (firefly LUC/Renilla LUC).
Cell proliferation assay. PC-3 cells were seeded in 96-well plates at low density (2·103) and allowed to attach overnight. The cells were then transfected with mimics or inhibitors of miR-221 or miR-30d. Twenty microliters of MTT (3-(4,5-dimethylthiazol-2-yl)-2,5-diphenyltetrazolium bromide) (5 mg/ml) (Sigma, USA) were added into each well 48 h after transfection, and the cells were incubated for a further 4 h. The absorbance was recorded at 490 nm with a 96-well plate reader after dimethyl sulfoxide addition.
Statistical analysis. Data were analyzed by using the SPSS Statistical Package v. 16. Independent two group’s analyses were used in t-test. Results of tissue miRNA levels were analyzed using the Mann–Whitney U-test. P < 0.05 was considered statistically significant.
RESULTS
Bmi-1 is overexpressed in prostate cancer tissues. Bmi-1, a member of PcG family proteins, is a marker used in stem cell biology. There are reports indicating that Bmi-1 is positively correlated with the pathogenesis of many types of cancers. To understand Bmi-1 expression in prostatic cancer tissues, we first detected the Bmi-1 protein level by using Western blot. As shown in Fig. 1a (results of five samples) and Fig. 1b (results of all the 30 samples), Bmi-1 expression was upregulated significantly in the PCa tissues compared with the adjacent normal prostate tissues (P < 0.01).
Fig. 1. Bmi-1 is upregulated in prostate cancer tissues. a) Bmi-1 protein level in prostate cancer tissues and adjacent normal tissues was examined using Western blot, and the expression of GAPDH was used as loading control. The results of 5 out of 30 samples are displayed. b) Quantified results of Western blot. Western blot results were quantified using Quantity One software (Bio-Rad, USA). The results were analyzed using paired Student’s t-test and P < 0.05 was considered statistically significant. * P < 0.05, ** P < 0.01. c) AGO2 siRNAs were transfected into PC-3 cells separately, and 48 h after transfection Bmi-1 expression was examined by Western blot.
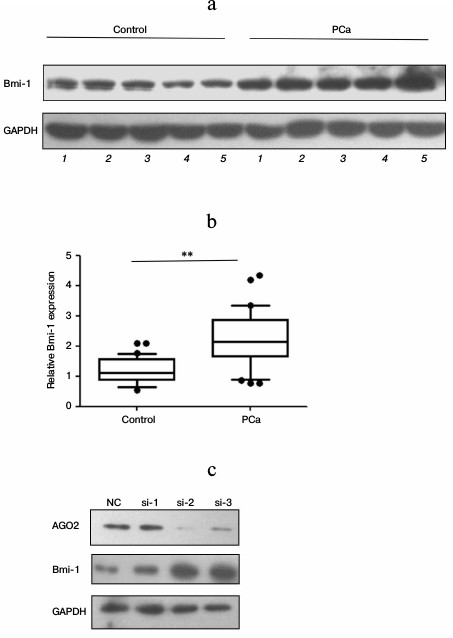
Expression of Bmi-1 is regulated by miRNAs in PC-3 cells. To investigate whether the expression of Bmi-1 is regulated by endogenous miRNAs in prostate cancer cells, we knocked down AGO2 (the core component of RISC) expression in PC-3 cells, and then detected Bmi-1 expression. As shown in Fig. 1c, Bmi-1 protein level was upregulated significantly accompanied by repressed AGO2 expression, indicating that miRNAs can play a crucial role in Bmi-1 expression.
Twelve miRNAs can repress Bmi-1 expression and three of them are downregulated in prostate cancer tissues. We thus speculated that the miRNAs repress Bmi-1 expression. By using Target Scan, an online bioinformatics tool (http://www.targetscan.org/), we found that 18 selected miRNAs were predicted to repress the expression of Bmi-1. To determine whether these miRNAs regulated Bmi-1 expression, we cloned the full-length 3′-UTR of Bmi-1 into pmirGLO vector followed by dual-luciferase assay. As shown in Fig. 2a, 12 out of 18 miRNAs significantly repressed the luciferase activity.
Fig. 2. miR-221, -15a, and -30d target 3′-UTR of Bmi-1, and their expression was repressed in PCa tissues. a) Screening of miRNAs that potentially target Bmi-1 3′-UTR. The full length of the Bmi-1 3′-UTR was cloned into pmirGLO plasmid following the firefly luciferase-coding region. Eighteen miRNAs, predicted targeting Bmi-1 3′-UTR directly, were selected. The dual-luciferase assay system was used to determine whether these miRNAs target Bmi-1 3′-UTR or not. The results were analyzed using paired Student’s t-test, and P < 0.05 was considered statistically significant. b) Expression of 12 miRNAs in PCa tissues and adjacent normal tissues examined by qRT-PCR. Total RNAs were extracted from thirty prostate tissues and adjacent normal tissues. A random five RNA samples from cancer tissues or control tissues were mixed and used as one sample. Results were analyzed using paired Student’s t-test, and P < 0.05 was considered statistically significant. * P < 0.05, ** P < 0.01.
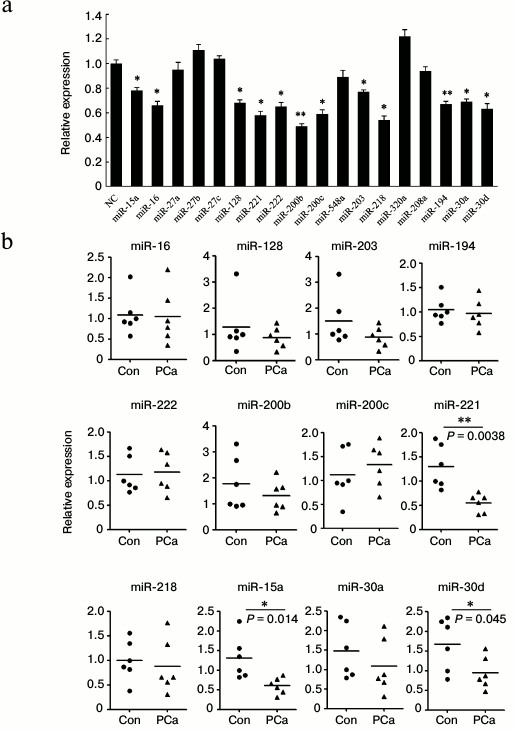
Subsequently, we examined the expression of these 12 miRNAs in prostate cancer tissues. Total RNAs were extracted from thirty prostate tissues, and five RNA samples were mixed to use as one group. As shown in Fig. 2b, three miRNAs (miR-15a, miR-221, and miR-30d) were significantly downregulated in cancer tissues compared with adjacent normal tissues.
Bmi-1 is a target gene of miR-221 and miR-30d. Since miR-15a has been confirmed to repress Bmi-1 expression in ovarian cancer and pancreatic ductal adenocarcinoma [11, 12], our study focused on the function of miR-221 and miR-30d.
We further searched for the binding sites of miR-221 and miR-30d by using dual-luciferase assay systems. As shown in Fig. 3 (b and d), the firefly luciferase activity was reduced 49.2 or 28.8% significantly in HEK293T cells transfected with miR-221 or miR-30d compared with miRNA control. Furthermore, the luciferase activity was upregulated by the miR-221 or miR-30d inhibitor compared with the anti-miR control about 17.3 or 40.1%. These results indicate that miR-221 and miR-30d target the 3′-UTR of Bmi-1, leading to the reduction of firefly luciferase translation.
Fig. 3. Identification of the binding site of miR-221 and miR-30d. HEK293T cells were cotransfected with miRNA control, miR-221/-30d mimic, anti-miR control, or miR-221/-30d inhibitor and pmirGLO-Bmi-1 for dual-luciferase assay. The results are expressed as the ratio of firefly luciferase activity and Renilla luciferase activity (b, d). When four nucleotides of the binding site of miR-221 (a) or miR-30d (c) in the 3′-UTR of Bmi-1 were mutated (pmirGLO-Bmi-1-Mu1 or pmirGLO-Bmi-1-Mu2), the luciferase activity was not significantly changed by miR-221 or miR-30d transfection. The results were analyzed using Student’s t-test, and P < 0.05 was considered statistically significant. * P < 0.05, ** P < 0.01.
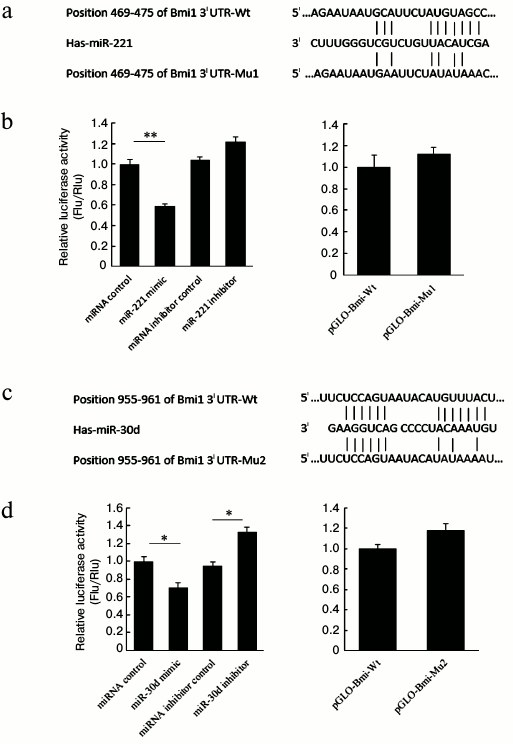
Seed sequence mutation clones were also used to confirm the binding sites for miR-221 and miR-30d (Fig. 3, a and c). Putative miR-221 and miR-30d binding sites in the 3′-UTR of Bmi-1 with four mutant nucleotides (designated as pmirGLO-Bmi-1-Mu1 and pmirGLO-Bmi-1-Mu2) were constructed and with wild-type vector as control, respectively. The histogram in Fig. 3b (right) and Fig. 3d (right) show that the enzyme activity was not significantly changed in the miRNA mimics group and control group. These data indicate that miR-221 and miR-30d suppress Bmi-1 expression through binding to the seed sequence at the 3′-UTR of Bmi-1, and Bmi-1 may be a direct target of miR-221 and miR-30d.
To understand whether miR-221 and miR-30d can repress endogenous Bmi-1 expression, PC-3 cells were transfected with miR-221 or -30d mimics or inhibitor, and 48 h after transfection Bmi-1 protein level was detected using Western blot. As shown in Fig. 4a, the Bmi-1 protein levels were downregulated significantly in PC-3 cells when transfected with miR-221 or miR-30d. However, Bmi-1 expression was significantly upregulated by miR-221 or miR-30d inhibitor.
Fig. 4. MiR-221 and miR-30d repress prostate cancer cell proliferation partially by repressing Bmi-1 expression. a) miR-221 and miR-30d repress endogenous Bmi-1 expression. b) Construct Bmi-1 overexpression plasmid. c) Cell proliferation assay. PC-3 cells were transfected with miR-221/-30d mimic or miR-221/-30d mimic plus Bmi-1 expression plasmid with miRNA control and miR-221/-30d plus pcDNA-3.1 as control. The MTT method was used to detect cell proliferation ability. The results were analyzed using Student’s t-test. P < 0.05 was considered statistically significant. * P < 0.05, ** P < 0.01.
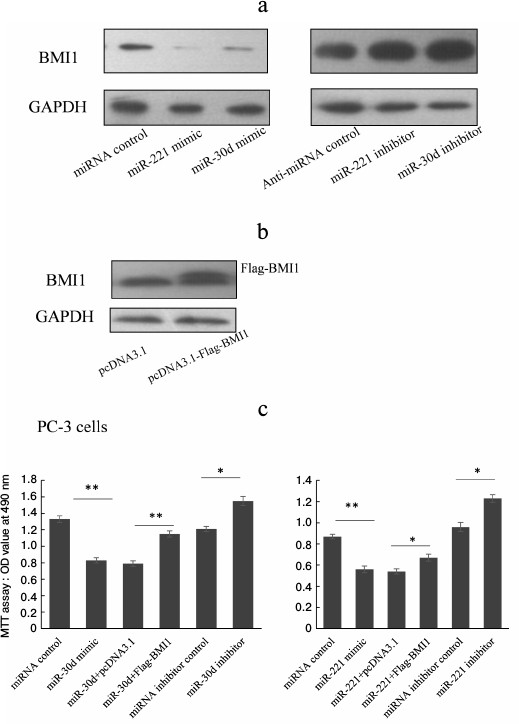
Dysregulation of miR-221 or miR-30d is related to disturbed prostate cancer cell proliferation. There are some reports indicating that overexpression of Bmi-1 promotes the proliferation of various types of cancer cells. To identify further the biological function of miR-221 and miR-30d in prostate cancer pathogenesis, we detected prostate cancer cell proliferation when the expression of miR-221 or miR-30d was disturbed.
PC-3 cells that were transfected with miR-221 or miR-30d showed lower capacity for proliferation than those transfected with miRNA control. When Bmi-1 was overexpressed by plasmid transfection, the cell proliferation capacity was partially rescued, which indicates miR-221 and miR-30d repress prostate cancer cell proliferation partially by targeting Bmi-1. When miR-221 or miR-30d expression was repressed when transfected by miRNA inhibitors, the cell proliferation capacity was upregulated significantly, implying that repressed miR-221 and miR-30d expression is related to prostate cancer partially through promoting the proliferation of prostate cancer cells.
DISCUSSION
Bmi-1, also known as polycomb group RING finger protein 4 (PCGF4) or RING finger protein 51 (RNF51), is a polycomb ring-finger oncogene. Recent studies have shown that Bmi-1 is positively correlated with prostate cancer pathogenesis [3, 4]. There are also reports indicating that Bmi-1 is a crucial regulator of prostate stem cell self-renewal and malignant transformation [5]. In this study, we found that overexpressed Bmi-1 protein is related to prostate cancer. However, there is a report that Bmi-1 mRNA level was not upregulated significantly in prostate cancer tissues. These evidences suggest that posttranscriptional regulation plays a crucial role in the Bmi-1 expression during PCa pathogenesis [13]. The miRNAs are a kind of short noncoding RNAs that suppress the expression of protein-coding genes by partial complementary binding to the 3′-UTR of mRNAs, and most of them do not induce mRNA degradation. We hypothesized that disturbed expression of miRNAs might be related to overexpressed Bmi-1. Subsequent AGO2 knockdown experiments verified our hypothesis, and we identified 12 miRNAs that could repress Bmi-1 expression using the dual-luciferase system. After scanning the expression of the 12 miRNAs in PCa tissues, we found that the expression of miR-15a, miR-221, and miR-30d was downregulated significantly in tumor tissues compared with the adjacent normal tissues. In this context, it has been reported that miR-15a represses Bmi-1 expression by directly targeting the Bmi-1 3′-UTR. We thus focused on the biological function of miR-221 and miR-30d. Cell proliferation capacity detected by MTT assay indicates that miR-221 and miR-30d act as tumor suppressors, and downregulated miR-221 or miR-30d can promote prostate cancer cell proliferation.
In conclusion, our study partially unveiled the roles of miRNAs in the Bmi-1 expression regulation system. We first identified that miR-221, miR-222, miR-30a, and miR-30d can bind with the 3′-UTR of Bmi-1. The expression of miR-221 and miR-30d was significantly reduced in the prostate cancer tissues accompanied with increased Bmi-1 expression. The miR-221 and miR-30d species are candidate tumor suppressor miRNAs in prostate cancer, and therefore they may be potential clinical classification markers and therapeutic targets for human prostate cancer.
This work was supported by the National Natural Science Foundation of China (91129725), the Shanghai Committee of Science and Technology, China (14140901700), and the Shanghai Pudong Scientific Research Grant (PWZxkq2014-05).
REFERENCES
1.Siddique, H. R., and Saleem, M. (2012) Role of
BMI1, a stem cell factor, in cancer recurrence and chemoresistance:
preclinical and clinical evidences, Stem Cells, 30,
372-378.
2.Kang, M. K., Kim, R. H., Kim, S. J., Yip, F. K.,
Shin, K. H., Dimri, G. P., Christensen, R., Han, T., and Park, N. H.
(2007) Elevated Bmi-1 expression is associated with dysplastic cell
transformation during oral carcinogenesis and is required for cancer
cell replication and survival, Brit. J. Cancer, 96,
126-133.
3.Atala, A. (2013) Re: Akt-mediated phosphorylation
of Bmi1 modulates its oncogenic potential, e3 ligase activity, and DNA
damage repair activity in mouse prostate cancer, J. Urol.,
189, 771.
4.Ammirante, M., Kuraishy, A. I., Shalapour, S.,
Strasner, A., Ramirez-Sanchez, C., Zhang, W., Shabaik, A., and Karin,
M. (2013) An IKKalpha-E2F1-BMI1 cascade activated by infiltrating B
cells controls prostate regeneration and tumor recurrence, Genes
Devel., 27, 1435-1440.
5.Lukacs, R. U., Memarzadeh, S., Wu, H., and Witte,
O. N. (2010) Bmi-1 is a crucial regulator of prostate stem cell
self-renewal and malignant transformation, Cell Stem Cell,
7, 682-693.
6.Wu, W. K., Lee, C. W., Cho, C. H., Fan, D., Wu, K.,
Yu, J., and Sung, J. J. (2010) MicroRNA dysregulation in gastric
cancer: a new player enters the game, Oncogene, 29,
5761-5771.
7.Nicoloso, M. S., Spizzo, R., Shimizu, M.,
Rossi, S., and Calin, G. A. (2009) MicroRNAs – the micro-steering
wheel of tumor metastases, Nature Rev. Cancer, 9,
293-302.
8.Srivastava, A., Goldberger, H., Dimtchev, A.,
Marian, C., Soldin, O., Li, X., Collins, S. P., Suy, S., and Kumar, D.
(2014) Circulatory miR-628-5p is downregulated in prostate cancer
patients, Tumor Biol. J. Int. Soc. Oncodevel. Biol. Med.,
35, 4867-4873.
9.Qiang, X. F., Zhang, Z. W., Liu, Q., Sun, N., Pan,
L. L., Shen, J., Li, T., Yun, C., Li, H., and Shi, L. H. (2014) miR-20a
promotes prostate cancer invasion and migration through targeting ABL2,
J. Cell. Biochem., 115, 1269-1276.
10.Ottman, R., Nguyen, C., Lorch, R., and
Chakrabarti, R. (2014) MicroRNA expressions associated with progression
of prostate cancer cells to anti-androgen therapy resistance, Mol.
Cancer, 13, 1.
11.Bhattacharya, R., Nicoloso, M., Arvizo, R.,
Wang, E., Cortez, A., Rossi, S., Calin, G. A., and Mukherjee, P. (2009)
MiR-15a and MiR-16 control Bmi-1 expression in ovarian cancer,
Cancer Res., 69, 9090-9095.
12.Guo, S., Xu, X., Tang, Y., Zhang, C., Li, J.,
Ouyang, Y., Ju, J., Bie, P., and Wang, H. (2014) miR-15a inhibits cell
proliferation and epithelial to mesenchymal transition in pancreatic
ductal adenocarcinoma by down-regulating Bmi-1 expression, Cancer
Lett., 344, 40-46.
13.Hoffmann, M. J., Engers, R., Florl, A. R., Otte,
A. P., Muller, M., and Schulz, W. A. (2007) Expression changes in
EZH2, but not in BMI-1, SIRT1, DNMT1 or DNMT3B are associated with DNA
methylation changes in prostate cancer, Cancer Biol. Ther.,
6, 1403-1412.