Mitodiversity
V. A. Popkov1, E. Y. Plotnikov2, K. G. Lyamzaev2, D. N. Silachev2, L. D. Zorova3, I. B. Pevzner2, S. S. Jankauskas2, S. D. Zorov1, V. A. Babenko1, and D. B. Zorov2*
1Lomonosov Moscow State University, Faculty of Bioengineering and Bioinformatics, 119991 Moscow, Russia2Lomonosov Moscow State University, Belozersky Institute of Physico-Chemical Biology, 119991 Moscow, Russia; fax: +7 (495) 939-0338; E-mail: zorov@genebee.msu.ru
3Lomonosov Moscow State University, International Laser Center, 119991 Moscow, Russia
* To whom correspondence should be addressed.
Received January 11, 2015; Revision received January 15, 2015
Here, in addition to the previously coined term “mitobiota”, we introduce the term “mitodiversity” for various phenotypic and genetic heterogeneities of mitochondria within the same cell or organ. Based on data on the mitochondrial transmembrane potential determined both in situ and in vitro under normal conditions and after organ ischemia/reperfusion, such heterogeneity is most evident under pathologic conditions. Herein, a part of the mitochondrial population with transmembrane potential typical of the normal state is sustained even under a pathological condition that, perhaps, underlies the development of ways of reversing pathology back to the normal state. The membrane potentials of isolated mitochondria were shown to directly correlate with the magnitude of side-scattered light depicting internal structure of mitochondria. We analyzed possible interpretations of data on mitochondrial membrane potential obtained using fluorescent probes. We suggest a possible mechanism underlying retention of fluorescent probes inside the cells and mitochondria.
KEY WORDS: mitochondria, heterogeneity, diversity, chondriome, population analysis, membrane potential, ischemia, pathology, lesionDOI: 10.1134/S000629791505003X
Abbreviations: mtDNA, mitochondrial DNA; TMRE, tetramethylrhodamine ethyl ester.
Over recent years, mitochondria have begun to attract more scientific
attention. Diversity of the intracellular functions puts mitochondria,
by their importance, into the center of regulatory networks controlling
both energy production, or energy transformation, and energy-unrelated
signaling or synthetic processes [1, 2]. It has become obvious that impaired mitochondrial
functions represent the basis for pathological processes in cells [3].
The diversity of mitochondrial functions allows considering them, to some extent, distributed within the mitochondrial population in the cell or body organ, i.e. assuming that distinct mitochondria in the chondriome would have become partially specialized. For cells, such specialization seems possible primarily when a chondriome is not built as a uniform entity [4, 5], but consists of separate mitochondria [6], even though they might be able to perform some inter-exchange mediated by the known fusion and fragmentation processes [7, 8]. Evidence of morphological and functional mitochondrial heterogeneity, especially within the same cell or body organ, appears necessary for proving that functions are partially distributed among the members of a mitochondrial population. We also assume that such specialization partially corresponds to the distribution of functions in social animals (e.g. bees or rodent colonies), wherein it results in altering the phenotype of the animal and changing its quality of life.
An idea that there are no completely similar biological structures gradually emerges; likewise, a similar understanding appears regarding the fact that no completely similar pathological conditions exist. A call to change a traditional approach implying a universal outlook on complex biological structures such as organelles, cells, and body organs begins to sound due to justification of individualized/personalized biology and medicine.
Earlier, while investigating mitochondria in diabetes, D. B. Zorov, a coauthor of this study, faced a problem logically implying the existence of cellular and mitochondrial heterogeneity in an organ. By measuring calcium ion levels in cardiomyocyte mitochondria from healthy and diabetic animals during activation of contractile function, it was demonstrated that in diabetic animals, calcium ion concentration, on average, was not increased as much as in healthy animals [9]. This was consistent with an idea that in diabetes it is impossible to reach Ca2+-dependent activation of mitochondrial dehydrogenases at the level necessary to enhance ATP synthesis meeting the elevated energy demands. To obtain valuable data reflecting significant differences between calcium transporting systems in healthy and diabetic animals, a large number of cardiomyocyte mitochondria had to be analyzed. Some results such as those demonstrating that the calcium ion concentration sometimes was not even lower, but equal to, or higher than in control animals, were hidden in this statistical analysis. It meant that a small population of healthy cardiomyocytes was still preserved in the diabetic heart. This suggested a simple explanation: a diabetic pathology, in this case, represents a disease that does not affect the entire heart, but only a core number of cells that eventually account for a pathological phenotype of the heart. This is a very important conclusion to be considered in the development of new strategies of fighting various diseases taking into consideration that a normal cellular population might be partially preserved, which theoretically might be the basis for reversing a pathological phenotype to normal one. There may be a certain threshold for impaired/normal cell ratio in an organ accounting for the emergence of a pathological phenotype.
The same principle has recently been developed to analyze a mitochondrial population that allowed us, by analogy with “microbiota”, to coin the term “mitobiota”, accounting for a community of mitochondria within the same cell or organ possessing various structural and functional heterogeneities [10]. Striking diversity of mitochondrial structures and functions especially evident in a pathological cell confirms mitochondrial heterogeneity that might have a putative threshold for a mitochondrial disease to be phenotypically exhibited, while the percentage of pathological mitochondria (or mtDNA) increases within the total mitochondrial population [11].
There is a vast amount of studies demonstrating mitochondrial heterogeneity – data describing differences in physicochemical properties and protein composition of separate mitochondria. In particular, a review published in 2009 provided a summary table showing mitochondrial heterogeneity [12]. It has long been firmly established that the mitochondria in skeletal muscle cells are divided into two populations: subsarcolemmal and interfibrillar mitochondria [13], although data describing mitochondrial subpopulations existing in other body tissues are constantly being published [14-16]. The simplicity of the applied methods (vital fluorescent dyes used to measure membrane potential) allowed paying special attention to the heterogeneity of the mitochondrial membrane potential [17]. However, other parameters such as isoelectric point [18], Ca2+ signaling pathway that depends on interaction with the reticulum [19], and amount of cardiolipin [20] and various proteins including the key mitochondrial transport protein TOM22 [21] turned out to be distributed unevenly among the members of the mitochondrial population. Such differences in mitochondrial functions were observed both in vitro and in situ. Izyumov et al. performed an important analysis of the heterogeneous mitochondrial membrane potential within the same cell [22] by discriminating mitochondria according to their membrane potential taking into consideration the variations in the amounts of reactive oxygen species mainly produced by a small fraction of deenergized mitochondria. Mitochondrial heterogeneity has also been analyzed in other studies by measuring background and amplified generation of reactive oxygen species [23, 24].
Understanding that a population of poorly energized mitochondria occurring in a cell in most cases can account for a low quality of the cell, we suggested using the magnitude of the mean mitochondrial transmembrane potential to grade cells [25]. Later, using this approach, a similar classification was suggested for isolation of the most vital population of sperm cells [26].
Over recent years, it has become clear that mitochondrial heterogeneity is particularly accounted for by two coupled processes – mitochondrial dynamics (mitochondrial fragmentation and fusion) [27] and autophagy (mitophagy) [12, 28]. The data on mitochondrial heterogeneity were underscored by using up-to-date microscopic techniques [29-31] thus supporting the concept of mitochondrial diversity in the cell.
By investigating the status of mitochondria within the vital section from the kidney undergoing ischemia/reperfusion, in 2007 we found that the mitochondrial transmembrane potential substantially varied as evaluated by measuring fluorescence intensity emitted by tetramethylrhodamine ethyl ester (TMRE), a mitochondrial probe [32]. At that time, such mitochondrial heterogeneity was not analyzed, as there was no understanding accounting for it or its function. Here, we describe a novel approach for evaluating mitochondrial heterogeneity in kidney cells measured in situ and in vitro by comparing TMRE-based fluorescence in healthy tissue as well as during ischemic stroke, and suggest a mechanism underlying mitochondrial heterogeneity and its interpretation.
MATERIALS AND METHODS
A model of ischemic lesion. We used ischemia/reperfusion, frequently applied worldwide for modeling ischemic kidney lesion. Rats were anesthetized with chloral hydrate (300 mg/kg, i.p.), which was followed by an abdominal incision. The renal vascular bundle was separated from the adjacent adipose tissue and occluded with a microvascular clamp for 40 min. The lack of blood flow was assessed visually by checking changes in kidney color. After all, the clamp was removed with a 10-min reperfusion of the kidneys.
After ischemia/reperfusion, the kidneys were excised and placed in the incubation medium (Hank’s Balanced Salt Solution for cell cultures added with 10 mM Hepes-NaOH, pH 7.4) to wash out the blood. Then, 10-15 µm sections through the cortical zone of the kidney were made. Tissue sections were washed using the incubation medium (all procedures and incubation were done at 25°C) with subsequent staining with 200 nM TMRE dissolved in the incubation medium and further wash-out to remove the excessive TMRE.
Confocal microscopy. Vital kidney sections were examined using an LSM510 laser-scanning confocal microscope (Carl Zeiss, Germany) and software provided by the manufacturer. A He-Ne laser (emission – 543 nm) was used for excitation, and after passing through a standard blocking filter set the fluorescence signal was collected with a bandpass above 560 nm. By averaging the results of four scans, images were obtained using a computer. Scan speed, signal gain level, and resolution of the image were the same in each set of all experiments. Thickness of the confocal plane was ~1.5 µm (pinhole – 150 µm).
Isolation of mitochondria. The rat kidney mitochondria were isolated by differential centrifugation. After the surgical manipulations and ending ischemia/reperfusion procedure, the kidneys were immediately excised and placed into cold isolation medium (2°C): 0.25 M sucrose, 10 mM Tris-HCl, pH 7.5, 1 mM EDTA, 0.1% BSA, 0.5 mM dithiothreitol. The renal capsule and pelvis were removed. Then the kidneys were chopped into 2-4 mm3 fragments, and these were washed twice in cold isolation medium and crushed using a Potter homogenizer (glass–Teflon) in 10× volume of the isolation medium per gram initial tissue at 4°C for 5 min. Then the homogenate was centrifuged at 800g, 4°C, for 5 min, after that centrifuging the supernatant was centrifuged at 10,000g, 4°C, for 10 min. The pellet was resuspended in the isolation medium without adding BSA, EDTA, and DTT, in 10× volume of the isolation medium per gram of initial tissue, and centrifuged at 12,000g, 4°C, for 10 min. Finally, the pellet was resuspended in the isolation medium without BSA, EDTA, and DTT, in 100-200 µl, and final protein concentration at 20-40 mg/ml. Bicinchoninic acid was used to measure protein concentration. The respiratory control index in the mitochondria was used to check the quality of the isolation procedure: mitochondria having respiratory control >3 were used in experiments.
Flow cytometry. Flow cytometry was performed by using a Cytomics FC500 instrument (Beckman Coulter, USA). TMRE-mediated fluorescence was measured on the FL2-channel with the laser emission at 488 nm. The incubation medium contained 120 mM KCl, 3 mM HEPES, 1 mM EGTA, 5 mM K2PO4, 100 nM TMRE, and respiratory substrates (5 mM pyruvate, 5 mM malate), pH 7.2-7.4; final mitochondrial protein concentration in the sample was 200 µg/ml. TMRE-based fluorescence intensity reflecting a magnitude of transmembrane potential in mitochondria, forward scattering corresponding to the size of particles, and side scattering corresponding to heterogeneity of internal contents were measured.
Image analysis. Analysis and image processing were done using Fiji software [33]. “Particle analysis” was used to characterize single elements (tubules and single cells). This approach was superior over manually outlined single elements in terms of excluding subjective evaluation upon data analysis: all images were automatically processed using the same transformations and setup, and subjective judgements of investigator were not involved.
More than 20 images in each group were analyzed. Images were converted into binary data (a threshold was detected using a triangle-based algorithm [34]) followed by applying a watershed algorithm (http://bigwww.epfl.ch/sage/soft/watershed) to mark the boundaries of single particles. Then the coordinates of single particles limited by area from top-to-bottom were determined using a “particle analysis” module. Output data of the algorithms were presented as a set of coordinates for small single homogeneous particles (cells and small tubules), on average, per 500-1000, depending on the size of the section. Further, fluorescence intensity for the particles was analyzed on the original image (prior to applying all the above-mentioned approaches). The data were extrapolated and processed using Microsoft Excel software. The coefficient of kurtosis for all pixels of the image was calculated using a Rolling Ball Background Subtraction Algorithm and threshold measurement according to the Shanbhag method [35].
Statistical coefficients. The coefficient of variation for random variables as a measure of relative dispersion of random variable was used to evaluate percentage of its mean dispersion, which is calculated only for quantitative data. In contrast to the mean square or standard deviation, it determines relative, not absolute, range of dispersion for a marker within a statistical population, and measured as a mean square deviation divided by statistical expectation.
The coefficient of kurtosis is a measure determining sharpness of the peak for random variables, and it is calculated as the fourth central moment of a random variable divided by the square of dispersion adjusted for its magnitude for normal distribution: owing to this, a coefficient of kurtosis >0 means “steeper” distribution compared to normal distribution, whereas <0 – shallow distribution, and <–1.2 often points at multimodal distribution.
The correlation coefficient measures the linear dependence between two random variables, and it is calculated as a covariance for these variables divided by mean square deviations for each variable that ranges from 1 to –1, where the extreme values reflect direct or inverse linear dependence, respectively.
The Mann–Whitney test was used to compare pairwise samples.
RESULTS
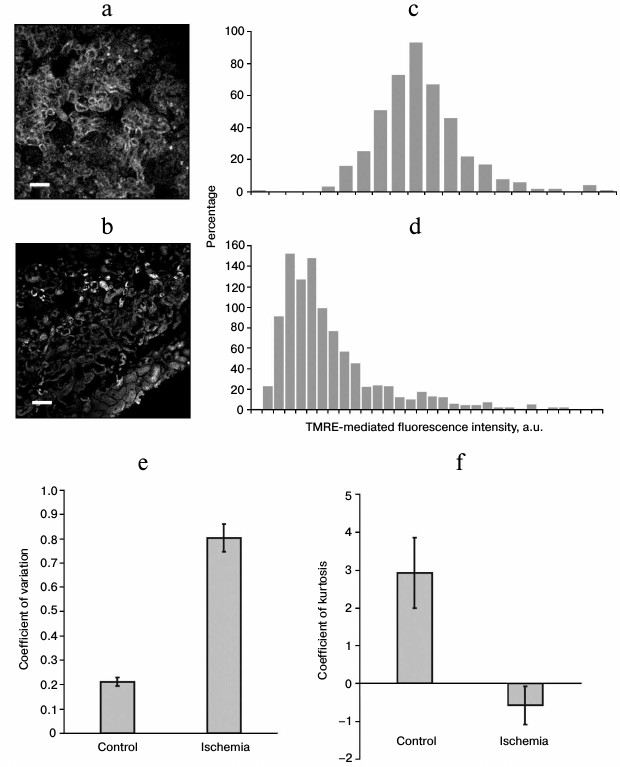
By analyzing confocal images of the TMRE-stained kidney sections, a substantial variance in fluorescence intensity of the cellular mitochondria was revealed. Representative images of the control and ischemic kidneys (image contrast was changed for better visualization) (Fig. 1, a and b) as well as distribution of fluorescence intensity for different objects on the sections (Fig. 1, c and d) are shown. On the section of ischemic kidney, renal tubules with bright and almost absent fluorescent signal are observed, whereas in the control group all the tubules have the same fluorescence intensity. In the former, the distribution of fluorescence intensities is broader than in the control group, which points at more pronounced heterogeneity of the cells and consequent mitochondria in the tissue. To quantify the observed heterogeneity, we applied the variation and kurtosis coefficients, which are widely used in mathematical statistics. The former denotes the percentage accounted for by the dispersion relative to the mean value, whereas the latter is used to evaluate “steepness” (>0) or “shallowness” (<0) for experimental vs. normal distribution. It was found that in the sections of kidneys after ischemia/reperfusion, the variation coefficient for fluorescence intensity was substantially higher than in the control group, thus indicating its larger dispersion and subsequent heterogeneity of the examined images (Fig. 1e). On the contrary, the kurtosis coefficient for distribution of fluorescence intensity on the sections of ischemic kidneys was much lower (Fig. 1f) and had negative values (in this case, negative values may even point at multimodal distribution), thus suggesting a shallower distribution and, subsequently, greater heterogeneity.
Fig. 1. Confocal images of the kidney vital sections from control group (a) and after ischemia/reperfusion (b) stained with TMRE probe (scale – 50 µm) as well as distribution of fluorescence intensity, respectively (c and d); e) coefficient of variation for distribution of TMRE-mediated fluorescence intensity obtained for the kidney sections from control group (n = 29) and after ischemic intervention (n = 26); f) coefficient of kurtosis for distribution of TMRE-mediated fluorescence intensity, the same sections; p ≤ 0.01.
By analyzing flow cytometry data obtained with TMRE-incubated renal mitochondria, one can see that ischemia/reperfusion lowers the mean fluorescence intensity in the mitochondria (Fig. 2a), which is accompanied by an increased coefficient of variation (data not shown). As a result, the peak of TMRE fluorescence shifts towards low magnitude of fluorescence intensity, and the percentage of dispersed fluorescence intensity relative to its mean values increase (Fig. 2a) despite a decreased absolute magnitude for the deviation.
Fig. 2. TMRE-based fluorescence intensity in mitochondria isolated from the kidney of control animals and after ischemia/reperfusion according to flow cytometry data (a). Intensity of side (b) and forward (c) scattering, the same samples; d) plot depicting correlation between mean side scattering (n = 9) and mean TMRE-based fluorescence intensity (correlation coefficient is 0.96).
By analyzing the data on side scattering of the renal cells, it was found that after ischemia/reperfusion fluorescence intensity was markedly shifted towards low magnitude (Fig. 2b) pointing at lowered heterogeneity of the internal mitochondrial content. At the same time, the data on forward scattering showed virtually no change in the ischemic kidneys (Fig. 2c) or any correlation with TMRE-mediated fluorescence intensity. Apparently, this indicates that the size of the isolated renal mitochondria is not directly related to their functioning. Obviously, such a statement is not true for the native intracellular mitochondria because the process of isolation used to extract tissue mitochondria may affect both parameters.
In addition, a direct dependence (correlation coefficient 0.96) between TMRE-based fluorescence intensity in mitochondria and their side scattering (Fig. 2d) was observed as the mean magnitude for these parameters in each sample fall exactly on the same 30° inclined curve.
In all the experiments, it was observed that the mitochondria isolated from ischemic kidneys had a clear-cut subpopulation with low TMRE-based fluorescence intensity, low magnitude of the side scattering, but different magnitude of the forward scattering, again pointing at the correlation between the lowered TMRE-based fluorescence and heterogeneity of the mitochondrial content, but not the size of the mitochondria. It should be noted that no mitochondrial population having such characteristics was found in the control group; however, it contained a small mitochondrial population having low magnitude of the TMRE-mediated fluorescence (Fig. 2a).
DISCUSSION
Heterogeneity in the biological system is perhaps an inevitable condition that should be taken into consideration upon examining the normal and pathological state. Most likely, no similar cells or intracellular organelles exist in vivo. A mechanism underlying such diversity is unclear, but, evidently, it emerges very early during development. Recent data suggest that cellular heterogeneity becomes evident as early as in the 2- and 4-cell stage embryo [36]. Given the maternal inheritance of mitochondria and their abundance inside oocytes, such heterogeneity is observed starting from the very beginning of embryogenesis and is typical of both oocyte and embryo [37].
Here, to evaluate mitochondrial heterogeneity in kidneys, we particularly evaluated the magnitude of transmembrane potential (ΔΨ) as one of the most valuable parameters of mitochondrial metabolism. However, it must be admitted that the data on ΔΨ magnitude must be critically analyzed by assessing potential problems occurring during the measurement of mitochondrial transmembrane potential inside cells using permeable fluorescent cationic probes. The apparent heterogeneity in intensity of fluorescent cationic probes such as TMRM, TMRE, rhodamine 123, etc. may be due to various reasons (analysis of some potential artefacts was presented earlier in [38]).
Cause No. 1. Although being the major part of the proton-motive force (ΔµH+), a transmembrane potential (ΔΨ) measured using fluorescent probes represents, anyway, only a part of it. Another constituent comprising ΔpH may also vary, so that the major energetic index may stay unchanged. Usually, nigericin (K+/H+-exchanger) that provides conversion of ΔpH into ΔΨ is used to measure the maximum magnitude of the ΔΨ reflecting the magnitude of ΔµH+.
Cause No. 2. Generation of ΔΨ in mitochondria competes with energy-consuming reactions (endergonic reactions occurring with expenditure of ATP) resulting in reaching a steady state ΔΨ level that does not reflect the degree of ΔΨ generation. To obtain the full level of transmembrane potential generation, oligomycin, a powerful inhibitor blocking the proton channel in mitochondrial ATPase and hindering ATP utilization inside mitochondria, is conventionally used.
Cause No. 3. Upon extremely high magnitude of ΔΨ, the fluorescence of the probes pumping into the mitochondria may undergo self-quenching. Usually, this issue is solved by using low amounts of the probes, which technically limits fluorescence detection.
Cause No. 4. Because fluorescent cationic probes are substrates for nonspecific pumps located within the cellular membrane that pump xenobiotics out of the cell, an apparent heterogeneity of the mitochondrial polarization among the cells may be caused by different activities of such pumps. Taking this into consideration or directly inhibiting nonspecific pumps is a difficult task that can be solved using verapamil.
Cause No. 5. In most cases, mitochondrial fluorescent probes (TMRE, TMRM, rhodamine 123) are represented by esters that can be cleaved by intracellular and intramitochondrial esterases with subsequent generation of zwitterions (Fig. 3). Whereas cationic probes possess good capacity to penetrate through phospholipid membranes, corresponding zwitterions poorly travel through membranes so they end up entrapped inside the cell or mitochondria. This principle underlies a mode of action for a number of probes containing ester compounds such as X-AM: when esterase removes the acetoxymethyl group (AM), it results in the probe (X) being released into the medium. In the case of mitochondrial probes such as TMRM, TMRE, or rhodamine 123 and with active esterase, total fluorescence would be summed up from those provided by cationic and zwitterion forms. Accumulation of the cationic form of the probe in the cell and organelle would follow the magnitude of ΔΨ according to the Nernst equation, but the behavior of a neutral form of the probe would not agree with such law. Moreover, this might be a reason why the loss of intracellular and intramitochondrial rhodamine-based fluorescence is not observed upon full deenergization. It may be assumed that the long-term sustained fluorescence found after staining of tumor and muscular cells with rhodamine 123 and interpreted as being mediated exactly by the retention of this probe inside the cells [39], also results from esterase activity converting rhodamine 123 into rhodamine 110.
Fig. 3. Hypothetical mechanism for possible retention of fluorescent probe inside cells and mitochondria upon staining with a fluorescent ester (here, by rhodamine 123). Intracellular esterases convert the delocalized cation penetrating into the cells into a non-penetrating zwitterion, resulting in its retention inside the cells.
It must be concluded that the heterogeneous fluorescence distribution detected by mitochondrial probes in cells and body tissues reflecting the magnitude of transmembrane potential cannot be easily interpreted as heterogeneous mitochondrial energetics and sometimes it just cannot be treated this way. It is worth noting that Izyumov et al., as mentioned above, showed that heterogeneous fluorescence of mitochondrial probes was preserved in the presence of nigericin and oligomycin, thus excluding Causes 1 and 2 [22]. Equally, Causes 1-4 cannot confirm occurring mitochondrial hyperpolarization detected upon opening of the mitochondrial pores measured by TMRM-mediated fluorescence [40].
The confocal microscopy data suggest that the mitochondria from different cells of the same tissue (and most likely, within the same cell) are heterogeneous in terms of their energetics. Some mitochondria turn out to be more resistant to ischemic damage and preserve quite high transmembrane potential, whereas others become highly deenergized. In the control group, such heterogeneity was almost absent. Thus, mitochondrial diversity (coined as “mitodiversity”) becomes more evident especially upon critical conditions, when the primary need is survival (perhaps, due to decreased expenditures for maintaining cellular homeostasis observed in the healthy state). As we note, mitochondrial functioning altered under pathological conditions, and it is accompanied by preserving mitochondrial population as much as possible close to that resembling the healthy state. It seems that for the same reason even in pathological conditions mitochondria still contain some amount of wild-type DNA, whereas the rest of it undergoes profound structural alterations.
Mitodiversity may argue in favor of functional distribution within the mitochondrial population given a huge variety of such functions [1, 2]. It has been shown that only a part of mitochondria is involved in triggering apoptosis via cytochrome c release [41, 42], i.e. there is a population of the mitochondria that provide energy or signaling or synthetic functions, whereas the killer mitochondria are responsible for physiologically relevant or unwanted cell self-destruction. Thus, some analogy between cellular mitochondria and bees in the bee house comes to mind.
Mitochondrial phenotypic heterogeneity is primarily manifested in the variety of mitochondria’s ultrastructural patterns within the same cell and among the cells [10]. Ultrastructural analyses demonstrated that deenergized mitochondria contain matrix that transforms from the orthodox into a denser condensed state [43, 44]. Our data indirectly confirm this on the basis of the analysis of fluorescence intensity emitted by mitochondrial particles, forward scattering data (corresponding to the size of mitochondria), and side scattering (depicting heterogeneity of the mitochondria’s internal structure). It has been established that the isolated mitochondria possessing higher transmembrane potential (higher TMRE-mediated fluorescence) have higher magnitude of the side scattering in line with the data on mitochondrial ultrastructure. Such a clear direct correlation between heterogeneity of the internal mitochondrial content and transmembrane potential is not an experimental artefact: adding TMRE to the sample does not affect in any way the distribution of the side scattering in comparison to the unstained mitochondria (data not shown). Potentially, such dependence may be already used as a way of indirect mitochondrial membrane potential evaluation, in case other methods, for some reason, are unavailable.
Undoubtedly, a reduced mean of mitochondrial transmembrane potential is caused by ischemic impact on body tissue. Herein, it turns out that apart from the major population (with mean magnitude of TMRE-based fluorescence and side and forward scattering), the isolated mitochondria (even from the kidneys that did not undergo ischemia/reperfusion) contain a population with high transmembrane potential that had slightly bigger size and markedly more pronounced heterogeneity of the internal content, and a population of the low-energized mitochondria having a more homogenous content. It can be assumed that mitochondria with low TMRE-based fluorescence represent the so-called “weak” mitochondria that first lose their transmembrane potential upon ischemic challenge.
Mitochondria isolated from an ischemic organ akin to mitochondria in situ increased heterogeneity manifested in the elevated variation coefficient for TMRE-based fluorescence intensity. On the other hand, mitochondrial heterogeneity was also observed in the control group in vitro. Because the isolation procedure represents a damaging factor to the mitochondria, it is possible that the mitochondria from the control group possess different tolerance to damage at the baseline, which results in broader dispersion within the population from ischemic animals, rarely observed in the control group.
It is known that oxidative stress considerably contributes to the damaging effect of ischemia/reperfusion, thus making it quite reasonable to assume that mitochondrial heterogeneity is also manifested in variations in tolerance to oxidative stress. It is possible that research in this area would provide novel strategies of protecting mitochondria against oxidative stress, when the differences underlying such resistance are determined. Thus, a multi-faceted investigation examining mitodiversity may contribute to revising therapeutic strategies against various pathological processes, particularly, those related to oxidative stress.
The authors congratulate Dr. V. P. Skulachev on his anniversary and wish him many years of fruitful activity in the field of national and world science.
This study was conducted with the financial support from the Russian Science Foundation (Grant No. 14-15-00147).
REFERENCES
1.Zorov, D. B., Krasnikov, B. F., Kuzminova, A. E.,
Vysokikh, M., and Zorova, L. D. (1997) Mitochondria revisited.
Alternative functions of mitochondria, Biosci. Rep., 17,
507-520.
2.Zorov, D. B., Isaev, N. K., Plotnikov, E. Yu.,
Zorova, L. D., Stel’mashuk, E. V., Vasil’eva, A. K.,
Arkhangel’skaya, A. A., and Khryapenkova, T. G. (2007)
Mitochondria as a multi-faced Janus, Biochemistry (Moscow),
72, 1115-1126.
3.Zorov, D. B. (1996) Mitochondrial damage as a
source of diseases and aging: a strategy of how to fight these,
Biochim. Biophys. Acta, 1275, 10-15.
4.Bakeeva, L. E., Chentsov, Yu. S., and Skulachev, V.
P. (1978) Mitochondrial framework (reticulum mitochondriale) in rat
diaphragm muscle, Biochim. Biophys. Acta, 501,
349-369.
5.Amchenkova, A. A., Bakeeva, L. E., Chentsov, Y. S.,
Skulachev, V. P., and Zorov, D. B. (1988) Coupling membranes as
energy-transmitting cables. I. Filamentous mitochondria in fibroblasts
and mitochondrial clusters in cardiomyocytes, J. Cell Biol.,
107, 481-495.
6.Smith, R. A., and Ord, M. J. (1983) Mitochondrial
form and function relationships in vivo: their potential in
toxicology and pathology, Int. Rev. Cytol., 83,
63-134.
7.Wakabayashi, T., Asano, M., and Kurono, C. (1975)
Mechanism of the formation of megamitochondria induced by
copper-chelating agents. I. On the formation process of
megamitochondria in cuprizone-treated mouse liver, Acta Pathol.
Jpn., 25, 15-37.
8.Vorobjev, I. A., and Zorov, D. B. (1983) Diazepam
inhibits cell respiration and induces fragmentation of mitochondrial
reticulum, FEBS Lett., 163, 311-314.
9.Hansford, R. G., and Zorov, D. B. (1998) Role of
mitochondrial calcium transport in the control of substrate oxidation,
Mol. Cell Biochem., 184, 359-369.
10.Zorov, D. B., Plotnikov, E. Yu., Silachev, D. N.,
Zorova, L. D., Pevzner, I. B., Zorov, S. D., Babenko, V. A.,
Yankauskas, S. S., Popkov, V. A., and Savina, P. S. (2014) Microbiota
and mitobiota. Putting an equal sign between mitochondria and bacteria,
Biochemistry (Moscow), 79, 1017-1031.
11.Zorov, D. B., Isaev, N. K., Plotnikov, E. Yu.,
Silachev, D. N., Zorova, L. D., Pevzner, I. B., Morosanova, M. A.,
Yankauskas, S. S., Zorov, S. D., and Babenko, V. A. (2013) Perspectives
of mitochondrial medicine, Biochemistry (Moscow), 78,
979-990.
12.Wikstrom, J. D., Twig, G., and Shirihai, O. S.
(2009) What can mitochondrial heterogeneity tell us about mitochondrial
dynamics and autophagy, Int. J. Biochem. Cell Biol., 41,
1914-1927.
13.Palmer, J. W., Tandler, B., and Hoppel, C. L.
(1977) Biochemical properties of subsarcolemmal and interfibrillar
mitochondria isolated from rat cardiac muscle, J. Biol. Chem.,
252, 8731-8739.
14.Dolman, N. J., Gerasimenko, J. V., Gerasimenko,
O. V., Voronina, S. G., Petersen, O. H., and Tepikin, A. V. (2005)
Stable Golgi-mitochondria complexes and formation of Golgi
Ca2+ gradients in pancreatic acinar cells, J. Biol.
Chem., 280, 15794-15799.
15.Wikstrom, J. D., Katzman, S. M., Mohamed, H.,
Twig, G., Graf, S. A., Heart, E., Molina, A. J., Corkey, B. E., de
Vargas, L. M., Danial, N. N., Collins, S., and Shirihai, O. (2007)
β-Cell mitochondria exhibit membrane potential heterogeneity that
can be altered by stimulatory or toxic fuel levels, Diabetes,
56, 2569-2578.
16.Rizzuto, R., Pinton, P., Carrington, W., Fay, F.
S., Fogarty, K. E., Lifshitz, L. M., Tuft, R. A., and Pozzan, T. (1988)
Close contacts with the endoplasmic reticulum as determinants of
mitochondrial Ca2+ responses, Science, 280,
1763-1766.
17.Kuznetsov, A. V., and Margreiter, R. (2009)
Heterogeneity of mitochondria and mitochondrial function within cells
as another level of mitochondrial complexity, Int. J. Mol. Sci.,
10, 1911-1929.
18.Wolken, G. G., Kostal, V., and Arriaga, E. A.
(2011) Capillary isoelectric focusing of individual mitochondria,
Anal. Chem., 83, 612-618.
19.Csordas, G., Varnai, P., Golenar, T., Roy, S.,
Purkins, G., Schneider, T. G., Balla, T., and Hajnoczky, G. (2010)
Imaging interorganelle contacts and local calcium dynamics at the
ER-mitochondrial interface, Mol. Cell, 39, 121-132.
20.Fuller, K. M., Duffy, C. F., and Arriaga, E. A.
(2002) Determination of the cardiolipin content of individual
mitochondria by capillary electrophoresis with laser-induced
fluorescence detection, Electrophoresis, 23,
1571-1576.
21.Taylor, T. H., Frost, N. W., Bowser, M. T., and
Arriaga, E. A. (2014) Analysis of individual mitochondria via
fluorescent immunolabeling with Anti-TOM22 antibodies, Anal.
Bioanal. Chem., 406, 1683-1691.
22.Izyumov, D. S., Domnina, L. V., Nepryakhina, O.
K., Avetisyan, A. V., Golyshev, S. A., Ivanova, O. Yu., Korotetskaya,
M. V., Lyamzaev, K. G., Pletyushkina, O. Yu., Popova, E. N., and
Chernyak, B. V. (2010) Mitochondria as a source of reactive oxygen
intermediates during oxidative stress. Examination done by using
mitochondria-targeted “Skulachev’s ion”-based
antioxidants, Biochemistry (Moscow), 75, 123-129.
23.Zorov, D. B., Filburn, C. R., Klotz, L. O.,
Zweier, J. L., and Sollott, S. J. (2000) Reactive oxygen species
(ROS)-induced ROS release: a new phenomenon accompanying induction of
the mitochondrial permeability transition in cardiac myocytes, Exp.
Med., 192, 1001-1014.
24.Belousov, V. V., Fradkov, A. F., Lukyanov, K. A.,
Staroverov, D. B., Shakhbazov, K. S., Terskikh, A. V., and Lukyanov, S.
(2006) Genetically encoded fluorescent indicator for intracellular
hydrogen peroxide, Nature Methods, 3, 281-286.
25.Khryapenkova, T. G., Plotnikov, E. Yu.,
Korotetskaya, M. V., Sukhikh, G. T., and Zorov, D. B. (2008)
Heterogeneity of mitochondrial potential as a marker for isolation of a
pure cardiomyoblast population, Klet. Tekhnol. Biol. Med.,
4, 188-195.
26.Sousa, A. P., Amaral, A., Baptista, M., Tavares,
R., Caballero Campo, P., Caballero Peregrin, P., Freitas, A., Paiva,
A., Almeida-Santos, T., and Ramalho-Santos, J. (2011) Not all sperm are
equal: functional mitochondria characterize a subpopulation of human
sperm with better fertilization potential, PLoS One, 6,
e18112.
27.Chen, H. C., Chomyn, A., and Chan, D. C. (2005)
Disruption of fusion results in mitochondrial heterogeneity and
dysfunction, J. Biol. Chem., 280, 26185-26192.
28.Dorn, G. W., 2nd, and Kitsis, R. N. (2015) The
mitochondrial dynamism-mitophagy-cell death interactome: multiple roles
performed by members of a mitochondrial molecular ensemble, Circ.
Res., 116, 167-182.
29.Jakobs, S., Stoldt, S., and Neumann, D. (2011)
Light microscopic analysis of mitochondrial heterogeneity in cell
populations and within single cells, Adv. Biochem. Eng.
Biotechnol., 124, 1-19.
30.Anand, R. K., and Chiu, D. T. (2012) Analytical
tools for characterizing heterogeneity in organelle content, Curr.
Opin. Chem. Biol., 16, 391-399.
31.Jakobs, S., and Wurm, C. A. (2014)
Super-resolution microscopy of mitochondria, Curr. Opin. Chem.
Biol., 20, 9-15.
32.Plotnikov, E. Y., Kazachenko, A. V., Vyssokikh,
M. Y., Vasileva, A. K., Tcvirkun, D. V., Isaev, N. K., Kirpatovsky, V.
I., and Zorov, D. B. (2007) The role of mitochondria in oxidative and
nitrosative stress during ischemia/reperfusion in the rat kidney,
Kidney Int., 72, 1493-1502.
33.Schindelin, J., Arganda-Carreras, I., Frise, E.,
Kaynig, V., Longair, M., Pietzsch, T., Preibisch, S., Rueden, C.,
Saalfeld, S., Schmid, B., Tinevez, J. Y., White, D. J., Hartenstein,
V., Eliceiri, K., Tomancak, P., and Cardona, A. (2012) Fiji: an
open-source platform for biological-image analysis, Nature
Methods, 9, 676-682.
34.Zack, G. W., Rogers, W. E., and Latt, S. A.
(1977) Automatic measurement of sister chromatid exchange frequency,
J. Histochem. Cytochem., 25, 741-753.
35.Shanbhag, A. G. (1994) Utilization of information
measure as a means of image thresholding, Graph. Models Image
Process (Academic Press), 56, 414-419.
36.Biase, F. H., Cao, X., and Zhong, S. (2014) Cell
fate inclination within 2-cell and 4-cell mouse embryos revealed by
single-cell RNA sequencing, Genome Res., 24,
1787-1796.
37.Van Blerkom, J., Davis, P., Mathwig, V., and
Alexander, S. (2002) Domains of high-polarized and low-polarized
mitochondria may occur in mouse and human oocytes and early embryos,
Hum. Reprod., 17, 393-406.
38.Zorov, D. B., Kobrinsky, E., Juhaszova, M., and
Sollott, S. J. (2004) Examining intracellular organelle function using
fluorescent probes: from animalcules to quantum dots, Circ.
Res., 95, 239-252.
39.Summerhayes, I. C., Lampidis, T. J., Bernal, S.
D., Nadakavukaren, J. J., Nadakavukaren, K. K., Shepherd, E. L., and
Chen, L. B. (1982) Unusual retention of rhodamine 123 by mitochondria
in muscle and carcinoma cells, Proc. Natl. Acad. Sci. USA,
79, 5292-5296.
40.Zorov, D. B., Juhaszova, M., and Sollott, S. J.
(2006) Mitochondrial ROS-induced ROS release: an update and review,
Biochim. Biophys. Acta, 1757, 509-517.
41.D’Herde, K., De Prest, B., Mussche, S.,
Schotte, P., Beyaert, R., Coster, R. V., and Roels, F. (2000)
Ultrastructural localization of cytochrome c in apoptosis
demonstrates mitochondrial heterogeneity, Cell Death Differ.,
7, 331-337.
42.Krysko, D. V., Roels, F., Leybaert, L., and
D’Herde, K. (2001) Mitochondrial transmembrane potential changes
support the concept of mitochondrial heterogeneity during apoptosis,
J. Histochem. Cytochem., 49, 1277-1284.
43.Hackenbrock, C. R. (1968) Ultrastructural bases
for metabolically linked mechanical activity in mitochondria. II.
Electron transport-linked ultrastructural transformations in
mitochondria, J. Cell Biol., 37, 345-369.
44.Hackenbrock, C. R. (1972) Energy-linked
ultrastructural transformations in isolated liver mitochondria and
mitoplasts. Preservation of configurations by freeze-cleaving compared
to chemical fixation, J. Cell. Biol., 53, 450-465.