Investigation of the Mesenchymal Stem Cell Compartment by Means of a Lentiviral Barcode Library
A. E. Bigildeev1*, K. Cornils2, T. Aranyossy2, N. V. Sats1, N. A. Petinati1, I. N. Shipounova1, V. L. Surin1, O. S. Pshenichnikova1, K. Riecken2, B. Fehse2, and N. I. Drize1
1Laboratory of Physiology of Hematopoiesis, National Research Center for Hematology, Russian Ministry of Healthcare, 125167 Moscow, Russia; E-mail: bigildeev.ae@gmail.com2Research Department of Cell and Gene Therapy, Department of Stem Cell Transplantation, University Medical Center Hamburg-Eppendorf, Hamburg, Germany
* To whom correspondence should be addressed.
Received August 7, 2015; Revision received December 11, 2015
The hematopoietic bone marrow microenvironment is formed by proliferation and differentiation of mesenchymal stem cells (MSCs). The MSC compartment has been less studied than the hematopoietic stem cell compartment. To characterize the structure of the MSC compartment, it is necessary to trace the fate of distinct mesenchymal cells. To do so, mesenchymal progenitors need to be marked at the single-cell level. A method for individual marking of normal and cancer stem cells based on genetic “barcodes” has been developed for the last 10 years. Such approach has not yet been applied to MSCs. The aim of this study was to evaluate the possibility of using such barcoding strategy to mark MSCs and their descendants, colony-forming units of fibroblasts (CFU-Fs). Adherent cell layers (ACLs) of murine long-term bone marrow cultures (LTBMCs) were transduced with a lentiviral library with barcodes consisting of 32 + 3 degenerate nucleotides. Infected ACLs were suspended, and CFU-F derived clones were obtained. DNA was isolated from each individual colony, and barcodes were analyzed in marked CFU-F-derived colonies by means of conventional polymerase chain reaction and Sanger sequencing. Barcodes were identified in 154 marked colonies. All barcodes appeared to be unique: there were no two distinct colonies bearing the same barcode. It was shown that ACLs included CFU-Fs with different proliferative potential. MSCs are located higher in the hierarchy of mesenchymal progenitors than CFU-Fs, so the presented data indicate that MSCs proliferate rarely in LTBMCs. A method of stable individual marking and comparing the markers in mesenchymal progenitor cells has been developed in this work. We show for the first time that a barcoded library of lentiviruses is an effective tool for studying stromal progenitor cells.
KEY WORDS: mesenchymal stem cell, MSC, colony-forming units of fibroblasts, CFU-Fs, long-term bone marrow culture, LTBMC, barcode, barcoded lentiviral library, LeGO vectorsDOI: 10.1134/S0006297916040076
Abbreviations: ACL, adherent cell layer; CFU-Fs, colony-forming units of fibroblasts; FBS, fetal bovine serum; HSC, hematopoietic stem cell; LTBMC, long-term bone marrow culture; MSC, mesenchymal stem cell; qRT-PCR, quantitative real-time polymerase chain reaction.
Clonal analysis is an important research approach for studying stem
cells in different tissues. On one hand, for this technique it is
necessary to have a universal marker to label all cells in a stem-cell
derived clone. On the other hand, ideally these markers should be
different for distinct stem cells in order to have the possibility to
discriminate them. Methods for individual marking of hematopoietic stem
cells (HSCs) based on the introduction of foreign genes have been
successfully implemented, which allows tracing the fate of individual
HSCs in vivo and in vitro [1-3]. A few years ago, it was suggested to mark cells
with retroviral libraries containing a vast diversity of short
sequences, so called “barcodes”, whose nucleotide
composition would be unique for virtually every virus particle in a
library [4]. Each stem cell marked in this way
obtains a unique, stable, and hereditable marker after provirus
integration. This allows tracing the descendants’ fate of the
marked cell and distinguishing those descendants from others. In
addition, subsequent analysis of such marker does not depend on the
expression of transferred genetic elements. Further optimization of
barcode design, emergence of lentiviral libraries, and the development
of next-generation sequencing technology make it possible to analyze
the diversity of cellular clones within a large population of
hematopoietic and other types of cells [5-10]. Based on the barcoding approach, the
heterogeneity of HSC populations and the existence of age-dependent
differences in these cells could be confirmed [5].
Long-living genetically marked T-cell clones were discovered in
vivo [10]. However, until now genetic marking
with barcodes has not been applied to mesenchymal cells.
In this work, we used barcoding to study the compartment of mesenchymal stem cells (MSCs). The fate of MSCs and their descendant colony-forming units of fibroblasts (CFU-Fs) are not as well defined as for HSCs. It is known that the bone marrow microenvironment contains a subpopulation of MSCs [11] that can differentiate into bone, cartilage, fat, and reticular stroma supporting hematopoiesis [12, 13]. True MSCs are able to transfer the hematopoietic stromal microenvironment in vivo [14]. CFU-Fs reside lower in the hierarchy of mesenchymal progenitor cells. This kind of progenitors can form adherent-to-plastic fibroblast-like cell colonies [15-17] that can differentiate towards stromal lineages after intraperitoneal implantation in diffusion chambers in vivo [18]. However, CFU-Fs have limited proliferative potential and thus cannot transfer the stromal microenvironment [19, 20]. The number of colonies developed in vitro from bone marrow cells is indicative for the concentration of such progenitors in vivo in the total population of stromal cells. It was shown that the CFU-F population is heterogeneous and may contain a hierarchy of progenitors differing in their proliferative potential and consisting of multipotent and committed progenitor cells. No phenotypic marker has yet been identified to discriminate progenitors in this population. CFU-F counting is the most accurate method for estimating the number of stromal progenitors in bone marrow. CFU-F concentration in murine bone marrow varies from 2 to 11 CFU-Fs per 105 nucleated cells depending on the murine strain [21].
Dexter-type long-term bone marrow culture (LTBMC) is a convenient model for studying the contribution of stromal progenitor cells to the formation of the hematopoietic microenvironment [22]. LTBMC consist of adherent cell layer (ACL), which has been forming for two weeks after the explantation of bone marrow plug into a culture flask, and the suspension fraction containing hematopoietic cells. The ACL is formed by MSCs that proliferate and give rise to pluripotent CFU-Fs, which in turn proliferate and differentiate into all cell types of the stromal microenvironment [20]. To specify the role of CFU-Fs in the development of the stromal microenvironment, ACLs were infected with a barcoded lentiviral library. The diversity of barcodes in the library was several orders larger than the number of cells within the LTBMC, thus guaranteeing unambiguous marking of individual cells. CFU-Fs obtained from the ACLs were analyzed individually. Based on this, we show that ACLs are formed due to simultaneous functional activity of many CFU-Fs.
MATERIALS AND METHODS
Animals. Female CBA×C57Bl/6 F1 mouse hybrids at the age of 9-12 weeks were used in this study.
Long-term bone marrow culture. Long-term bone marrow cultures (n = 10) were established and maintained as described [22, 23]. A bone marrow plug from one femur was placed in a flask with 25 cm2 bottom area (T25) in complete medium consisting of Fischer’s medium (ICN, USA), 20% mixture (1 : 2) of fetal bovine serum (FBS) (HyClone, USA) and horse serum (Gibco BRL, USA), 2 mM glutamine (Sigma, USA), antibiotics (Ferein, Russia), and 10–6 M hydrocortisone hemisuccinate (Sigma). The cells had been cultivated at 33°C in a humidified atmosphere with 5% CO2 for four weeks. Half of the medium was collected each week and replaced with new complete medium, the number of hematopoietic cells was counted in the suspension fraction.
Counting non-hematopoietic cell subpopulations in adherent cell layers of LTBMC. ACLs were washed twice with Versene solution and then treated with 0.25% trypsin dissolved in Versene solution. The action of trypsin was inhibited by adding culture medium containing 10% FBS. The resulting cell suspensions were sorted for hematopoietic and nonhematopoietic cells using MACS technology (Miltenyi Biotech, USA). Briefly, magnetic micro particles covered with panleukocytic antigen CD45 were added to the suspension, and labeled cells were processed through LD columns according to the manufacturer’s instructions. CD45+ and CD45– cells were counted. Using this method of separation, cell losses were between 13.9 and 31.4% due to clumping of cell aggregates in the columns. It was virtually impossible to obtain a single-cell suspension with any applied method.
CFU-Fs from adherent cell layers of LTBMCs. For cloning individual CFU-Fs from ACLs, the bottom of each flask was washed twice with Versene solution and then incubated with 0.25% trypsin solution. Detached cells were then suspended in α-MEM medium supplied with 10% FBS. Live cells were counted by trypan blue exclusion (Sigma). For each ACL, 500 live cells were placed per well (n = 60) of a 96-well plate in 150 µl in α-MEM medium supplied with 20% FBS and 5 ng/ml basic fibroblast growth factor (bFGF) kindly provided by Dr. M. E. Gasparyan from the Laboratory of Protein Engineering, Shemyakin and Ovchinnikov Institute of Bioorganic Chemistry of the Russian Academy of Sciences [24]. Plates were investigated using an inverted microscope 7 days later for the presence of clones containing more than 20 cells. The medium was changed, cloning efficiency was calculated, and DNA was isolated from the colonies after an additional 7 days of cultivation. The same lot of bFGF was used for all cloning experiments to ensure comparability of results. The number of mitoses performed by CFU-Fs was calculated as described [25]. Colonies from wells of 96-well plates were treated with trypsin and suspended in culture medium. Cells from each colony were counted and seeded altogether into one well of a 24-well plate. Colonies that reached confluence were transferred into wells of 6-well plates, and finally into T25 culture flasks. As all cells in one colony are descendants of one CFU-F, knowing the final number of cells in the colony we were able to calculate the numbers of mitoses performed by the initial CFU-F using the formula M = log2(N), where M is the number of mitoses, N is the number of cells in a well of a 96-, 24-, or 6-well plate and in a T25 flask.
Barcoded plasmid library. The LeGO-nude-BC32 plasmid library was constructed on the basis of the self-inactivating LeGO vector [26]. The coding sequence of the fluorescent protein was removed, and the barcodes were introduced into the plasmid sequence. They consisted of degenerated nucleotides grouped by two interlacing with constant nucleotides grouped by three [6]; the recently published structure was extended from 16 to 32 random nucleotides (Thielecke et al., manuscript in preparation). Another three degenerated nucleotides were inserted by the authors of the library for the possibility to use the library with next-generation sequencing (NGS) technology. In the context of Sanger sequencing applied to the library in this study, these three nucleotides could be treated as additional nucleotides of a marker distinguishing transduced cells. The theoretical diversity of unique markers in the library is 435 unique sequences.
Obtaining viral supernatant. To generate viral particles, the packaging PhoenixGP cell line was transfected with plasmids phCMVC-VSV-G (R861), pMDLg/pRRE, pRSV-Rev, and LeGO-nude-BC32 using the calcium phosphate method. Details of the plasmids phCMV-VSV-G (R861), pMDLg/pRRE, and pRSV-Rev are available at the Lentiviral Gene Ontology Vectors website (http://www.lentigo-vectors.de/protocols.htm). The LeGO-nude-BC32 plasmid map is shown in Fig. 1. Viral particles were concentrated 100-fold by centrifugation for 3.5 h at 18,000 rpm. Concentrated viral particles were suspended in α-MEM medium supplemented with 1% bovine serum albumin (Sigma) and stored at –70°C.
Fig. 1. LeGO-nude-BC32 plasmid library map.
Determining viral titer. Viral titer in concentrated supernatants was determined by quantitative real-time polymerase chain reaction (qRT-PCR). PhoenixGP cells were transduced by viral supernatant in 10-fold limiting dilutions. Dilutions were within the range 10-100,000-fold. Viral particles were added for 24 h in α-MEM medium supplemented with 10% FBS and 8 µg/ml polybrene (Sigma), and then the culture medium was decanted and replaced completely by fresh medium. DNA was isolated 72 h later from 106 cells by a standard protocol with proteinase K and phenol deproteinization. qRT-PCR was done using primers CCTTGTATAAATCCTGGTTGCTGTCT (forward), GGAAAGGAGCTGACAGGTGGT (reverse), and hydrolyzing probe R6G-TCAGGCAACGTGGCGTGGTGTG-BHQ1 complementary to the wPRE region of the LeGO-nude-BC32 plasmid. A standard curve was calculated using the initial plasmid library. The library was diluted to concentration 108 copies/µl and then down to 104 copies/µl with 10-fold steps. To approximate PCR conditions used to obtain standard curve to those of experimental samples, PhoenixGP genomic DNA was added to each library dilution in an amount corresponding to the mean amount of DNA isolated from 105 cells. qRT-PCR of experimental samples was performed. Knowing the volume of viral supernatant used to infect the cells, the viral titer was calculated in units “infectious particles/ml” using the standard curve.
Infection of LTBMCs by lentiviral library. To infect LTBMCs with the lentiviral library, the medium was completely decanted two weeks after establishing the cultures, 107 viral particles being added to each ACL in α-MEM medium supplemented with 10% FBS and 8 µg/ml polybrene. Six hours later the medium was replaced by 10 ml of fresh complete medium. The cells were cultured for another two weeks, and then the CFU-Fs were cloned from infected individual ACLs as described previously.
Analysis of barcodes. DNA isolated from stromal colonies was assessed for the presence of the marker by means of traditional PCR with primers flanking the barcode region: forward primer BC-PCR-FW: 5′-CATCGATACCGTCGACCTC, reverse primer BC-PCR-RV_MV: 5′-TCGTTGGGAGTGAATTAGCC. PCR was performed using the following cycling conditions: 3 min denaturation at 95°C, 35 cycles of 30 s denaturation at 95°C, 30 s annealing at 60°C, 60 s elongation at 72°C; 1 cycle of 5 min elongation at 72°C. The PCR products were analyzed in 1.5% agarose gel electrophoresis. Samples containing provirus DNA were counted, and the efficiency of marking of CFU-Fs was calculated. Gel regions containing the products of correct length (396 bp) were excised. DNA was isolated from slices using SV Gel and PCR Clean-Up Wizard Kit (Promega, USA). Nucleotide sequences of barcodes were determined by Sanger’s method. If two or more barcodes were present simultaneously in one DNA sample, PCR was repeated in two stages. Universal primers flanking the barcode region were used for the first-stage PCR, which was performed using the following conditions: 3 min denaturation at 95°C, 25 cycles of 30 s denaturation at 95°C, 30 s annealing at 60°C, 60 s elongation at 72°C; 1 cycle of 5 min elongation at 72°C. The resulting PCR mixture was diluted 1 : 250 and used for the second PCR stage as the DNA source. The second PCR stage was semi-nested. The same forward primer was used for the second stage. The reverse primer used in the second stage was shifted inside. It represented a mixture of four primers with a degenerated nucleotide at the 3′-end (GCTCTTCCGATCTCTCGAGN), which was the last degenerated nucleotide of the barcode region. Sometimes we used the opposite arrangement of primers for the second PCR: the reverse primer was the same as for the first PCR, and the forward primer was shifted inside with the last nucleotide at the 3′-end being degenerated and representing the first degenerated nucleotide of the barcode. The second PCR was performed using the following conditions: 3 min denaturation at 95°C, 30 cycles of 30 s denaturation at 95°C, 30 s annealing at 60°C, 60 s elongation at 72°C; 1 cycle of 5 min elongation at 72°C. The PCR products were isolated by electrophoresis, and their nucleotide sequences were determined as described above.
The barcodes were analyzed with Arlequin v.3.5.1.3 software [27]. Numbers of pairwise nucleotide differences between the barcode and each other barcode from the corresponding group were calculated for each barcode.
Statistical analysis. Student’s t-test was applied for statistical analysis. Clonal efficiency was calculated by the Poisson formula.
RESULTS
Determining barcoded lentiviral library titer. Viral titer was determined by qRT-PCR with primers complementary to the wPRE region of the provirus. A standard curve was created based on limiting dilutions of the initial barcoded plasmid library (Fig. 2).
Fig. 2. Standard curve for determining viral titer.
The viral titer calculated using this standard curve was 5·106 infectious particles/ml.
Infection of LTBMCs by lentiviral library. Cultures were infected with the lentiviral library two weeks after bone marrow explantation into the flasks. This time point was chosen as the most effective for marking ACL cells [28]. All 10 LTBMCs appeared to be infected. We did not manage to determine the proportion of infected cells unambiguously, but all LTMBCs bore marker sequences two weeks after infection as determined by PCR with the primers complementary to the wPRE region of the provirus. In experimental series with lentiviruses constructed from the same packaging plasmids phCMVC-VSV-G (R861), pMDLg/pRRE, and pRSV-Rev and a plasmid based on the same LeGO vector but bearing eGFP sequence instead of the barcode region, it was shown that infection efficiency depended on the cell type infected. The infection efficiency was 78 ± 6.4% for human multipotent mesenchymal stromal cells [29], 46.6 ± 4.1% for rabbit multipotent mesenchymal stromal cells [30], and 43.3 ± 11.0% for murine ACL cells of LTBMCs [31]. In the case of murine ACL cells, a vast diversity in infection rates between 15 and 87% (median 26.4%) was noted. Taking into account that the conditions of infection were standard in those experiments, it was reasonable to expect no less than 10-15% infection efficiency in this experiment.
To evaluate the possibility of dramatic changes in the properties of stromal cells due to infection, we analyzed the cellular composition of infected as compared to control ACLs derived in parallel.
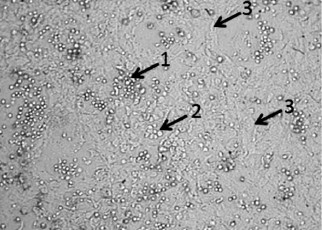
Cellular composition analysis of ACLs. Four weeks after bone marrow explantation into culture (i.e. two weeks after infection), the average number of cells in ACLs was (1.46 ± 0.12)·106 per flask. Hematopoietic cells were always present in ACLs of LTBMCs, and they could not be completely washed away by Versene treatment (Fig. 3). Separation of ACL cells into hematopoietic and non-hematopoietic cells showed that the ACLs comprised 37.1 ± 8.9% CD45– cells, i.e. each ACL consisted of (0.54 ± 0.11)·106 stromal cells on average.
Fig. 3. ACL of LTBMC twice washed with Versene solution. The picture was taken using an inverted microscope (magnification power ×10). Arrows indicate different cell types present in ACLs: 1) hematopoietic cells; 2) cobblestone area forming cells; 3) stromal cells.
Detached ACL cells were seeded at 500 cells per well in 96-well plates. Cloning efficiency of CFU-Fs from 10 studied ACLs of infected LTBMCs was 0.96 ± 0.08. This indicates that practically one out of 500 stromal cells in an ACL could give rise to a colony. Consequently, each 4-week-old ACL contained about 1000 CFU-Fs.
It is well known that the CFU-F population in bone marrow is heterogeneous. These progenitors differ in their proliferative potential and are not able to transfer the stromal microenvironment, i.e. they do not contain MSCs. Proliferative potential analysis of CFU-Fs from infected ACLs showed that the maximum number of mitoses that could be performed by a single CFU-F was 18, but only 10% of the CFU-Fs analyzed were able to go through this number of mitoses (Fig. 4). Two thirds of CFU-F population could not perform more than 14 mitoses; their colonies did not reach confluence in single wells of a 96-well plate. This indicates that growth of those colonies was limited by their intrinsic proliferative potential rather than contact inhibition.
Fig. 4. Distribution of CFU-Fs obtained from LTBMCs by their proliferative activity.
We concluded that infection of ACLs with the lentiviral library did not dramatically change the basic properties of the stromal progenitor cells, which is also confirmed by the ability of infected cultures to maintain hematopoiesis in culture (Fig. 5).
Fig. 5. Cumulative cell production of hematopoietic cells in LTBMCs by infected ACLs.
Analysis of the cumulative gain of hematopoietic cells in the suspension fraction showed that the infection of LTBMCs by the lentiviral library did not change total cell production. Hematopoietic progenitor cells continued to differentiate in suspension fraction in the same way as in LTBMCs that were not infected by lentiviral vectors.
Analysis of barcodes. The analysis of CFU-Fs from 4-week-old LTBMCs marked by the lentiviral library revealed that 73.7 ± 5.1% of colonies contained barcode sequences. Nucleotide sequences of barcodes were determined in 67 ± 10% of the marked colonies. Overall, 125 DNA samples contained one barcode; 22 samples, two; and 7 samples, three barcodes. All analyzed colonies had distinct barcodes.
To characterize the initial library, Hamming distance, which indicates the number of pairwise nucleotide differences among all determined barcodes, was calculated. The minimal Hamming distance between barcodes was 11, and the maximal Hamming distance was 35. On average, each identified barcode differed from the other barcodes by 24.2 ± 3.4 nucleotides. These data indicate that the diversity of the barcodes within the used library is huge, indicating its suitability for marking large populations of cells. The results for each LTBMC are presented in the table.
Results of barcode analysis in CFU-F-derived colonies obtained from
LTBMCs
If two or more barcodes were present in one CFU-F, two stages of PCR were used with semi-nested primers. One of the primers at the second stage was degenerated at its 3′-end. PCR products were repeatedly sequenced to discriminate nucleotides of each barcode. This approach was applied to the first three libraries. Fifteen additional barcodes were revealed, their sequences being distinct from each other and from other barcodes in the corresponding libraries. The presence of several barcodes in one CFU-F can be explained by either the integration of more than one provirus in a genome of a given CFU-F, or the presence of more than one clone in one well of the 96-well plate. The latter is theoretically possible, since cloning was done seeding 500 cells per well in view of the expected cloning efficiency.
Based on the observed large Hamming distances between individual markers (table), the generation of artificial barcodes during analysis (e.g. by PCR) can be excluded. The presented results of statistical analysis prove that each identified barcode in all 10 independent LTBMCs is unique. We conclude that the method developed in this work is suitable for the identification and comparison of individual mesenchymal progenitors – CFU-Fs. The diversity of CFU-Fs was revealed in two-week-old LTMBCs. This supports the fact that ACLs contain a variety of progenitors that could give rise to clones in culture.
There were no two colonies containing the same barcode. This could be interpreted in several ways. First, it could be due to the low multiplicity of infection (MOI) applied. Second, this could be explained by the fact that only 4% of all CFU-Fs present in each ACL were investigated. Lastly, this finding could indicate that ACLs did not contain progenitors able to give rise to more than one CFU-F at the time of infection. No MSCs capable of giving several colonies in these experiments were revealed.
DISCUSSION
In this work, we for the first time marked stromal progenitor cells with a barcoded lentiviral library. It was found that infection of ACLs of LTBMCs is efficient. This allowed investigation of the MSC compartment at the level of individual progenitor cells. One third of all the cells within ACLs were CD45–, the other cells having hematopoietic origin. Based on this and on the efficiency of cloning of CFU-Fs from ACLs, it is possible to conclude that one ACL obtained from one murine femur contains about 1000 CFU-Fs. For many years LTBMCs were used as a model for studying hematopoiesis in vitro. It was necessary to compare LTBMCs and corresponding bone marrow characteristics to test the possibility of using the LTBMC model to study stromal precursor cells. The CFU-F concentration is 3-11 CFU-Fs per 105 cells in bone marrow. The average concentration is 50 CFU-Fs per 106 bone marrow cells [21, 29]. Depending on animal strain, age, and method of bone marrow isolation, it is possible to obtain (20-40)·106 cells from one tibia, i.e. 1000 to 2000 CFU-Fs are contained in one femur. Taking into account that only 5% of cells in bone marrow are stromal cells [32], the number of CFU-Fs in ACL obtained from a femur and the number of CFU-Fs residing in the bone marrow of a femur is similar. Hence, LTBMCs can be used as an adequate model for studying the composition and function of the stromal microenvironment.
ACLs of LTBMCs contain mature differentiated cells as well as mesenchymal progenitor cells of different maturity states. The distribution of CFU-Fs by their proliferative potential also showed that the LTBMC model is adequate for studying hierarchy and organization of the MSC compartment in bone marrow. A similar distribution of mesenchymal progenitor cells based on their proliferative potential was revealed in a study analyzing human bone marrow mesenchymal progenitor cells. In that study, it was shown that only 7% of the cells had high proliferative potential, 29% had low proliferative potential, and 26% could form only clusters of cells [33]. Importantly, the distribution of progenitor cells according to their proliferative potential in our study indicates that infection of LTBMCs by the barcoded lentiviral library did not dramatically change their properties.
Lentiviruses can infect not only dividing cells, but also dormant cells, among which could be progenitor cells. High efficiency of CFU-F marking revealed two weeks after infection indicates the possibility of using this approach to study stromal progenitor cells. The proportion of marked CFU-Fs in this experiment was substantially higher than in earlier experiments. Infection of LTBMCs by a lentivector bearing an eGFP marker gene allowed direct analysis of the proportion of infected and thus fluorescent cells; this showed that the proportion of marked cells was 43.3 ± 11.0% among all cells in ACLs, and it was 32.0 ± 4.3% among CFU-Fs [31]. Only the cells expressing eGFP were taken into account in those experiments, whereas in some cells integrated provirus was found in the absence of eGFP expression. Such cells could not be detected based on fluorescence, and therefore the calculated proportion of infected cells could be underestimated.
The analysis of barcode sequences in marked fibroblast colonies revealed that a vast diversity of CFU-Fs differing by the barcodes were present in ACLs of LTBMCs. Barcodes present in more than one colony were not revealed. These results indicate that ACLs are formed as a result of functioning of many CFU-Fs. The absence of identical barcodes might well be explained by the fact that only 36 ± 2 CFU-Fs out of 1000, that is about 4%, were analyzed from each ACL. Consequently, colonies containing the same barcodes could not get into the analysis. Alternatively, two and more CFU-Fs obtained from the same marked MSC could not be revealed, as CFU-Fs are descendants of MSCs, which probably did not divide or divided very rarely between the infection (two weeks after the explantation of bone marrow into the flasks) and cloning (four weeks after the explantation of bone marrow into the flasks).
The results of this work demonstrate that during ACL development, independent clonogenic progenitors able to form a hematopoietic microenvironment are present in culture as early as two weeks after explantation of bone marrow. The ACLs are completely formed four weeks after bone marrow explantation into culture [23]. The presence of independently marked CFU-Fs suggests that the revealed CFU-Fs proliferate and differentiate into mature cells in ACLs. Consequently, we have shown for the first time that CFU-Fs are not precursors revealed only in vitro, but they actually take part in the formation of the stromal microenvironment.
The data also indicates that marking of LTBMCs by a lentiviral library does not change basic physiological properties of stromal precursor cells. The infected culture successfully supported hematopoiesis, CFU-Fs in ACLs proliferated and differentiated, and their proliferative potential did not drastically differ from that found in vivo. This study showed that marking of stromal progenitors in LTBMCs by a barcoded lentiviral library is an effective and adequate instrument for studying stromal precursor cells. Combining this approach with next-generation sequencing (NGS) techniques will help to unravel the hierarchy in the MSC compartment, specifying their clonal composition in bone marrow, and determining the proliferative potential of CFU-Fs and their contribution to the formation of the bone marrow stromal microenvironment.
This study was financially supported by the Russian Foundation for Basic Research (project No. 13-04-00085).
Development and generation of the barcode library was supported by the German Research Foundation (DFG) (FE568/11-2 to B. Fehse) and German Cancer Aid (No. 110619 to K. Cornils and B. Fehse).
REFERENCES
1.Drize, N. J., Keller, J. R., and Chertkov, J. L.
(1996) Local clonal analysis of the hematopoietic system shows that
multiple small short-living clones maintain life-long hematopoiesis in
reconstituted mice, Blood, 88, 2927-2938.
2.Kustikova, O. S., Baum, C., and Fehse, B. (2008)
Retroviral integration site analysis in hematopoietic stem cells,
Methods Mol. Biol., 430, 255-267.
3.Bystrykh, L. V., Verovskaya, E., Zwart, E.,
Broekhuis, M., and De Haan, G. (2012) Counting stem cells:
methodological constraints, Nat. Methods, 9, 567-574.
4.Gerrits, A., Dykstra, B., Kalmykowa, O. J., Klauke,
K., Verovskaya, E., Broekhuis, M. J. C., and Bystrykh, L. V. (2010)
Cellular barcoding tool for clonal analysis in the hematopoietic
system, Blood, 115, 2610-2618.
5.Verovskaya, E., Broekhuis, M. J. C., Zwart, E.,
Ritsema, M., Van Os, R., De Haan, G., and Bystrykh, L. V. (2013)
Heterogeneity of young and aged murine hematopoietic stem cells
revealed by quantitative clonal analysis using cellular barcoding,
Blood, 122, 523-532.
6.Cornils, K., Thielecke, L., Huser, S., Forgber, M.,
Thomaschewski, M., Kleist, N., Hussein, K., Riecken, K., Volz, T.,
Gerdes, S., Glauche, I., Dahl, A., Dandri, M., Roeder, I., and Fehse,
B. (2014) Multiplexing clonality: combining RGB marking and genetic
barcoding, Nucleic Acids Res., 42, e56.
7.Glimm, H., Ball, C. R., and Von Kalle, C. (2011)
You can count on this: barcoded hematopoietic stem cells, Cell Stem
Cell, 9, 390-392.
8.Maetzig, T., Brugman, M. H., Bartels, S., Heinz,
N., Kustikova, O. S., Modlich, U., Li, Z., Galla, M., Schiedlmeier, B.,
Schambach, A., and Baum, C. (2011) Polyclonal fluctuation of lentiviral
vector-transduced and expanded murine hematopoietic stem cells,
Blood, 117, 3053-3064.
9.Lu, R., Neff, N. F., Quake, S. R., and Weissman, I.
L. (2011) Tracking single hematopoietic stem cells in vivo using
high-throughput sequencing in conjunction with viral genetic barcoding,
Nat. Biotechnol., 29, 928-933.
10.Biasco, L., Scala, S., Basso Ricci, L., Dionisio,
F., Baricordi, C., Calabria, A., Giannelli, S., Cieri, N., Barzaghi,
F., Pajno, R., Al-Mousa, H., Scarselli, A., Cancrini, C., Bordignon,
C., Roncarolo, M. G., Montini, E., Bonini, C., and Aiuti, A. (2015)
In vivo tracking of T cells in humans unveils decade-long
survival and activity of genetically modified T-memory stem cells,
Sci. Transl. Med., 7, doi:
10.1126/scitranslmed.3010314.
11.Caplan, A. I. (1991) Mesenchymal stem cells,
J. Orthop. Res., 9, 641-650.
12.Bianco, P., and Robey, P. G. (2000) Marrow
stromal stem cells, J. Clin. Invest., 105, 1663-1668.
13.Owen, M., and Friedenstein, A. J. (1988) Stromal
stem cells: marrow-derived osteogenic precursors, Ciba Found.
Symp., 136, 42-60.
14.Chertkov, J. L., and Gurevitch, O. A. (1984)
Hematopoietic Stem Cell and Its Microenvironment [in Russian],
Meditsina, Moscow.
15.Friedenstein, A. J., Chailakhjan, R. K., and
Lalykina, K. S. (1970) The development of fibroblast colonies in
monolayer cultures of guinea-pig bone marrow and spleen cells, Cell
Tissue Kinet., 3, 393-403.
16.Friedenstein, A. J., Gorskaja, J. F., and
Kulagina, N. N. (1976) Fibroblast precursors in normal and irradiated
mouse hematopoietic organs, Exp. Hematol., 4,
267-274.
17.Kuznetsov, S. A., Friedenstein, A. J., and Robey,
P. G. (1997) Factors required for bone marrow stromal fibroblast colony
formation in vitro, Br. J. Haematol., 97,
561-570.
18.Friedenstein, A. J., Chailakhyan, R. K., and
Gerasimov, U. V. (1987) Bone marrow osteogenic stem cells: in
vitro cultivation and transplantation in diffusion chambers,
Cell Tissue Kinet., 20, 263-272.
19.Chertkov, J. L., Drize, N. J., Gurevitch, O. A.,
and Udalov, G. A. (1983) Hemopoietic stromal precursors in long-term
culture of bone marrow: I. Precursor characteristics, kinetics in
culture, and dependence on quality of donor hemopoietic cells in
chimeras, Exp. Hematol., 11, 231-242.
20.Nifontova, I. N., Svinareva, D. A., and Drize, N.
J. (2008) Stromal clonogenic precursors of hemopoietic microenvironment
and their rank in the hierarchy of mesenchymal stem cells, Bull.
Exp. Biol. Med., 145, 544-547.
21.Kuznetsov, S. A., Mankani, M. H., Bianco, P., and
Robey, P. G. (2009) Enumeration of the colony-forming units-fibroblast
from mouse and human bone marrow in normal and pathological conditions,
Stem Cell Res., 2, 83-94.
22.Dexter, T. M., Allen, T. D., and Lajtha, L. G.
(1977) Conditions controlling the proliferation of haemopoietic stem
cells in vitro, J. Cell. Physiol., 91,
335-344.
23.Chertkov, J. L., Drize, N. J., and Gurevitch, O.
A. (1983) Hemopoietic stromal precursors in long-term culture of bone
marrow: II. Significance of initial packing for creating a hemopoietic
microenvironment and maintaining stromal precursors in the culture,
Exp. Hematol., 11, 243-248.
24.Gasparian, M. E., Elistratov, P. A., Drize, N.
I., Nifontova, I. N., Dolgikh, D. A., and Kirpichnikov, M. P. (2009)
Overexpression in Escherichia coli and purification of human
fibroblast growth factor (FGF-2), Biochemistry (Moscow),
74, 221-225.
25.Bigildeev, A. E., Zhironkina, O. A., Shipounova,
I. N., Sats, N. V., Kotyashova, S. Y., and Drize, N. I. (2012) Clonal
composition of human multipotent mesenchymal stromal cells, Exp.
Hematol., 40, 847-856.
26.Weber, K., Bartsch, U., Stocking, C., and Fehse,
B. (2008) A multicolor panel of novel lentiviral “gene
ontology” (LeGO) vectors for functional gene analysis, Mol.
Ther., 16, 698-706.
27.Excoffier, L., and Lischer, H. E. (2010) Arlequin
suite ver 3.5: a new series of programs to perform population genetics
analyses under Linux and Windows, Mol. Ecol. Resour., 10,
564-567.
28.Sats, N. V., Shipunova, I. N., Bigil’deev,
A. E., Kostyushev, D. S., and Drize, N. I. (2015) Peculiarities of gene
transfer into mesenchymal stem cells, Bull. Exp. Biol. Med.,
159, 134-137.
29.Sats, N. V., Shipounova, I. N., Bigildeev, A. E.,
Svinareva, D. A., Zhironkina, O. A., and Drize, N. J. (2010)
Characteristics of mesenchymal stromal precursor cells labeled with
lentiviral vector in long-term bone marrow culture, Bull. Exp. Biol.
Med., 150, 109-112.
30.Mamonov, V. E., Shipounova, I. N., Sats, N. V.,
Bigildeev, A. E., Svinareva, D. A., Proskurina, N. V., Riashentsev, M.
M., Chemis, A. G., and Drize, N. I. (2012) Participation of cultured
mesenchymal multipotent stromal cells in regeneration of a large
persisting defect of rabbit radius bone, Open Tissue Eng. Regen.
Med. J., 5, 1-8.
31.Zhironkina, O. A., Shipounova, I. N., Bigildeev,
A. E., Sats, N. V., Petinati, N. A., and Drize, N. I. (2012)
Proliferative potential of multipotent mesenchymal stromal cells from
human bone marrow, Bull. Exp. Biol. Med., 152,
543-547.
32.Simmons, P. J., and Torok-Storb, B. (1991)
Identification of stromal cell precursors in human bone marrow by a
novel monoclonal antibody, STRO-1, Blood, 78, 55-62.
33.Lee, M. W., Kim, D. S., Yoo, K. H., Kim, H. R.,
Jang, I. K., Lee, J. H., Jung, H. L., Sung, K. W., and Koo, H. H.
(2013) Human bone marrow-derived mesenchymal stem cell gene expression
patterns vary with culture conditions, Blood Res., 48,
107-114.