Pseudogene PTENP1 Functions as a Competing Endogenous RNA (ceRNA) to Regulate PTEN Expression by Sponging miR-499-5p
Lei Wang1#*, Ning Zhang2#, Zun Wang1, Dong-mei Ai1, Zhen-yu Cao1, and Hua-ping Pan3*
1Nanjing University of Chinese Medicine, Second Medical School, Department of Rehabilitation Medicine, 210023 Nanjing, China; E-mail: Wanglei150306@163.com2Nanjing University Medical School, Nanjing Drum Tower Hospital, Department of Cardiology, 210093 Nanjing, China
3Affiliated Jiangning Hospital of Nanjing Medical University, Department of Rehabilitation Medicine, 211100 Nanjing, China; E-mail: panhuaping160411@163.com
# These authors contributed equally to this work.
* To whom correspondence should be addressed.
Received February 3, 2016; Revision received March 22, 2016
Increasing evidence has shown that pseudogenes can widely regulate gene expression. However, little is known about the specific role of PTENP1 and miR-499-5p in insulin resistance. The relative transcription level of PTENP1 was examined in db/db mice and high fat diet (HFD)-fed mice by real-time PCR. To explore the effect of PTENP1 on insulin resistance, adenovirus overexpressing or inhibiting vectors were injected through the tail vein. Bioinformatics predictions and a luciferase reporter assay were used to explore the interaction between PTENP1 and miR-499-5p. The relative transcription level of PTENP1 was largely enhanced in db/db mice and HFD-fed mice. Furthermore, the overexpression of PTENP1 resulted in impaired Akt/GSK activation as well as glycogen synthesis, while PTENP1 inhibition led to the improved activation of Akt/GSK and enhanced glycogen contents. More importantly, PTENP1 could directly bind miR-499-5p, thereby becoming a sink for miR-499-5p. PTENP1 overexpression results in the impairment of the insulin-signaling pathway and may function as a competing endogenous RNA for miR-499-5p, thereby contributing to insulin resistance.
KEY WORDS: PTENP1, ceRNA, PTEN, miR-499-5pDOI: 10.1134/S0006297916070105
Abbreviations: ceRNA, competing endogenous RNA; db/db mouse, mouse with db/db mutation, a model for diabetic dyslipidemia; GFP, green fluorescent protein; GTT, glucose tolerance test; HFD, high fat diet; ITT, insulin tolerance test; lncRNAs, long noncoding RNAs; miRNA (miR), microRNAs; PTENP1, phosphatase and tensin homolog pseudogene 1; 3′-UTR, 3′-untranslated region; WT, wild-type.
MicroRNAs (miRNA, miR) are small noncoding RNAs having approximately 22
nucleotides [1]. In previous years, miRNAs have
been implicated in playing key roles in regulating gene expression [2, 3]. By binding to the
3′-untranslated region, miRNAs widely suppress gene expression
[4]. A single miRNA can have various target genes,
which allows it to participate in various physiological processes [4, 5].
At present, only a few pseudogenes or long noncoding RNAs (lncRNAs) have been well studied. They are found to widely regulate gene expression through different mechanisms, such as chromatin modification and posttranscriptional processing [6, 7]. Recently, a new regulatory network among lncRNA, mRNA, and miRNA has been elucidated [8]. In this case, lncRNA and the corresponding mRNA can bind a common miRNA, thereby exerting a different post-regulatory mechanism [9]. Lin-MD1, a muscle specific lncRNA, was reported to be a competing endogenous RNA (ceRNA) that protects MyoD mRNA from miRNA-mediated degradation [10]. Furthermore, lncRNA-RoR was also identified as a ceRNA that regulates the transcription of Oct4, Sox2, and Nanog in human embryonic stem cells [11]. A posttranscriptional network of ceRNA widely exists in the genome.
PTENP1 is a pseudogene located at 9p13.3 and shares high similarity with PTEN [12]. The 3′-untranslated region (3′-UTR) of PTENP1 is approximately 1 kb shorter than that in PTEN [13]. Within the 3′-UTR, some perfectly conserved seed matches were found for PTEN and PTENP1, such as miR-17, miR-19, and miR-214 [12]. These data indicate that PTEN and PTENP1 are regulated by miRNA-mediated posttranscriptional regulation. In a previous study, we found a new miRNA, miR-499-5p, that targets PTEN [14]. However, no studies have been conducted on the role of miR-499-5p on PTENP1 as well as the regulation network between PTEN and PTENP1. Thus, in this study we focused on exploring the effects of miR-499 on PTENP1 in an insulin model.
MATERIALS AND METHODS
Animal treatment. db/db mice were obtained from the Peking University Health Science Center. The db/db mice (n = 5) and age-matched wild-type (WT) mice (n = 5) were fed a standard laboratory diet for four weeks.
Four-week-old male C57BL/6J mice were also purchased from the Peking University Health Science Center. The C57BL/6J mice were fed a standard laboratory diet or high-fat diet for 10 weeks in a temperature- and humidity-controlled environment. A 12 h/12 h light/dark cycle was maintained. The C57BL/6J mice fed the high-fat diet (HFD-fed mice) were injected intravenously through the tail vein with adenovirus expressing shPTENP1 or with a negative control adenovirus vector. The dose of the virus was 109 PFU/50 g body weight. The mice were anesthetized on day 7 after adenovirus injection, and their blood was collected. The livers of the mice were fixed with 4% ice-cold paraformaldehyde and coated in SAKURA Tissue-Tek O.C.T. Compound (USA). Sections were cut at thickness of 10 µm and used for immunofluorescence studies. The Animal Ethics Committee at the Second Medical School of Nanjing University of Chinese Medicine approved the mouse protocols.
Adenovirus vector construction. The recombinant adenoviruses shPTENP1 (ad-shPTENP1) and ad-PTENP1 and the negative control adenovirus vector containing GFP (ad-con) were purchased from Shanghai Ribo Biotech Co., Ltd.
Metabolic phenotyping (body weight, GTT, ITT). The body weight of the mice was measured twice weekly throughout the study. An intraperitoneal insulin tolerance test (ITT) using a dose of 0.5 U/kg insulin (Insuman® Rapid; Sanofi Aventis, Germany) and an intraperitoneal glucose tolerance test (GTT) with 1 g/kg glucose (Glucosteril; Fresenius, Bad Homburg, Germany) were performed in 12 h fasted mice, respectively. Tail vein blood was used to measure the glucose concentration with a glucometer (Precision Xceed; Abbott, Germany) at the indicated time points.
Cell culture. The murine liver cell line NCTC1469 was cultured in Dulbecco’s Modified Eagle’s Medium (DMEM) supplemented with 10% (v/v) horse serum (Atlanta Biolabs, USA), 100 units/ml penicillin, and 100 µg/ml streptomycin (Life Technologies, Inc., USA) at 37°C in a humidified atmosphere with 5% CO2.
RNA isolation and real-time PCR. Total RNA was extracted from NCTC1469 cells using TRIzol (Invitrogen, USA) according to the manufacturer’s instructions. The quality of the RNA samples was monitored by analysis of OD260/OD280.
To measure the level of miR-499-5p and PTENP1, a quantitative 2-step RT-PCR assay was performed using SYBR Green Supermix (Bio-Rad, USA) in a Bio-Rad iCycler iQ Real-Time PCR Detection System [13] (table).
Primers used in this study
Western blot analysis. Ten milligrams of the liver samples or cells were extracted using RIPA buffer (SolarBio, China). The lysates were separated using 10% SDS-PAGE. The lysates were then transferred to PVDF membranes (Millipore, USA), blocked with 8% nonfat dry milk, and probed with antibodies at 4°C overnight. The blots were incubated with HRP-conjugated anti-IgG, and then the antibody was detected with ECL (Millipore). Antibodies against PTEN, phosphorylated AKT, GAPDH, GSK, and phosphorylated GSK were purchased from CST. The appropriate HRP-conjugated anti-rabbit IgG secondary antibody (Zhongshanjinqiao, China; all at 1 : 5000) was subsequently applied, and immunodetection was performed using the ECL Plus detection system (Millipore) according to the instructions from the manufacturer. GAPDH was used as an internal control.
Luciferase assay. For the luciferase assay, the 3′-UTR of PTENP1 including the binding sites for miR-499-5p was amplified using NCTC1469 cells. PCR was performed with the genomic DNA isolated from NCTC1469 cells, and then the PCR product was digested with XhoI (NEB, USA). Then the fragment was inserted into the XhoI-linearized pmirGLO (Promega, USA) luciferase reporter vector. To ensure ligation efficiency, the XhoI-linearized pmirGLO vectors were treated with thermosensitive alkaline phosphatase (NEB) at 80°C for 20 min. The details of the PCR procedures are described as follows: a hot start step at 95°C for 10 min, followed by 40 cycles at 95°C for 15 s, 55°C for 45 s, and 72°C for 30 s. The luciferase reporter assay was performed using the Dual-Glo Luciferase assay system (Promega).
Determination of glycogen content. After treatment with 1 nM insulin for 3 h, the glycogen content in the NCTC1469 cells was determined using a glycogen assay kit (Nanjing Jiancheng Bioengineering Institute, China) according to the manufacturer’s instructions. In brief, the cells or 5 mg of liver tissues were incubated with 0.5 ml of 30% KOH saturated with Na2SO4 for 30 min at 100°C. After cooling, the glycogen was precipitated with 0.55 ml of 100% ethanol at 0°C for 30 min. The glycogen was centrifuged at 1000g for 30 min at 4°C. The pellet was dissolved in 3 ml H2O. Aliquots were incubated for 20 min at 30°C with 0.7% phenol and 70% H2SO4, and absorbance was measured at 490 nm. Mussel glycogen (Roche Biochemicals, France) was used as a standard.
Transfection of miRNA mimetics or inhibitor. Mimetics of miR-499-5p, an inhibitor, and a negative control (NC) were purchased from GenePharma and transfected into NCTC1469 cells at final concentration of 50 nM. The HiPerFect transfection reagent used for transfection was purchased from Qiagen.
Statistics. The data are represented as the mean ± standard error (SE) of the indicated number of measurements. The differences were analyzed by unpaired Student’s t-test with significance set at p < 0.05.
RESULTS
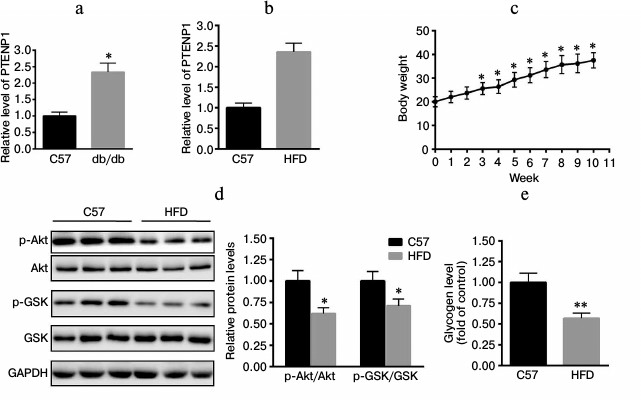
PTENP1 is upregulated in db/db mice and HFD-fed mice. The relative transcription level of PTENP1 was determined in livers of mice using RT-qPCR. As shown in Fig. 1a, PTENP1 was significantly upregulated in the livers of db/db mice. Furthermore, C57 mice were fed a HFD for 10 weeks. We determined the relative transcription level of PTENP1 in the livers of the HFD-fed mice and found it was increased (Fig. 1b). The body weight of HFD-fed mice increased over 10 weeks too (Fig. 1c). We also explored the insulin-signaling pathway in the livers of HFD-fed mice and found that Akt/GSK activation was significantly reduced (Fig. 1d). In addition, hepatic glycogen contents were also decreased (Fig. 1e), suggesting the presence of insulin resistance in the livers of the HFD-fed mice. These results indicate that PTENP1 was increased in the insulin resistance animal model.
Fig. 1. Relative transcription level of PTENP1 in the livers of db/db and HFD-fed mice. a, b) Relative transcription level of PTENP1 was significantly enhanced in livers of db/db mice (a) and HFD-fed mice (b). c) Body weight of HFD-fed mice during 10 weeks. d) Impairment of the insulin-signaling pathway in the livers of the HFD-fed mice compared to the control (Western-blot and diagram). e) Glycogen content in livers of the HFD-fed mice. The data represent means ± S.E. (error bars), n = 4; * p < 0.05 versus control; ** p < 0.01 versus control.
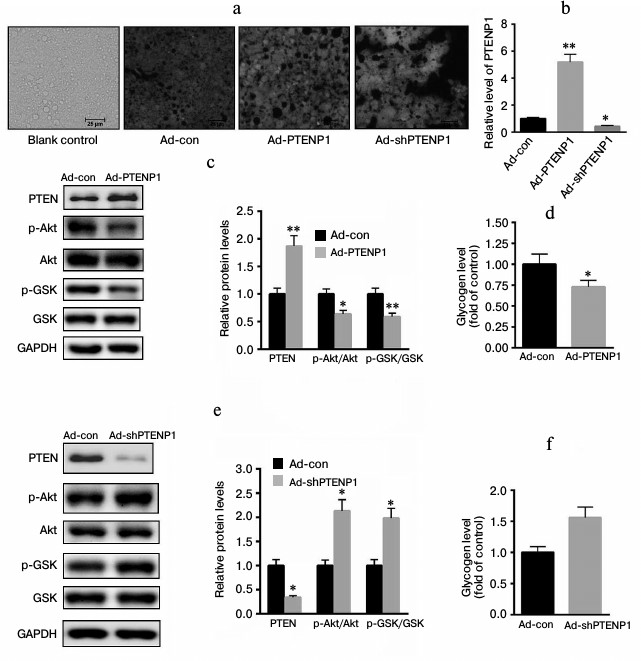
Effects of PTENP1 on insulin-signaling pathways in vitro. To explore the role of PTENP1 in insulin resistance, ad-PTENP1, ad-shPTENP1, or ad-con was transfected into NCTC1469 cells. As shown in Fig. 2a, the transfection efficiencies of ad-PTENP1, ad-shPTENP1, and ad-con were nearly the same, approximately 97% GFP fluorescence. Meanwhile, we determined the level of PTENP1 using RT-qPCR in cells transfected with ad-PTENP1, ad-shPTENP1, or ad-con. As shown in Fig. 2b, the relative transcription level of PTENP1 was increased by approximately 4-fold in cells transfected with ad-PTENP1, while ad-shPTENP1 decreased the relative transcription level of PTENP1 by approximately 54%. The overexpression of PTENP1 significantly impaired Akt/GSK activation and decreased glycogen synthesis (Fig. 2, c and d). In comparison, the inhibition of PTENP1 increased the level of phosphorylation of Akt/GSK and enhanced glycogen synthesis (Fig. 2, e and f). These data suggest that the overexpression of PTENP1 contributed to insulin resistance in vitro.
Fig. 2. Overexpression of PTENP1 contributed to insulin resistance in vitro. a) Microphotographs of fluorescing cells transfected with expressing or inhibiting adenovirus vectors (ad-PTENP1 or ad-shPTENP1) or control vector (ad-con) compared to normal cells (Blank control). There was no significant difference in the fluorescence density found in NCTC1469 cells transfected with ad-PTENP1 and ad-shPTENP1 or ad-con. b) Relative transcription level of PTENP1 was significantly enhanced in NCTC1469 cells transfected with ad-PTENP1, and the expression of PTENP1 was obviously inhibited in NCTC1469 cells transfected with ad-shPTENP1. c) Overexpression of PTENP1 reduced the phosphorylation level of Akt/GSK and (d) the glycogen contents in NCTC1469 cells transfected with ad-PTENP1. e) Knockdown of PTENP1 enhanced the phosphorylation level of Akt/GSK and (f) the glycogen contents in NCTC1469 cells transfected with ad-shPTENP1. The data represent means ± S.E. (error bars), n = 3 independent experiments; * p < 0.05 versus control; ** p < 0.01 versus control.
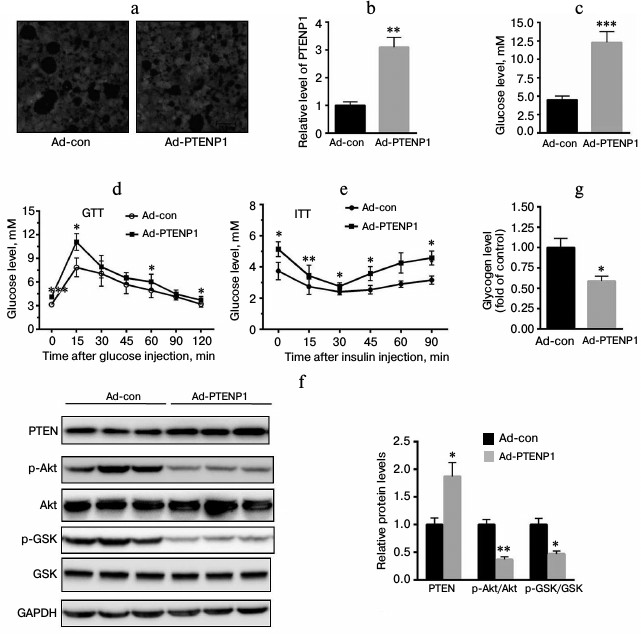
Upregulation of PTENP1 resulted in insulin resistance in vivo. To further explore the role of PTENP1 in the insulin resistance model, ad-PTENP1 or ad-con was injected into C57 mice through the tail vein. As shown in Fig. 3a, ad-PTENP1 effectively entered the livers of C57 mice. We determined the relative transcription level of PTENP1 and found it was enhanced by approximately 2.1-fold (Fig. 3b). Serum glucose was significantly increased by more than 2-fold (Fig. 3c). GTT and ITT revealed a decrease in the glucose utilization rate (Fig. 3, d and e). Furthermore, we explored the activation of Akt/GSK and found the phosphorylation levels of Akt/GSK decreased (Fig. 3f). Moreover, the glycogen contents decreased in the livers of C57 mice injected with ad-PTENP1 (Fig. 3g). These in vivo observations confirmed that the upregulation of PTENP1 contributed to hepatic insulin resistance.
Fig. 3. Overexpression of PTENP1 resulted in hepatic insulin resistance in the livers of C57 mice. a) Microphotographs of liver sections of mice injected with ad-PTENP1 and ad-con vectors. There was no significant difference in the transfection efficiency found in the livers of C57 mice injected with ad-con or ad-PTENP1. b) Relative transcription level of PTENP1 was significantly increased in the livers of C57 mice injected with ad-PTENP1. c) Serum glucose was enhanced in the livers of C57 mice injected with ad-PTENP1. d, e) GTT and ITT, respectively, were impaired in C57 mice injected with ad-PTENP1. The Akt/GSK signaling pathway was impaired (f), and the glycogen synthesis decreased (g) in the livers of C57 mice injected with ad-PTENP1 or ad-con. The data represent means ± S.E. (error bars), n = 4; * p < 0.05 versus control; ** p < 0.01 versus control.
PTENP1 is the target gene of miR-499-5p. We aligned the sequences of PTEN and PTENP1. In previous study, we identified a putative binding site of miR-499-5p on the 3′-UTR of PTEN that was located at the 4385th nucleotide of PTEN-3′-UTR. However, this binding site was not included in the 3′-UTR of PTENP1. Further study identified another binding site of miR-499-5p on the 3′-UTR of PTEN and PTENP1 (Fig. 4a). The 3′-UTR containing the binding sites of PTENP1 and PTEN was included in the pmirGLO plasmid. In addition, we also constructed plasmids lacking the binding sites of miR-499-5p, and these plasmids were called pmirGLO-PTENP1-3′-UTR-S or pmirGLO-PTEN-3′-UTR-S (Fig. 4b). The luciferase reporter assay showed that miR-499-5p could significantly decrease the luciferase activity of pmirGLO-PTENP1-3′-UTR and pmirGLO-PTEN-3′-UTR, while no changes were detected for pmirGLO-PTENP1-3′-UTR-S or pmirGLO-PTEN-3′-UTR-S (Fig. 4, c and d). The level of miR-499-5p was increased by approximately 134-fold in HEK293T cells transfected with miR-499-5p mimetics compared with the NC (Fig. 4e). Furthermore, PTENP1 was significantly decreased in cells transfected with miR-499-5p mimetics (Fig. 4f). In comparison, the transfection of miR-499-5p inhibitors significantly repressed the level of miR-499-5p (Fig. 4g) and increased the level of PTENP1 (Fig. 4h). Taken together, these data suggested that PTENP1 is the target gene of miR-499-5p.
Fig. 4. PTENP1 is the target gene of miR-499-5p. a) The sequence alignment of PTENP1 and PTEN determined that the two sequences have high similarity (similar sequences in PTENP1 and PTEN as well as complementary to them sequences in miR-499-5p are underlined). b) Construction of plasmids containing or lacking binding sites of miR-499-5p in the 3′-UTR of PTENP1 and PTEN. c, d) Luciferase reporter assay showed that miR-499-5p could significantly decrease the relative luciferase activity of pmirGLO-PTENP1-3′-UTR or pmirGLO-PTEN-3′-UTR, respectively. e) The level of miR-499-5p was significantly enhanced in HEK293T cells transfected with miR-499-5p mimics compared with the control (NC, negative control). f) PTENP1 was significantly decreased in NCTC1469 cells transfected with miR-499-5p mimics. g) The level of miR-499-5p was significantly repressed in HEK293T cells transfected with miR-499-5p inhibitors compared with the control. h) Relative transcription level of PTENP1 was increased in NCTC1469 cells transfected with miR-499-5p inhibitors. The data represent means ± S.E. (error bars), n = 3 independent experiments; * p < 0.05 versus control; ** p < 0.01 versus control.
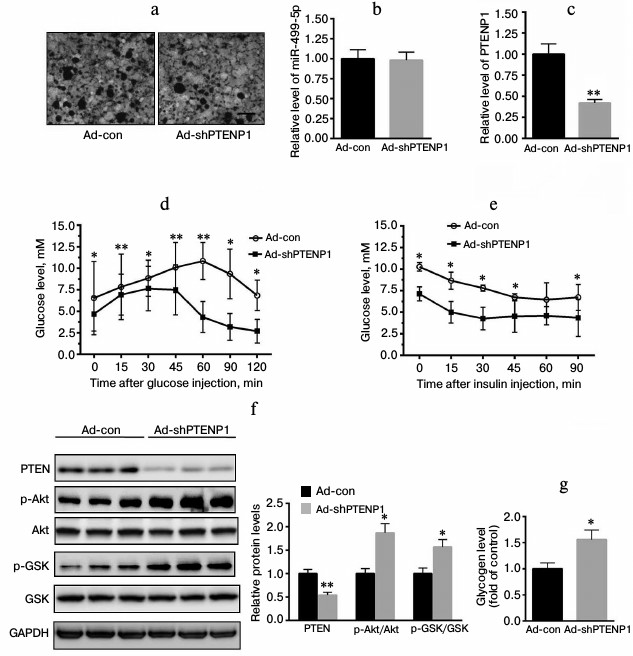
PTENP1 contributes to hepatic insulin resistance by binding to miR-499-5p in vivo. Through a tail vein injection, ad-shPTNEP1 was administered to HFD-fed mice. As shown in Fig. 5a, ad-shPTENP1 was effectively transfected into the livers of the HFD-fed mice. Furthermore, the level of miR-499-5p was not affected by the ad-shPTENP1 or the ad-con injection (Fig. 5b). The relative transcription level of PTENP1 was decreased by 58% (Fig. 5c). Insulin signaling improved according to the GTT and the ITT (Fig. 5, d and e). More importantly, we explored the insulin-signaling pathway. As shown in Fig. 5f, the protein level of PTEN significantly decreased. Furthermore, the phosphorylation levels of Akt/GSK increased. Meanwhile, glycogen synthesis was enhanced in the HFD-fed mice injected with ad-shPTENP1 (Fig. 5g). Altogether, these in vivo observations indicate that PTENP1 serves as a ceRNA of miR-499-5p.
Fig. 5. PTENP1 served as a ceRNA by binding miR-499-5p. a) Microphotographs of fluorescing liver cells of HFD-fed mice injected with ad-shPTENP1 or ad-con. No significant difference was found in the transfection efficiency in the livers of HFD-mice injected with ad-shPTENP1 or ad-con. b) Relative transcription level of miR-499-5p was not changed in the livers of HFD-fed mice injected with ad-shPTENP1 or ad-con. c) Relative transcription level of PTENP1 was significantly reduced in the livers of HFD-fed mice injected with ad-shPTENP1. d, e) Improved glucose and insulin tolerances, respectively, were identified in the livers of HFD-fed mice injected with ad-shPTENP1 or ad-con. f) Knockdown of PTENP1 significantly decreased the level of PTEN and activated the Akt/GSK signaling in the livers of HFD-fed mice injected with ad-shPTENP1 compared with those injected with ad-con. g) Knockdown of PTENP1 significantly increased the glycogen contents of the livers of HFD-fed mice injected with ad-shPTENP1 compared with those injected with ad-con. The data represent means ± S.E. (error bars), n = 4; * p < 0.05 versus control; ** p < 0.01 versus control.
DISCUSSION
In the present study, we first explored the expression of PTENP1 in db/db and HFD-fed mice. The results indicated that PTENP1 expression was increased in the animal model of insulin resistance. Further study showed that the overexpression of PTENP1 resulted in impaired Akt/GSK activation, while the inhibition of PTENP1 enhanced the phosphorylation levels of Akt/GSK. In some human cancers, it has been found that PTEN is lost [15]. Moreover, the pseudogene of PTENP1 was also found to be lost [13]. Another study revealed that PTENP1 also functions as a tumor suppressor, and the loss of PTENP1 resulted in malignancies in advanced tumors [16]. In this study, we first found that PTENP1 induced insulin resistance in hepatocytes.
Although pseudogenes are highly similar to their ancestor genes, they lack the ability to code for a protein because of stop codes, insertions, or deletions [17]. Previous studies have indicated a new regulation network between miRNA and mRNAs [18]. It was reported that lncRNAs might act as a sink to bind miRNAs, thereby releasing the target genes [19]. In previous studies, we demonstrated that PTEN was the target gene of miR-499-5p. Based on this study, bioinformatics studies showed that PTENP1 shared the same binding sites with miR-499-5p in PTEN. Additionally, the luciferase reporter assay indicated that PTENP1 was also a target gene of miR-499-5p. Moreover, the overexpression of miR-499-5p significantly decreased the level of PTENP1, while the inhibition of miR-499-5p significantly enhanced the level of PTENP1. Altogether, we concluded that PTENP1 is a target gene of miR-499-5p.
With the expanding study of lncRNAs, researchers have paid great attention to the role of lncRNAs in diseases. In this study, we first determined that PTENP1 contributed to hepatic insulin resistance both in vivo and in vitro. Because lncRNAs are not protein-coding genes, the functions of ceRNA are suggested to be especially important [20]. To further elucidate whether PTENP1 competitively binds to miR-499-5p, HFD-fed mice were injected with ad-shPTENP1, thereby reducing its expression in livers. At the same time, we also determined the level of miR-499-5p. We found that the level of miR-499-5p was not affected by ad-shPTENP1 or ad-con injection. Then, the protein level of PTEN, another target gene of miR-499-5p, was identified. We found that the inhibition of PTENP1 significantly reduced the expression of PTEN, thereby enhancing the activation of Akt/GSK signaling. Together, these data suggest that PTENP1 functions as a sink for miR-499-5p, thereby regulating the expression of PTEN.
In conclusion, the upregulation of PTENP1 contributed to hepatic insulin resistance in db/db and HFD-fed mice. As the pseudogene of PTEN, PTENP1 was also determined to be a target gene of miR-499-5p. In vivo studies indicated that PTENP1 functions as a ceRNA for miR-499-5p, thereby regulating the expression of PTEN.
REFERENCES
1.Frampton, A. E., Krell, J., Jamieson, N. B., Gall,
T. M., Giovannetti, E., Funel, N., Mato Prado, M., Krell, D., Habib, N.
A., Castellano, L., Jiao, L. R., and Stebbing, J. (2015) MicroRNAs with
prognostic significance in pancreatic ductal adenocarcinoma: a
meta-analysis, Eur. J. Cancer, 51, 1389-1404.
2.Zaleska, K. (2015) miRNA – therapeutic
tool in breast cancer? Where are we now? Rep. Pract. Oncol.
Radiother., 20, 79-86.
3.Mahdavinezhad, A., Mousavi-Bahar, S. H.,
Poorolajal, J., Yadegarazari, R., Jafari, M., Shabab, N., and Saidijam,
M. (2015) Evaluation of miR-141, miR-200c, miR-30b expression and
clinicopathological features of bladder cancer, Int. J. Mol. Cell.
Med., 4, 32-39.
4.Haldrup, C., Kosaka, N., Ochiya, T., Borre, M.,
Hoyer, S., Orntoft, T. F., and Sorensen, K. D. (2014) Profiling of
circulating microRNAs for prostate cancer biomarker discovery, Drug.
Deliv. Transl. Res., 4, 19-30.
5.Prokopi, M., Kousparou, C. A., and Epenetos, A. A.
(2014) The secret role of microRNAs in cancer stem cell development and
potential therapy: a Notch-pathway approach, Front. Oncol.,
4, 389.
6.Wilusz, J. E., Sunwoo, H., and Spector, D. L.
(2009) Long noncoding RNAs: functional surprises from the RNA world,
Genes Dev., 23, 1494-1504.
7.Mercer, T. R., Dinger, M. E., and Mattick, J. S.
(2009) Long non-coding RNAs: insights into functions, Nat. Rev.
Genet., 10, 155-159.
8.Poliseno, L., and Pandolfi, P. P. (2015) PTEN ceRNA
networks in human cancer, Methods, 77-78, 41-50.
9.Salmena, L., Poliseno, L., Tay, Y., Kats, L., and
Pandolfi, P. P. (2011) A ceRNA hypothesis: the Rosetta Stone of a
hidden RNA language? Cell, 146, 353-358.
10.Cesana, M., Cacchiarelli, D., Legnini, I.,
Santini, T., Sthandier, O., Chinappi, M., Tramontano, A., and Bozzoni,
I. (2011) A long noncoding RNA controls muscle differentiation by
functioning as a competing endogenous RNA, Cell, 147,
358-369.
11.Wang, Y., Xu, Z., Jiang, J., Xu, C., Kang, J.,
Xiao, L., Wu, M., Xiong, J., Guo, X., and Liu, H. (2013) Endogenous
miRNA sponge lincRNA-RoR regulates Oct4, Nanog, and Sox2 in human
embryonic stem cell self-renewal, Dev. Cell, 25,
69-80.
12.Poliseno, L., Salmena, L., Zhang, J., Carver, B.,
Haveman, W. J., and Pandolfi, P. P. (2010) A coding-independent
function of gene and pseudogene mRNAs regulates tumour biology,
Nature, 465, 1033-1038.
13.Fujii, G. H., Morimoto, A. M., Berson, A. E., and
Bolen, J. B. (1999) Transcriptional analysis of the PTEN/MMAC1
pseudogene, psiPTEN, Oncogene, 18, 1765-1769.
14.Wang, L., Zhang, N., Pan, H. P., Wang, Z., and
Cao, Z. Y. (2015) MiR-499-5p contributes to hepatic insulin resistance
by suppressing PTEN, Cell. Physiol. Biochem., 36,
2357-2365.
15.Xiao, C., Srinivasan, L., Calado, D. P.,
Patterson, H. C., Zhang, B., Wang, J., Henderson, J. M., Kutok, J. L.,
and Rajewsky, K. (2008) Lymphoproliferative disease and autoimmunity in
mice with increased miR-17-92 expression in lymphocytes, Nat.
Immunol., 9, 405-414.
16.Harrison, P. M., Zheng, D., Zhang, Z., Carriero,
N., and Gerstein, M. (2005) Transcribed processed pseudogenes in the
human genome: an intermediate form of expressed retrosequence lacking
protein-coding ability, Nucleic Acids Res., 33,
2374-2383.
17.D’Errico, I., Gadaleta, G., and Saccone, C.
(2004) Pseudogenes in metazoa: origin and features, Brief Funct.
Genom. Proteom., 3, 157-167.
18.Pink, R. C., Wicks, K., Caley, D. P., Punch, E.
K., Jacobs, L., and Carter, D. R. (2011) Pseudogenes: pseudo-functional
or key regulators in health and disease? RNA, 17,
792-798.
19.Seitz, H. (2009) Redefining microRNA targets,
Curr. Biol., 19, 870-873.
20.Gu, S., Jin, L., Zhang, F., Sarnow, P., and Kay,
M. A. (2009) Biological basis for restriction of microRNA targets to
the 3′-untranslated region in mammalian mRNAs, Nat. Struct.
Mol. Biol., 16, 144-150.