Femtosecond Relaxation Processes in Rhodobacter sphaeroides Reaction Centers
A. G. Yakovlev1* and V. A. Shuvalov1,2
1Belozersky Institute of Physico-Chemical Biology, Lomonosov Moscow State University, 119991 Moscow, Russia; E-mail: yakov@genebee.msu.su2Institute of Basic Biological Problems, Russian Academy of Sciences, 142290 Pushchino, Moscow Region, Russia
* To whom correspondence should be addressed.
Received April 4, 2017; Revision received April 27, 2017
Energy relaxation was studied with difference femtosecond spectroscopy in reaction centers of the YM210L mutant of the purple photosynthetic bacterium Rhodobacter sphaeroides at low temperature (90 K). A dynamical long-wavelength shift of stimulated emission of the excited state of the bacteriochlorophyll dimer P was found, which starts simultaneously with P* formation and is accompanied by a change in the spectral shape of this emission. The characteristic value of this shift was about 30 nm, and the characteristic time about 200 fs. Difference kinetics ΔA measured at fixed wavelengths demonstrate the femtosecond shift of the P* stimulated emission appearing as a dependence of these kinetics on wavelength. We found that the reported long-wavelength shift can be explained in terms of electron-vibrational relaxation of the P* excited state with time constants of vibrational and electronic relaxation of 100 and 50 fs, respectively. Alternative mechanisms of the dynamical shift of the P* stimulated emission spectrum are also discussed in terms of energy redistribution between vibrational modes or coherent excitation of the modes.
KEY WORDS: photosynthesis, reaction center, energy relaxation, charge separation, difference spectroscopyDOI: 10.1134/S0006297917080053
Abbreviations: ΔA, absorption change (illumination minus darkness); BA and BB, monomeric bacteriochlorophylls in A and B chains, respectively; HA and HB, bacteriopheophytins in A and B chains, respectively; P, bacteriochlorophyll dimer; PA and PB, bacteriochlorophyll molecules that make up P; QA and QB, primary and secondary quinones, respectively; RC, reaction center; Rba., Rhodobacter.
Photosynthetic utilization of light energy occurs in so-called reaction
centers (RCs), e.g. pigment–protein complexes in the cellular
membrane that are responsible for the formation of primary
charge-separated states (for review and references to original studies,
see [1]). RCs of the purple bacterium
Rhodobacter (Rba.) sphaeroides consist of three protein subunits
(light, medium, and heavy) with molecular masses from 24 to
32 kDa, in which four molecules of bacteriochlorophyll B, two
molecules of bacteriopheophytin H, two molecules of quinone Q, and one
atom of iron are embedded. These molecules are located in the light and
medium protein subunits where they form two symmetrical chains denoted
by the subscripts A and B. Each chain includes a dimer of
bacteriochlorophyll P, shared by the two chains, and one molecule of
monomeric BA,B, HA,B, and QA,B. Two
bacteriochlorophyll molecules within a P dimer, denoted as
PA,B, are in strong excitonic interaction. The P dimer is
located closer to one of cell membrane surfaces, and quinones
QA,B – closer to its opposite surface. Despite
the same pigment composition of the two chains, only one
photochemically active A chain participates in electron transfer in
bacterial RCs. In RCs of Rba. sphaeroides, primary charge
separation occurs in the picosecond time domain and starts with
electron transfer from light-induced dimer P* to a BA
molecule with the formation of the
P+BA− state with a
characteristic time of ~3 ps at room temperature and ~1.5 ps at
cryogenic temperature. Then the electron is transferred to the
HA molecule, forming the
P+HA− state within ~1 ps, and
from HA – to the primary quinone QA,
forming the P+QA− state within
~200 ps, and these reactions also accelerate 2-3-fold with decrease
from room to cryogenic temperature. A remarkable feature of primary
charge separation in RC is its quantum yield, which is close to one.
Many mutant RCs of Rba. sphaeroides have been created using
genetic manipulations, and for these the characteristic time of
electron transfer reactions P* → BA →
HA varies from 0.8 to 300 ps.
As the primary electron donor, the P dimer plays a key role in the physical stage of photosynthesis. Dimeric nature of P is confirmed with Stark spectroscopy [2], as well as with circular dichroism spectroscopy [3]. Due to excitonic interaction, at room temperature the Qy transition of P in RCs of Rba. sphaeroides splits into two broad absorption bands at 870 (lower excitonic level) and 810 nm (higher excitonic level). The intensity of the band at 870 nm is several times higher than the one at 810 nm. The absorption band of P at 810 nm partially overlaps with a wide absorption band of monomeric BA at 800 nm. At cryogenic temperature, a significant shift is observed for the described Qy absorption bands to 900 and 825 nm, respectively, concurrent with their narrowing. The weaker Qx absorption band of P in RC of Rba. sphaeroides is located at 600 nm. During the formation of cation radical P+, complete bleaching of the P absorption bands occurs, and a broad P+ absorption band appears at 1250 nm. Absorption of light quanta results in the formation of a singlet excited state P*, which emits weak fluorescence with a maximum at 920 nm. Unlike P absorption bands, the P* emission maximum does not shift with temperature changes over a wide range. If optical excitation of a RC occurs within the absorption bands of B (800 and 600 nm) or H (760 and 540 nm), then rapid energy transfer from the excited states B* or H* to P is observed with the formation of P* within 100-200 fs [4]. In native RCs of Rba. sphaeroides, the characteristic P* lifetime is equal to the time of electron transfer from P* to BA, i.e. ~3 ps. According to data from resonance Raman scattering, several tens of vibrational modes with frequencies in the 30-1700 cm−1 range participate in the formation of the P, B, and H absorption spectra [5-7]. These modes constitute only a minor share of the total number of normal modes of the P, B, and H molecules, which reaches several hundreds. The resulting absorption bands have a smooth, structureless form over a wide range of temperatures. Only at sub-helium temperature (<2 K) a weak structure is observed in the Qy absorption band of P in RCs of Rba. sphaeroides and Rhodopseudomonas viridis, corresponding to vibrational transitions of individual modes with frequencies of 145 and 160 cm–1 [8]. Low-frequency vibrational modes (30-500 cm−1) of the RC pigments were detected by coherence femtosecond spectroscopy [9-11] and by hole-burning spectroscopy [12]. The frequencies of vibrational modes detected in these experiments are very close to the frequencies of combination-active modes. In coherence spectroscopy studies, vibrational frequencies are determined by Fourier analysis of oscillations that occur in the kinetics of difference (light-minus-dark) absorption ΔA in response to formation of wave packets. Motion of wave packets results in periodic changes in forms of emission and absorption spectra, which leads to oscillations in amplitudes of these spectra at fixed wavelengths. Due to a rapid decay of oscillations, the accuracy of determining vibrational frequencies by coherence spectroscopy is much lower than for Raman scattering. The advantage of coherence spectroscopy is its ability to reveal vibrational modes of the excited P* state, whereas Raman scattering provides information only on the ground state of P.
The possibility of primary charge separation within the P dimer is discussed in several theoretical and experimental studies. The cause of such a separation may be a strong electron density shift from PA to PB (with ratio of 0.24/0.76) in the excited state P* according to molecular dynamics calculations [13]. Some experimental data can be interpreted in favor of partial charge separation between PA and PB with the formation of the corresponding state. For instance, femtosecond spectroscopy of RC of Rba. sphaeroides in the mid-IR range (1000-1600 cm−1) showed that the electronic structure of the excited state P* changes within ~200 fs [14]. It was suggested that the reason for this change is intramolecular charge separation within P*, which happens much faster than the charge separation between RC pigments. On the other hand, experiments on hole burning at low temperature showed the absence of rapid conversion within P* [15]. Coherence spectroscopy of native and mutant RCs of Rba. sphaeroides with 40-fs resolution in the near-IR region revealed complex dynamics of ΔA spectra that could be interpreted in favor of formation of a mixed state with separated charges, P*(PAδ+PBδ–) [16]. In particular, a weak absorption band at 1080 cm−1 was reported in that study, which may correspond to the abovementioned mixed state. The well-known strong long-wavelength shift of the Qy absorption bands of P during temperature decrease can also be interpreted theoretically by the presence of an optically dark state with separated charges, which is conjugated to the locally excited state P* [17-19].
In the present study, we analyzed the femtosecond dynamics of the excited state P* in RC of the YM210L mutant of the purple bacterium Rba. sphaeroides at 90 K. In this mutant, primary charge separation is slowed tens of times compared to native RCs, which makes the P* state practically unchanged for a few picoseconds after excitation [20]. Using difference ΔA spectroscopy with 40-fs resolution, we found that the maximum of the P* stimulated emission spectrum shifts to longer wavelength, from 895 to 925 nm, simultaneously narrowing by approximately a quarter of the original width, over the time of about 200 fs. To explain these data, such physical mechanisms as electronic–vibrational relaxation and redistribution of excitation energy between vibrational modes are considered. Hereinafter, the term “electronic–vibrational relaxation” denotes transitions between vibrational levels belonging to different electron states. In both cases, a minimum of three electron states was necessary for modeling the experimental data.
MATERIALS AND METHODS
To measure the difference (light-minus-dark) ΔA absorption spectra, a femtosecond spectrometer with a titanium-sapphire laser (Spectra Physics, USA) was used. RCs were excited (at 870-880 nm) by pulses with duration of 40 fs (full width at half maximum) and probed with a continuum of the same duration. Laser pulses were amplified in a multi-pass amplifier on titanium sapphire (Avesta, Russia) and used for generating a continuum in water. A small share (~2%) of this continuum was used to probe the samples, and the major share was used for their pumping after optical and spatial filtration. A polychromator and an optical multichannel analyzer (Oriel, France) were used to measure the absorption change spectra at different delay times. The delay between pump and probe pulses was determined with accuracy of 1 fs. The residual temporal dispersion in the IR range did not exceed 30 fs.
To increase the signal-to-noise ratio, several thousand measurements were averaged. The sensitivity of the spectrometer was (1-3)·10–5 units of optical density. The kinetics of the absorption changes were plotted at various fixed wavelengths. For this, the measured maxima of the amplitudes of the absorption bands were used with additional subtraction of the broadband background. The steady-state RC absorption was measured with a Shimadzu UV-1601 spectrophotometer (Japan). The YM210L mutation was introduced into the Puf M gene encoding the M subunit of Rba. sphaeroides RC. Mutant RCs were isolated by treating membranes with LDAO with subsequent chromatography on DEAE-cellulose and resuspended in 10 mM Tris-HCl, pH 8.0, containing 0.1% Triton X-100. All measurements were carried out at 90 K in 65% glycerol (to obtain optically transparent samples). Light scattering in the frozen samples was negligible and did not result in the appearance of characteristic artifacts associated with penetration of pumping light into the measuring channel.
We will elaborate on the features of spectral measurements near zero time delay, when the pump and probe pulses partially overlap. It is well known that so-called coherent artifacts of various nature can appear in this case, distorting ΔA spectral shapes and complicating their dynamics. Moreover, with sufficiently potent pumping, various nonlinear effects may appear (multiphoton absorption, self-action, etc.). To minimize these events, several standard measures were adopted. First, the pulses used for pumping were close to so-called spectrally limited pulses. The product of the pump pulse duration over the width of its spectrum was 0.33, which is close to the theoretical value of 0.315 for pulses with a sech2 form. This circumstance prevented appearance of artifacts associated with phase modulation (so-called “chirp”) of pulses. It is known that this kind of artifacts can seriously distort the shape of ΔA spectra and result in the appearance of phantom signals in the range of negative delays. To compensate for “chirp”, a standard prism compensator was used. Estimates of the residual time dispersion of the delays were obtained from the results of measurements of ΔA spectra in colored glasses (LOMO, St. Petersburg). These estimates give a time dispersion of 30 fs for the 860-960 nm spectral range. All the experimental data were corrected for this dispersion. Cross-correlation measurements of pump and probe pulses showed that the scatter of time delay between them did not exceed a few femtoseconds, which is significantly less than the pulse duration. To minimize interference effects, a non-collinear measurement scheme was used in which the angle between the laser pump and probe beams was 25°. The intensity of the probe pulses was 50 times lower than the intensity of the pump pulses, which greatly limited the appearance of a clear interference pattern. With the exception of the spectral region near 870 nm, the pump and probe pulses had different wavelengths, which also prevented interference between them. To minimize spectral appearances of coherence, the pump wavelength (870 nm) was shifted significantly in relation to both the long-wavelength maximum of the dimer P absorption (895 nm at 90 K) and the range of the 0–0 transition (907 nm). Spatial filtration of laser beams was used, which improved uniformity of their intensity distribution in cross section. Dispersion of time delays in the cross section of the beams did not exceed a few femtoseconds. To exclude nonlinear effects, the maximum intensity of pump pulses was limited to the level corresponding to the absolute value of absorption bleaching 0.05. This value was 10% of the optical density of the samples at 870 nm. From the measures taken, experimental ΔA spectra and kinetics (Figs. 1 and 2) do not exhibit any clear signs of artifacts over the whole range of time delays from –100 to 300 fs. The ΔA kinetics in the wavelength range characteristic of absorption bleaching (≤890 nm) correspond approximately to integral convolution of pump and probe pulses. This is true even for negative delays up to –100 fs, which indicates the absence of noticeable artifacts.
Fig. 1. Difference (light-dark) ΔA absorption spectra of reaction centers of Rba. sphaeroides mutant YM210L within the Qy absorption band of bacteriochlorophyll P dimer measured at 90 K. RCs were excited by 40-fs pulses at 880 nm. The numbers indicate the measurement delay in femtoseconds relative to the center of the pump pulse.
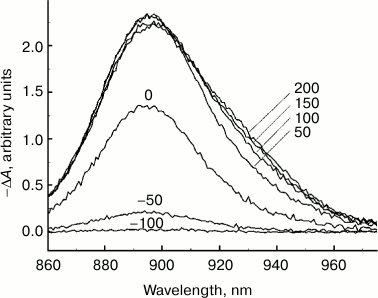
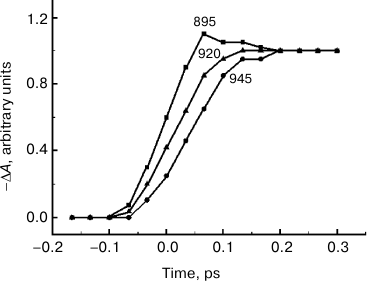
Fig. 2. ΔA kinetics of reaction centers of Rba. sphaeroides YM210L mutant plotted at fixed wavelengths indicated by the numbers near the curves according to the results of ΔA spectral measurements (see Fig. 1).
RESULTS AND DISCUSSION
Figure 1 shows difference (light-minus-dark) ΔA absorption spectra of RCs of Rba. sphaeroides YM210L mutant in the range of the absorption band Qy of bacteriochlorophyll dimer P measured with various femtosecond delays τ in relation to the center of the pumping pulse at 90 K. The RCs were excited by 40-fs pulses at 880 nm. The maximum of the ΔA spectrum was located at 895 nm, approximately corresponding to the maximum of the stationary absorption of the Qy band of P for the YM210L mutant. After the end of the pump pulse with τ > 100 fs, a slight change in the shape of the ΔA spectrum becomes noticeable: its short-wavelength slope (λ > 900 nm) becomes flatter, and the value of its maximum decreases slightly. The shape of the short-wavelength slope (λ < 900 nm) shows almost no change over the whole range of delays (see also Fig. 3). With an increase in the delay in the range of τ < 100 fs, the increase in the ΔA spectrum amplitude is due to pumping. We should note the absence of any apparent spectral displays of such effects as dynamic broadening of the absorption spectrum (so-called Heisenberg broadening), optical Stark effect, absorption from the excited state P*, and coherence effects. Without going into a detailed discussion of these effects, it can be assumed that this insensitivity is caused by sufficiently long pump and probe pulses (40 fs), as well as by a sufficiently low excitation intensity. Using pulses shorter that 30 fs for pumping RCs results in the appearance of coherent oscillation in ΔA kinetics [9-11], but these oscillations affect only the spectral range of stimulated emission.
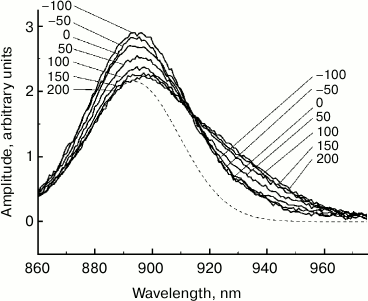
Fig. 3. Difference (light-minus-dark) ΔA absorption spectra of reaction centers of Rba. sphaeroides mutant YM210L within the Qy absorption band of bacteriochlorophyll P dimer (see Fig. 1) normalized by area. The dashed line is the stationary absorption spectrum. The numbers indicate the measurement delay in femtoseconds relative to the center of the pump pulse.
Any changes to the ΔA spectral shape stop when the delay reaches ~200 fs (Fig. 1). Starting with this time, the ΔA spectrum stays almost unchanged for a few tens of picoseconds (data not shown), which conforms to a large amount of experimental data obtained earlier [1]. According to this data, charge separation in RCs of Rba. sphaeroides mutant YM210L at low temperature has a characteristic time (over 100 ps) that is tens of times higher than that of native RCs. This means that the excited P* state remains virtually unchanged for tens of picoseconds. The reason for such P* conservation is the substitution of the native tyrosine M210 with leucine. In Fig. 2, ΔA kinetics are presented, plotted at fixed wavelengths from the results of ΔA spectral measurements. These kinetics allow better visualization of the dynamics of ΔA spectral shape. When the ΔA wavelength increases, the kinetics shift along the time scale and become flatter. For instance, the kinetics at 945 nm are delayed by a few tens of femtoseconds in relation to the kinetics at 895 nm. The greater the wavelength at which certain kinetics are measured, the longer the value of this delay is.
It is well known that the ΔA spectrum in the region of the Qy band of P is formed mostly by two processes. These are bleaching of the P absorption band and P* stimulated emission [1]. Further analysis of the data is aimed at isolating the spectrum of P* stimulated emission from the ΔA spectra. The high value of the Stokes shift of the P* emission band relative to the P absorption band (~25 nm at 77 K and ~50 nm at room temperature) facilitates this task. First, it is necessary to consider the final duration of pump and probe pulses. For that purpose, it is convenient to bring the ΔA spectra shown in Fig. 1 to the same area. The area of the ΔA spectrum (τ = 200 fs) with a delay of 200 fs was taken as this basis, since a further increase in the delay does not result in a change in its area (data not shown). All other ΔA spectra, measured at shorter τ delays, were multiplied by a coefficient equal to the ratio of spectral areas, ΔA(τ = 200 fs)/ΔA(τ). Figure 3 shows the ΔA spectra shown in Fig. 1 and normalized by area. Such normalization allows taking into account the lengths of pump and probe pulses in the first approximation. In other words, the ΔA spectra in Fig. 3 approximately correlate to a hypothetical case of instant pumping that occurred at τ = −100 fs and instant probing. In the dynamics of normalized ΔA spectra, a major pattern is clear: a decrease in the amplitude at 890 nm occurs simultaneously with an increase at 930 nm. It is interesting that at the wavelength of ~914 nm the amplitude of normalized ΔA spectra remains unchanged in time.
For isolation of a stimulated emission P* spectrum from a ΔA spectrum, it is necessary to know the absorption spectrum of P at various moments in time. In the absence of this data, a stationary absorption spectrum can be used (dashed line in Fig. 3). The validity of this approach requires further discussion. First, a substitution of a dynamic absorption spectrum with a stationary spectrum is justified if temporal changes in spectral shape are minor. These changes may be caused, for example, by vibrational relaxation in the ground state of P, by dynamic broadening of the P absorption band, or by formation of a vibrational wave packet in the ground state of P. At low temperature (in our case, 90 K), in the ground state of P, its lowest level is populated predominantly out of the majority of vibrational modes. Pumping results in a disturbance of equilibrium Boltzmann distribution of populations in the ground state of P, but restoration of this equilibrium (i.e. vibrational relaxation) is hindered by a lack of sufficient population on all vibrational levels except the lowest one. In this case, equilibrium can be restored by transferring energy from other vibrational modes. Moreover, for the vast majority of vibrational modes of the dimer P, a shift of potential surface of the excited state P*, determined by the Huang–Rhys parameter, is very small [5-7]. The latter circumstance results in the fact that vibrational relaxation of these modes does not have any significant spectral expression, i.e. does not cause changes in the shape of the P absorption spectrum. As for coherent oscillations or dynamic broadening of the P absorption spectrum, shorter laser pulses are probably required for the appearance of these effects than those used by us (40 fs).
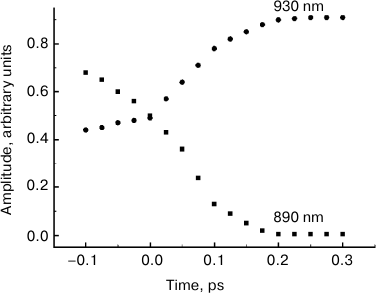
The comparison of normalized ΔA spectra to the stationary absorption spectrum (Fig. 3) shows that major changes in the shape of these spectra occur at λ > 900 nm, i.e. in the range or stimulated P* emission. In the range of λ < 900 nm where bleaching of P absorption predominates ΔA spectra, changes in forms of these spectra are insignificant. It can be assumed that the dynamics of ΔA spectral shape is completely due to the dynamics of the stimulated P* emission. Then, stimulated emission spectra for P* can be obtained by simple subtraction of the stationary absorption spectrum of P from normalized ΔA spectra. The results of such subtraction for a hypothetical case of instant pumping and probing are demonstrated in Fig. 4. Immediately after excitation, stimulated emission of P* has a maximum at 900 nm. Over time, this maximum shifts to the red range, and after 200-300 fs it is located at 926 nm. At the same time, the spectrum of P* stimulated emission is narrowed by approximately a quarter. With τ > 200 fs, the P* stimulated emission spectrum remains unchanged for several tens of picoseconds (data not shown). In Fig. 5, kinetics of P* stimulated emission at 890 and 930 nm are shown, plotted for the ΔA spectra given in Fig. 4. The decrease in the amplitude of the emission spectra at 890 nm occurs approximately at the same rate as their increase at 930 nm. We note that the kinetics at 890 and 930 nm are far from simple exponentials.
Fig. 4. Spectra of the stimulated P* emission of reaction centers of Rba. sphaeroides mutant YM210L within the Qy absorption band of bacteriochlorophyll dimer P obtained by subtraction of the stationary absorption spectrum from ΔA absorption spectra and normalized by area (see Fig. 3). The numbers indicate the measurement delay in femtoseconds relative to the center of the pump pulse.
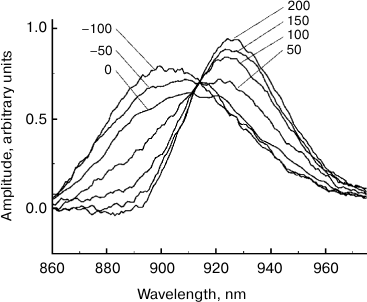
Fig. 5. Kinetics of stimulated P* emission of reaction centers of Rba. sphaeroides mutant YM210L plotted at fixed wavelengths indicated by the numbers above the curves corresponding to the stimulated P* emission spectra (see Fig. 4).
For further analysis, it is necessary to concretize the theoretical model of the physical processes occurring in the excited state of the dimer P. First, let us consider the electronic–vibrational relaxation of P*, which can result in a long-wavelength shift of the P* stimulated emission spectrum and a change in its shape. The characteristic time of purely vibrational relaxation within the same electronic state lies in the range from hundreds of femtoseconds to several picoseconds for many organic molecules. On the contrary, for transitions between vibrational levels with the same number corresponding to different electronic states (purely electronic relaxation), the characteristic time may be measured in tens or even single femtoseconds. It is clear that purely electronic relaxation may shift the P* emission spectrum along the wavelength scale as a whole, but it cannot result in a change of the shape of the spectrum. On the other hand, for purely oscillatory relaxation to manifest itself spectrally, several conditions are required. First, it is necessary to create a nonequilibrium population of vibrational levels of the modes participating in the formation of P* emission. For this, the central frequency of the pump pulse must differ from the frequency of the 0–0 transition of these modes. Second, the Huang–Rhys parameter s for the vibrational mode that participates in the formation of P* emission may not be low: s ≤ 1 [21]. Under these conditions, purely vibrational relaxation may result either in a change in the shape of the nonstationary ΔA spectra or in a shift in maxima of these spectra towards longer or shorter wavelengths depending on the pump wavelength. We note that electronic–vibrational relaxation can occur in both the excited and the ground state of P, resulting in complex dynamics of ΔA spectra.
According to Raman spectroscopy data, several tens of vibrational modes with frequencies in the 30-1500 cm−1 range take part in the formation of the P absorption spectrum [6, 7]. We note that the total number of normal P modes reaches several hundred. Similar data on the excited state P* is absent, but it can be assumed that the frequencies and relative contributions of vibrational modes to P* and P do not differ significantly. A characteristic feature of the majority of bacteriochlorophyll vibrational modes is a low value of Huang–Rhys parameter s << 1. Only a few modes with the lowest frequencies (frequencies ~ 100 cm−1) have an s value around 1. It is clear that if the pump wavelength is located close to the maximum of P absorption, then the excited nonzero vibrational levels belong predominantly to low-frequency modes. Therefore, vibrational relaxation of a few vibrational modes of P with frequencies of about 100 cm−1 can contribute to spectral dynamics.
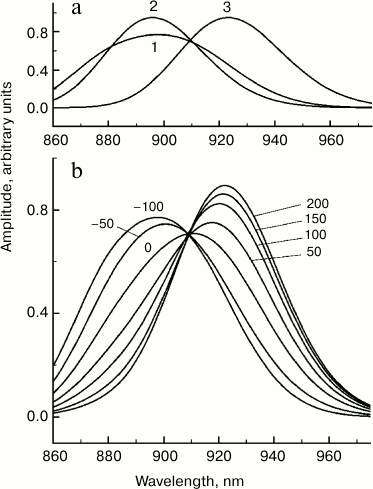
Based on these facts, we considered the simplest model in which P absorption and P* emission is caused by one vibrational mode with a frequency of 130 cm−1, transition width of 350 cm−1 (full width at half-height), Gaussian shape of the bands, and the value of s = 0.8 (Fig. 6). A mode with a frequency close to 130 cm−1 was detected not only in resonance Raman scattering experiments, but also in numerous studies on coherence spectroscopy and hole-burning spectroscopy [1]. In our model, the excited state P* is a sum of three states (Fig. 6a). States (1) and (2) are the first and the zero vibrational levels of the 130 cm−1 mode, respectively, with P → P* electron transition frequency of 11,250 cm−1, and the state (3) is the zero vibrational level of the excited state with a lower P → P* transition frequency of 10,920 cm−1. With our chosen parameters, the population of vibrational levels of the excited state P* with numbers over 1 can be neglected. We assumed that at the initial moment populations of states (1) and (2) are equal, and state (3) is not populated – that is, it is “dark” and does not participate in light absorption. Stimulated-emission spectra for the three states were calculated as sums of transitions to the vibrational levels of the ground state of P [21]. The dynamics of stimulated emission was set according to a consecutive scheme of population transfer (1) → (2) → (3). Apparently, the transition (1) → (2) models vibrational relaxation, and the transition (2) → (3) models electronic relaxation. Only the case of low temperature was considered, when only the zero vibrational level is populated in the ground state of P at t = 0. The rates of reverse reactions were considered negligibly low, so at t = the whole population was in state (3). Despite the apparent conventionality, the model illustrates the dynamics of the stimulated emission spectrum of P* well if the characteristic times of vibrational and electronic relaxation are taken as 100 and 50 fs, respectively (Fig. 6b). In our model, vibrational relaxation results mainly in the narrowing of the stimulated emission spectrum of P*, since in this case the population of state (1) with a broader spectrum decreases, and the population of the state (2) with a narrower spectrum increases (Fig. 6a). Electronic relaxation (2) → (3) causes a shift in the stimulated P* emission to longer wavelength. We should note that within the framework of a more advanced multimodal model for the YM210W mutant, with due regard for reverse reactions and populations of all vibrational levels, closer values of characteristic times of vibrational and electronic relaxation were obtained, 120 and 54 fs, respectively [22].
Fig. 6. Theoretical stationary spectra of the stimulated emission of three excited states (a) and femtosecond spectra of stimulated emission (b) of Rba. sphaeroides mutant YM210L within the Qy absorption band of bacteriochlorophyll dimer P for the model of electronic–vibration relaxation. The numbers indicate the probe delay in femtoseconds relative to pumping. In the calculations, a sequential kinetic model of three excited states was used: (1) → (2) → (3). States (1) and (2) are the first and the zero vibrational levels of the 130 cm−1 mode, respectively, with electronic frequency of 11,250 cm−1, and state (3) is the zero vibrational level of the same mode with electronic frequency of 10,920 cm−1. The width of Gaussian bands of electronic–vibrational transitions was 350 cm−1. The Huang–Rhys parameter was 0.8. Characteristic time of vibrational and electronic relaxation was 100 and 50 fs, respectively.
It is important to note that the vibrational relaxation time of 100 fs obtained by us is close to the lower estimated limit. In photosynthetic RCs, direct measurements of vibrational relaxation times for various modes have not been carried out. Based on the comparison of the experimental data to the results of theoretical calculations within the framework of many various models, approximate indirect estimations were obtained. According to them, the characteristic time of vibrational relaxation in photosynthetic RCs can be from 0.1 to 1-2 ps [1, 22]. Since many vibrational levels of a particular mode may be involved in the process of vibrational relaxation, the time constant for transitions between neighboring levels may be several times lower than the characteristic time of the whole process. For effective charge separation in the RC, the relaxation processes should not be too fast, since rapid transfer of a population within a particular state competes with population transfer between states. On the other hand, for a particular vibrational mode, the lower time limit of vibrational relaxation is determined by half of the vibrational period. For the 130 cm−1 mode, this limit id ~120 fs, and for modes of higher frequencies – several tens of femtoseconds.
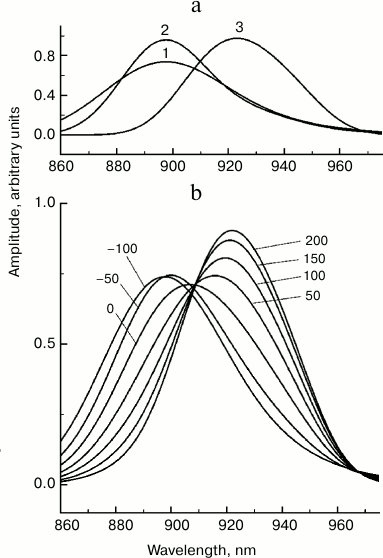
In addition to electronic–vibrational relaxation, there are many other physical processes that may result in the observed changes in the stimulated emission spectrum of P*. Energy redistribution between vibrational modes is one of these. It is generally accepted that nonlinear resonances are the major physical mechanism of this redistribution [23]. The role of interaction of vibrational modes in primary photosynthetic processes is practically unexplored. We propose that the characteristic time for redistribution of excitation energy in dimer P does not exceed the characteristic time of vibrational relaxation. In the opposite case, spectral dynamics of P* would demonstrate slower picosecond changes, which is not confirmed experimentally. To illustrate how energy redistribution may affect the stimulated P* emission spectrum, we analyzed a model in which the P* state is formed by three vibrational modes with frequencies of 100, 400, and 500 cm−1, the same frequency of electron transition, 11,150 cm−1, the width of Gaussian bands of 220, 350, and 500 cm−1, and s value of 0.1, 0.2, and 3.5, respectively (Fig. 7). We assumed that at the zero moment the 500 cm−1 mode is excited. Then excitation is transmitted to the 400 cm−1 mode, and then, from the 400 to the 100 cm−1 mode. Stimulated emission spectra of the three modes (Fig. 7a) were calculated as sums of transitions to the vibrational levels of the ground state P [21]. An increase in the s value results in a shift of the P* radiation spectrum to longer wavelengths, and a decrease in mode frequency results in narrowing of this spectrum. For a qualitative explanation of the experimental data, the characteristic time of excitation transfer from the 500 to the 400 cm−1 mode should be taken as 100 fs, and from the 400 to the 100 cm−1 mode – as 70 fs, and the reverse reactions should be neglected. It should be emphasized that the proposed model is purely illustrative and is not built on any data on interaction of modes in dimer P.
Fig. 7. Theoretical stationary spectra of stimulated emission of three excited states (a) and femtosecond spectra of stimulated emission (b) of Rba. sphaeroides mutant YM210L within the Qy absorption band of bacteriochlorophyll P dimer for the model of energy redistribution between vibrational modes. The numbers indicate the probe delay in femtoseconds relative to pumping. In the calculations, a sequential kinetic model of three excited states was used: (1) → (2) → (3), representing zero vibrational levels of modes 500, 400, and 100 cm−1 with width of Gaussian bands of electronic–vibration transitions of 500, 350, and 220 cm−1 and Huang–Rhys parameters of 0.1, 0.2, and 3.5, respectively. The electronic frequency was 11,150 cm−1. Characteristic time of transitions (1) → (2) and (2) → (3) were 100 and 70 fs, respectively.
The physical mechanisms analyzed above have incoherent nature. It is well known that coherent processes can also be present in spectral dynamics of stimulated P* emission [1]. During P excitation by pulses with duration under 30 fs, intense oscillations of complex shape are observed in stimulated P* emission, predominated by frequencies of the order of 100 cm−1 (period of oscillations ~250 fs). It was demonstrated theoretically that these oscillations can be caused by movements of the wave packet along the surface of potential energy of the excited state P*. With pump pulse duration over 30 fs, oscillations with a period of 250 fs are completely absent in P* emission, but very weak oscillation with a longer period can be observed [10]. It should be noted that movement of the wave packet might be of periodic as well as of nonperiodic nature. In the latter case, spectral dynamics of stimulated P* emission will also be nonperiodic. In this study, pump pulse duration was 40 fs, which excluded the appearance of oscillation with a period of 250 fs in the ΔA spectrum. Nevertheless, we cannot exclude the possibility of coherent excitation of low-frequency modes and of nonperiodic movement of the corresponding wave packet. We should also note that the involvement of many vibrational modes in coherent processes might smooth the spectral and temporal expressions of these processes. This may explain the absence of any apparent expressions of coherence in the range of zero delay in our study and several earlier works [1].
It is interesting to analyze the possibility of alternative explanations of the data obtained by us in terms of nonuniformity (heterogeneity) of RCs. The hypothesis of simultaneous existence of several RC forms in Rba. sphaeroides bacteria (or several forms of the bacteria themselves) relies on many experimental data, which may also be explained by other, more traditional means. For example, multiexponential nature of stimulated emission kinetics of P* is sometimes explained by heterogeneity of RCs, although there is another explanation from the standpoint of simultaneous electron transfer from P* by different electron pathways. We empathize that attempts to isolate one hypothetical RC from another have been unsuccessful. It could be proposed that two excited states, P1* and P2*, referred to in our study, actually belong to two different forms of bacteriochlorophyll dimer. These forms could slightly differ in the molecular structure of dimer P or have some differences in the composition of its immediate protein environment. Energy transfer from one form to another could occur by the Förster mechanism of inductive resonance. However, such a hypothesis does not provide insight into the reasons for the second form (at 930 nm) to appear after a delay relative to the moment of excitation. An additional assumption that the second form is optically dark appears unlikely. Moreover, it is doubtful that excitation transfer by the Förster mechanism can occur in time significantly less than 1 ps.
Going back to electronic–vibrational relaxation of the excited state P*, we will discuss any possible physical mechanisms underlying this phenomenon in more detail. Recently, a hypothesis stating that the earliest stage of charge separation in RC occurs within an excited P* dimer receives increasing theoretical and experimental evidence. The idea of the formation of a charge-transfer complex in P* is not new: it is supported by quantum mechanical calculations of the nonuniform electron density distribution between PA and PB [13]. For theoretical analysis of charge separation within P*, a combination of molecular dynamics methods and phenomenological Langevin approximation is suitable [24]. Calculations of the spectral function of polarization of the immediate dimer environment and of dielectric response to charge separation within it demonstrated that the protein environment strongly affects formation of an internal dipole. Characteristic frequencies of immediate protein environment dynamics for the dimer were found in the 30-155 cm−1 range. It turned out that environment dynamics for PA and PB molecules, which constitute the dimer, differ strongly. Around PA, modes in the 30-80 cm−1 range are predominant, and around PB – modes at 95 and 155 cm−1 with a significantly lower amplitude. Moreover, elastic oscillations of protein α helices with a frequency of 118 cm−1 were found to affect the formation of the dipole within the dimer. To explain the known spectral energy properties of the dimer, a mechanism of capturing of the excitation energy in elastic oscillations of the environment was proposed [24]. Similar results were also obtained in several other theoretical studies on molecular dynamics of the dimer and its surrounding area [25, 26]. In these works, the mode of collective motion of the dimer and the rotation of histidine M202 with a frequency of 100 cm−1 were shown to be linked to P* dynamics and to participate in internal charge separation. A connection was also shown between intramolecular processes in the dimer and the mode with frequency of 30-35 cm−1, which reflects the movement of crystallographic water and its neighboring molecules. Calculations show that along the spatial coordinates coupled to the 30 and 100 cm−1 modes, the formation of a state with partially separated charges is facilitated both within the P dimer and between P and B. Similar vibrational values were observed earlier in experiments with coherence spectroscopy of primary charge separation in RCs of Rba. sphaeroides [11].
Recent studies of primary charge separation dynamics in native and mutant (heterodimeric) RCs of Rba. sphaeroides confirm the possibility of dipole formation within the dimer [16]. In difference absorption spectra, an increase in absorption was found in the 1060-1130 nm range with a maximum at 1080 nm, which may correspond to the cation radical molecule PAδ+ within a mixed state with partial charge separation, P*(PAδ+PBδ–). It was found that in native RCs of Rba. sphaeroides, this state is formed in only 120-180 fs after excitation, and in RCs of heterodimeric mutants H(L173)L and H(M202)L – in ~100 fs. Thus, the mixed state P*(PAδ+PBδ–) formation is significantly faster than the picosecond electron transfer to BA with the formation of a weak BA– absorption band at 1020 nm. This transfer may be caused by a transition between mixed states P*(PAδ+PBδ–) and P*(PAδ+BAδ–). The data from the experiment [16] shows that with 20-fs excitation, wave packet energy is sufficient to reversibly clear the barrier between states P* and P*(PAδ+BAδ–) with 500 fs delay. With 40-fs excitation, this effect is absent, and tunneling of this barrier takes a longer time of 3 ps. The data [16] indicate that the formation of the stimulated P* emission band at 940 nm and of the absorption band at 1080 nm may reflect the same process: partial charge separation between PA and PB, which causes formation of the mixed state P*(PAδ+PBδ–). This is indicated by data from femtosecond spectroscopy of Rba. sphaeroides heterodimeric mutants, in which a PA or PB molecule is replaced by a molecule of bacteriopheophytin, BPheo. It is well known that in the primary electron donor of these mutants, the D dimer, electron density is significantly dislocated towards BPheo, and charge separation is accompanied by the formation of states with partially separated charges within D. Under these conditions, an absorption band is formed at 1080 nm with a 100-150 fs delay relative to excitation, which is identical to that of native Rba. sphaeroides RCs.
Acknowledgments
We are grateful to L. G. Vasilieva and A. Ya. Shkuropatov for their aid in preparation of RC samples.
This study was partially supported by the Russian Foundation for Basic Research (grant No. 14-04-00295a).
REFERENCES
1.Yakovlev, A. G., and Shuvalov, V. A. (2016)
Physical stage of charge separation during photosynthesis, Adv.
Phys. Sci., 126, 597-625.
2.Lockhart, D. J., and Boxer, S. G. (1987) Magnitude
and direction of the change in dipole moment associated with excitation
of the primary electron donor in Rhodopseudomonas sphaeroides reaction
centers, Biochemistry, 26, 664-668.
3.Philipson, K. D., and Sauer, K. (1973) Comparative
study of the circular dichroism spectra of reaction centers from
several photosynthetic bacteria, Biochemistry, 12, 535-539.
4.Van Brederode, M. E., and Van Grondelle, R. (1999)
New and unexpected routes for ultrafast electron transfer in
photosynthetic reaction centers, FEBS Lett., 455,
1-7.
5.Cherepy, N. J., Shreve, A. P., Moore, L. J.,
Franzen, S., Boxer, S. G., and Mathies, R. A. (1994) Near-infrared
resonance Raman spectroscopy of the special pair and the accessory
bacteriochlorophylls in photosynthetic reaction centers, J. Phys.
Chem., 98, 6023-6029.
6.Cherepy, N. J., Shreve, A. P., Moore, L. J., Boxer,
S. G., and Mathies, R. A. (1997) Temperature dependence of the
Qy resonance Raman spectra of bacteriochlorophylls, the
primary electron donor, and bacteriopheophytins in the bacterial
photosynthetic reaction center, Biochemistry, 36,
8559-8566.
7.Cherepy, N. J., Shreve, A. P., Moore, L. J., Boxer,
S. G., and Mathies, R. A. (1997) Electronic and nuclear dynamics of the
accessory bacteriochlorophylls in bacterial photosynthetic reaction
centers from resonance Raman intensities, J. Phys. Chem.,
101, 3250-3260.
8.Klevanik, A. V., Ganago, A. O., Shkuropatov, A.
Ya., and Shuvalov, V. A. (1988) Electron-phonon and vibronic structure
of absorption spectra of the primary electron donor in reaction centers
of Rhodopseudomonas viridis, Rhodobacter sphaeroides and
Chloroflexus aurantiacus at 1.7-70K, FEBS Lett.,
237, 61-64.
9.Streltsov, A. M., Vulto, S. I. E., Shkuropatov, A.
Ya., Hoff, A. J., Aartsma, T. J., and Shuvalov, V. A. (1998)
BA and BB absorbance perturbations induced by
coherent nuclear motions in reaction centers from Rhodobacter
sphaeroides upon 30-femtosecond excitation of the primary donor,
J. Phys. Chem., 102, 7293-7298.
10.Vos, M. H., Jones, M. R., Hunter, C. N., Breton,
J., Lambry, J.-C., and Martin, J.-L. (1994) Coherent dynamics during
the primary electron-transfer reaction in membrane-bound reaction
centers of Rhodobacter sphaeroides, Biochemistry,
33, 6750-6757.
11.Yakovlev, A. G., Shkuropatov, A. Ya., and
Shuvalov, V. A. (2002) Nuclear wavepacket motion between P* and
P+BA– potential surfaces with a
subsequent electron transfer to HA in bacterial reaction
centers at 90 K. Electron transfer pathway, Biochemistry,
41, 14019-14027.
12.Shuvalov, V. A., Klevanik, A. V., Ganago, A. O.,
Shkuropatov, A. Ya., and Gubanov, V. S. (1988) Burning of a narrow
spectral hole at 1.7 K in the absorption band of the primary electron
donor of Rhodopseudomonas viridis reaction centers with blocked
electron transfer, FEBS Lett., 237, 57-60.
13.Plato, M., Lendzian, F., Lubitz, W., and Mobius,
K. (1992) Molecular orbital study of electronic asymmetry in primary
donors of bacterial reaction centers, in The Photosynthetic
Bacterial Reaction Center II: Structure, Spectroscopy, and Dynamics
(Breton, J., and Vermeglio, A., eds.) Plenum, New York, pp.
109-118.
14.Hamm, P., and Zinth, W. (1995) Ultrafast initial
reaction in bacterial photosynthesis revealed by femtosecond infrared
spectroscopy, J. Phys. Chem., 99, 13537-13544.
15.Lyle, P. A., Kolaczkowski, S. V., and Small, G.
J. (1993) Photochemical hole-burned spectra of protonated and
deuterated reaction centers of Rhodobacter sphaeroides, J.
Phys. Chem., 97, 6924-6933.
16.Khatypov, R. A., Khmelnitskiy, A. Yu., Khristin,
A. M., Fufina, T. Yu., Vasilieva, L. G., and Shuvalov, V. A. (2012)
Primary charge separation within P870* in wild type and heterodimer
mutants in femtosecond time domain, Biochim. Biophys. Acta,
1817, 1392-1398.
17.Warshel, A., and Parson, W. W. (1987)
Spectroscopic properties of photosynthetic reaction centers. 1. Theory,
J. Am. Chem. Soc., 109, 6143-6152.
18.Parson, W. W., and Warshel, A. (2004) Dependence
of photosynthetic electron-transfer kinetics on temperature and energy
in a density-matrix model, J. Phys. Chem., 108,
10474-10483.
19.Renger, T. (2004) Theory of optical spectra
involving charge transfer states: dynamic localization predicts a
temperature dependent optical band shift, Phys. Rev. Lett.,
93, 1-4.
20.Yakovlev, A. G., Vasilieva, L. G., Shkuropatov,
A. Ya., Bolgarina, T. I., Shkuropatova, V. A., and Shuvalov, V. A.
(2003) Mechanism of charge separation and stabilization of separated
charges in reaction centers of Chloroflexus aurantiacus and of
YM210W(L) mutants of Rhodobacter sphaeroides excited by 20 fs
pulses at 90 K, J. Phys. Chem., 107, 8330-8338.
21.Struve, W. S. (1995) Vibrational equilibration in
absorption difference spectra of chlorophyll a, Biophys.
J., 69, 2739-2744.
22.Yakovlev, A. G., and Shuvalov, V. A. (2015)
Spectral exhibition of electron-vibrational relaxation in P* state of
Rhodobacter sphaeroides reaction centers, Photosynth.
Res., 125, 9-22.
23.Parshakov, A. N. (2010) Physics of
Oscillations [in Russian], Perm State University, Perm, p. 302.
24.Milanovsky, G. E., Shuvalov, V. A., Semenov, A.
Yu., and Cherepanov, D. A. (2015) Elastic vibrations in the
photosynthetic bacterial reaction center coupled to the primary charge
separation: implications from molecular dynamics simulations and
stochastic Langevin approach, J. Phys. Chem., 119,
13656-13667.
25.Eisenmayer, T. J., De Groot, H. J. M., Van de
Wetering, E., Neugebauer, J., and Buda, F. (2012) Mechanism and
reaction coordinate of directional charge separation in bacterial
reaction centers, J. Phys. Chem. Lett., 3, 694-697.
26.Eisenmayer, T. J., Lasave, J. A., Monti, A., De
Groot, H. J. M., and Buda, F. (2013) Proton displacements coupled to
primary electron transfer in the Rhodobacter sphaeroides
reaction center, J. Phys. Chem., 117, 11162-11168.