Isolation of Large Amounts of Highly Pure Mitochondria for “Omics” Studies
M. A. Afanasyeva1*, A. S. Ustiugova1, S. A. Golyshev2, A. T. Kopylov3, A. V. Bogolyubova1, D. E. Demin1,4, P. V. Belousov1, and A. M. Schwartz1,4
1Engelhardt Institute of Molecular Biology, Russian Academy of Sciences, 119991 Moscow, Russia; E-mail: ama@eimb.ru, m.a.afanasyeva@gmail.com2Lomonosov Moscow State University, Belozersky Institute of Physico-Chemical Biology, 119234 Moscow, Russia
3Orekhovich Institute of Biomedical Chemistry, Russian Academy of Medical Sciences, 119121 Moscow, Russia
4Moscow Institute of Physics and Technology, 141701 Dolgoprudny, Moscow Region, Russia
* To whom correspondence should be addressed.
Received October 13, 2017; Revision received October 27, 2017
Ultracentrifugation on a density gradient remains the only reliable way to obtain highly pure mitochondria preparations. However, it is not readily available for any laboratory and has a serious disadvantage of providing low mitochondria yield, which can be critical when working with limited starting material. Here we describe a combined method for isolation of mitochondria for proteomic studies that includes cell disruption by sonication, differential centrifugation, and magnetic separation. Our method provides remarkable enrichment of mitochondrial proteins as compared to differential centrifugation, magnetic separation, or their combination, and it enables the strongest depletion of cytoplasmic components, as assessed by two-dimensional electrophoresis, mass spectrometry, and Western blot. It also doubles the yield of mitochondria. However, our method should not be used for functional studies as most of the isolated organelles demonstrate disturbed structure in electron microphotographs.
KEY WORDS: mitochondria isolation, proteomics, two-dimensional gel electrophoresisDOI: 10.1134/S0006297918010108
Abbreviations: DC, differential centrifugation; DC+MACS, magnetic separation of crude mitochondria fraction obtained by DC; MACS, magnetic separation performed in full compliance with the Miltenyi Biotec protocol; Sonication+DC+MACS, modification of the DC+MACS protocol in which homogenization in hypoosmotic buffer was replaced by sonication in sucrose buffer; WCL, whole cell lysate.
Mitochondria play diverse and important roles in eukaryotic cells.
Besides their primary function of ATP production, mitochondria generate
reactive oxygen species, serve as a major source of cellular NADH,
participate in pyrimidine, lipid, and steroid hormone biosynthesis,
regulate cellular levels of metabolites, amino acids, and cofactors for
various regulatory enzymes, synthesize heme and Fe-S clusters, and
participate in Ca2+ homeostasis, cell signaling, apoptosis,
stress response, epigenetic modulations, and one-carbon metabolism [1-3]. Therefore, it is not
surprising that mitochondria are involved in many human diseases, from
inherited disorders caused by mutation in mitochondrial proteins to
complex diseases like cancer, cardiomyopathies, metabolic syndrome, and
neurodegenerative disorders [4, 5].
Despite some limitations, studies on isolated mitochondria remain instrumental for uncovering changes in the mitochondrial proteome during pathological processes, discovery of tumor neoantigens, and disease biomarkers [6].
Historically, technical papers on isolation of mitochondria have focused primarily on functionality and structural integrity of the isolated organelles, but poorly addressed problems of maximizing yield and minimizing contamination with non-mitochondrial components [7-9]. Published methods allow purification of structurally and functionally preserved mitochondria, but proteomic studies often impose quite different demands. For example, any organelle-targeted proteomic study would significantly suffer from contamination with other cellular components. Moreover, gel-based proteomics (e.g. serological proteome analysis) often involve multiple series of electrophoretic experiments and require large amounts of highly pure mitochondria to be isolated from a limited source (slowly growing adherent cell line, primary cells, patient’s tissue, etc.) while being indifferent to preserving their functionality. To our knowledge, no suitable method satisfying these needs has been published so far.
The three popular approaches to isolation of mitochondria from mammalian tissues and cells are: (i) differential centrifugation (DC), (ii) ultracentrifugation on a density gradient, and (iii) magnetic separation using anti-TOM22 antibodies (MACS). The first method is simple, fast, cheap, and gives the highest yield of mitochondria, but the resulting preparation is heavily contaminated with microsomal fraction and other cellular components. Ultracentrifugation gives much purer mitochondria, but the yield is lower, the method is more laborious, and it requires large and expensive equipment [10]. MACS is a fast and simple method of mitochondria isolation, but there are conflicting reports on the purity of the resulting mitochondria fraction. In the initial report by Hornig-Do et al. [11], this method was shown to provide mitochondria almost as pure as can be achieved by ultracentrifugation, with the advantage of higher yield and simplicity. However, an independent research group found that the mitochondria fraction isolated using the Miltenyi Biotec Mitochondria Isolation Kit based on the Hornig-Do protocol showed very poor enrichment of the target organelles and the resulting preparation was highly contaminated by nuclear and endoplasmic reticulum components [10].
Using two-dimensional gel electrophoresis (2D-PAGE) and mass spectrometry, we tested several modifications of the magnetic separation protocol for mitochondria isolation and describe herein an improved method that yields large quantities of pure mitochondria suitable for “omics” studies without the need for ultracentrifugation.
MATERIALS AND METHODS
Cells. Follicular thyroid carcinoma cell line FTC-133 was purchased from the Health Protection Agency Culture Collection (Salisbury, UK) and cultured in DMEM/F12 (1 : 1) (PanEko, Russia) supplemented with 10% fetal bovine serum (Biosera, France), 2 mM L-glutamine (HyClone, USA), 100 U/ml penicillin, and 100 µg/ml streptomycin (Gibco, USA) at 37°C and 5% CO2.
Whole cell lysate (WCL) preparation. Cells were harvested using 0.05% trypsin/EDTA solution and washed with PBS. The pellet was washed three times by resuspension in ice-cold sucrose buffer (0.25 M sucrose, 10 mM HEPES, pH 7.5) and centrifugation at 1000g, 4°C, for 5 min.
Differential centrifugation (DC). Cells were harvested using 0.05% trypsin/EDTA solution, washed with PBS, resuspended in ice-cold hypoosmotic solution prepared according to Rabilloud [12] (10 mM Tris-HCl, pH 6.7, 10 mM KCl, 15 mM MgCl2 – 10 ml per gram of cell pellet), and left to swell for 5-10 min. The cells were then destroyed by 10 strokes in a glass–Teflon Potter–Elvehjem homogenizer put in ice (this gave about 90% cell disruption as assessed using a hemocytometer). Sucrose solution (2 M) was added to the final concentration of 0.25 M, and nuclei were pelleted by centrifugation at 1200g, 4°C, for 5 min. The supernatant was collected and centrifuged again under the same conditions to minimize contamination with the nuclear fraction. The mitochondria were then pelleted from the supernatant by centrifugation at 10,000g, 4°C, for 10 min.
Magnetic separation using anti-TOM22 antibodies (MACS). The Human Mitochondria Isolation Kit (Miltenyi Biotec, Germany) was used for magnetic separation. Cells were harvested from an almost confluent 175 cm2 flask (~107 cells) using 0.05% trypsin/EDTA solution, pelleted at 500g, washed with PBS, pelleted again, and resuspended in 1 ml of ice-cold lysis buffer provided with the kit. From 80 to 85% cell destruction was achieved by passing the suspension through a 26.5G syringe 15 times on ice. Further procedures were performed according to the manufacturer’s protocol including an optional step: solution of antibody-labeled mitochondria was passed through a 40 µm mesh before being applied to the column.
Differential centrifugation + magnetic separation (DC+MACS). All procedures were performed either on ice or at 4°C. The mitochondria pellet obtained by DC was resuspended in 1 ml of lysis buffer provided with the Mitochondria Isolation Kit. The mitochondria were labeled with anti-TOM22 antibodies and isolated according to the Miltenyi Biotec protocol with minor modifications: an additional wash of the column was performed with 20 ml of 0.5% BSA in PBS before collecting the mitochondria, and additional flushing step with 2 ml of Separation buffer (provided with the kit) was added to increase the yield of mitochondria.
Two important tips help to prevent loss of mitochondria when employing the combined isolation protocol. First, as mitochondria tend to stick to plastic tips, resuspension by pipetting must be replaced by vortexing whenever possible. Second, transferring any concentrated mitochondria solution to a new reaction tube must be followed by rinsing the first tube and pooling these portions of liquid together to collect residual mitochondria.
Sonication + differential centrifugation + magnetic separation (Sonication+DC+MACS). Cells (107-108) were trypsinized, washed with PBS, resuspended in 4 ml of ice-cold sucrose buffer (0.25 M sucrose, 10 mM HEPES, pH 7.5), and sonicated using a Bandelin Sonopuls HD 2070 MS 72 (Bandelin Electronic, Germany) at 50% cycle and 90% power for 10, 15, or 20 s in a 50-ml tube placed in an icebox. Pelleting of nuclear fraction and further steps were identical to the DC+MACS protocol.
After isolation by either procedure, the mitochondria were washed three times by adding the sucrose buffer to the pellet, extensive vortexing, and centrifugation at 13,000g, 4°C, for 2 min. The mitochondria and cell pellets were stored at –80°C.
Two-dimensional gel electrophoresis (2D-PAGE). Mitochondria were lysed in isoelectrofocusing (IEF) buffer without bromophenol blue (7 M urea, 2 M thiourea, 2% CHAPS, 0.25% Bio-Lyte 3/10 Ampholyte (Bio-Rad, USA), 43 mM DTT; 100 µl of buffer per 20 mg of mitochondria pellet) and sonicated twice using the Bandelin Sonopuls HD 2070 equipped with MS 73 microtip (Bandelin Electronic) at 10% cycle and 90% power for 5 s in a 1.5 ml microcentrifuge tube placed on ice. The lysate was centrifuged at 14,000g, 20°C, for 10 min. The supernatant was transferred to a new tube, and protein concentration was measured by Bradford assay (Bio-Rad).
One-hundred micrograms of total mitochondrial protein in 130 µl of IEF buffer with bromophenol blue were loaded onto a 7-cm ReadyStrip™ IPG strip (pH 3-10 nonlinear gradient; Bio-Rad). Rehydration and IEF were performed using a PROTEAN IEF Cell (Bio-Rad) at 20°C in the following regimen: 1 h – passive rehydration; 12 h – active rehydration at 50 V; 00:30 volt-hours at 250 V, rapid voltage slope; 33,000 volt-hours at 4500 V, rapid voltage slope; supporting regimen at 800 V for no more than 5 h. The strips were equilibrated for 20 min in equilibration buffer (6 M urea, 0.375 M Tris-HCl, pH 8.8, 20% glycerol, 2% SDS, 2% DTT). The second dimension was run in 1-mm mini-gels (10 or 11% acrylamide/bis-acrylamide, 29 : 1), 20 mA per gel. Electrophoretic experiments were performed in triplicates for each isolation method.
Coomassie blue staining. Gels were stained with freshly-prepared colloidal Coomassie blue (10% ammonium sulfate, 0.1% Coomassie blue G-250, 3% phosphoric acid, 20% ethanol) overnight on a shaker and washed with deionized water for 6 h, scanned, and stored in 1% acetic acid at 4°C until excision of protein spots. Spots were manually classified into five categories according to their intensities.
In-gel tryptic digestion and liquid chromatography–mass spectrometry (LC–MS) analysis. Spots of interest were excised from 2D gels using pipet tips. The fragments were washed twice with 40% methanol/10% glacial acetic acid for 15 min at 45°C upon vigorous shaking and rinsed three times for 3 min each with deionized water at 30°C with shaking at 500 rpm. Then the fragments were equilibrated in 50 mM triethylammonium bicarbonate buffer (Sigma, USA), pH 8.0, and dried under vacuum at 45°C for 60-90 min. The dry gel fragments were rehydrated in trypsin inactivating solution (50 ng/µl in 30 mM acetic acid) at 4°C for 5 min, and then 75 mM triethylammonium bicarbonate buffer, pH 8.0, was added. The protein samples were digested with trypsin (18,611 U/mg; Promega, USA) for 4 h. The reaction was stopped by 1% acetic acid. Peptides were extracted by three consecutive changes (15 min each) of 1% trifluoroacetic acid at increasing temperatures (45-65°C). Collected fractions were pooled together and dried under vacuum at 30°C. The pellet was redissolved in 10-15 µl of 0.5% formic acid and transferred to glass inserts for LC-MS analysis.
Liquid chromatographic (LC) separation was performed using an UltiMate 3000 RSLCnano System (Thermo Scientific, USA). The peptides were separated on an Acclaim® RSLC PepMapC18 analytical column (75 µm × 150 mm, 1.8 µm particle size, 100 Å pore size; Thermo Scientific) coupled with an enrichment C18 PepMap µ-precolumn (300 µm × 5 mm, 5 µm particle size, 100 Å pore size; Thermo Scientific). The peptides were loaded onto the µ-precolumn in mobile phase C (2.5% acetonitrile, 0.08% formic acid, 0.03% acetic acid, pH 2.66) for 4 min at 15 µl/min flow rate. The peptides were separated in an eluting gradient of mobile phase A (0.08% formic acid, 0.03% acetic acid, pH 2.70) and mobile phase B (0.08% formic acid, 0.03% acetic acid in acetonitrile) starting with 2% of B for 3.5 min and followed by linear increase in B concentration up to 35% over 37.5 min, and a final hold step in isocratic mode for 4 min. Then the column was washed with 98% B for 7 min at 0.45 µl/min flow rate and re-equilibrated under the initial conditions for 13 min prior to the next injection step.
Mass spectrometric (MS) analysis was performed on an Orbitrap Fusion Tribrid Mass Spectrometer (Thermo Scientific) – a high-resolution mass spectrometer equipped with a nano-flow NSI ion source. The instrument was operated in the positive ionization mode. Precursor ions and fragment ions were isolated using a quadrupole with asymmetric isolation window (–1.5/+2.0 Th) following detection in an Orbitrap ultra-high field analyzer using the top-speed data-dependent approach within 2.5 s duty cycle. Precursor ions with charge states between z = 2+ and z = 6+ were triggered for fragmentation in HCD (high-energy collision dissociation) mode in stepwise manner using 27 ± 20% normalized collision energy (normalization to default charge z = 2+). Precursor ions were accumulated either within the maximum integration time of 85 ms or until the C-trap was saturated with 4·105 ions and registered at resolution 60,000 in the range 420-1200 m/z. Fragment ions were accumulated either within 60 ms or until the C-trap was saturated with 5·104 ions and registered at resolution 15,000 in the dynamic charge-dependent range with fixed first mass of 110 m/z.
The raw files were converted to MSM data format. Proteins were identified using the MASCOT search engine against the Human UniProt database (May 2017) with the following settings: enzyme – trypsin (cleavage on K/R unless the next amino acid residue is P) with maximum of two missed cleavages; MS level tolerance within ±10 ppm; MS/MS level tolerance within ±0.05 Da; counting all parent ions with charge states between 2+ and 6+; using percolator for decoy scoring. Proteins with at least two shared peptides were merged.
Transmission electron microscopy. A mitochondria pellet was incubated overnight at 4°C in fixing solution containing 2% formaldehyde and 2% glutaraldehyde in Separation buffer (provided with the Mitochondria Isolation Kit). The sample was then washed three times with 100 mM sodium cacodylate and post-fixed for 60 min with 1% osmium tetroxide in 100 mM sodium cacodylate at 4°C. Dehydration was performed as follows: 50% ethanol (three changes, 15 min each), 70% ethanol (two changes), 96% ethanol (two changes), and anhydrous acetone (three changes). The sample was infiltrated with an increasing series of acetone–resin mixes, followed by two changes of pure Epon-812 at 37°C. Finally, the sample was placed in pure Epon-812 resin (SPI Inc., USA) and cured for 72 h at 70°C. Ultrathin 90-nm sections were prepared using a Reicher-Jung Ultracut E ultramicrotome (Reichert-Jung, Austria) equipped with a diamond knife. Sections were mounted on formvar-coated copper slot grids (Ted Pella, USA) and contrasted with 2% aqueous uranyl acetate for 40 min and lead citrate for 2 min. Sections were examined and photographed using a JEM-1400 electron microscope (JEOL Inc., Japan) equipped with Quemesa CCD (OSIS, Germany) and run at 100 kV.
Western blot. Whole cell or mitochondria lysates were mixed 1 : 4 with 5× Laemmli buffer, boiled for 5 min, and loaded onto 10% polyacrylamide gel (30 µg of total protein per lane). Western blot was performed as described in [13]. We used the following primary antibodies diluted in 5% non-fat dry milk in Tris-buffered saline: anti-RNA polymerase II (ab5095, Abcam, USA; 1 : 1000), anti-histone H3 (No. 9715, Cell Signaling, USA; 1 : 1000), anti-β-actin (Cell Signaling; 1 : 1000), anti-GRP 78 (sc-13968, Santa Cruz Biotechnology, USA; 1 : 200), and rabbit antiserum against SWI/SNF complex subunit SMARCC1 (P155) kindly provided by Dr. N. V. Soshnikova [14]. The secondary antibody was HRP-conjugated goat anti-rabbit IgG (No. 31460, Thermo Scientific; 1 : 30,000).
Quantification of mitochondrial DNA content by real-time PCR. For each of the three replicates, a whole cell or mitochondria suspension was divided in two equal parts and pelleted by centrifugation at 13,000g, 4°C, for 2 min. The supernatants were removed, and the pellets were frozen at –80°C. One part was lysed in RIPA buffer (150 mM NaCl, 1% NP-40, 0.5% sodium deoxycholate, 0.1% SDS, 50 mM Tris, pH 8.0) on ice and its total protein content was measured by Bradford protein assay (Bio-Rad). The second part was used for DNA isolation using a GeneJET Genomic DNA purification Kit (Thermo Scientific). Internal DNA control (300 ng of pcDNA 3.1 Hygro+ with inserted PTTG1 gene) was added to the probe before loading on a purification column, and quantities of mitochondrial DNA and internal DNA control were measured by real-time PCR as described in [13] using the following primers: mitDNA-F – CACCCAAGAACAGGGTTTGT; mitDNA-R – TGGCCATGGGTATGTTGTTAA; PTTG1-F – TCCCCTTGAGTGGAGTGCCT; PTTG1-R – GTCACAGCAAACAGGTGGCAA. Mitochondrial DNA quantity normalized to internal DNA control was divided by the total protein amount to obtain the relative mitochondrial DNA content.
RESULTS AND DISCUSSION
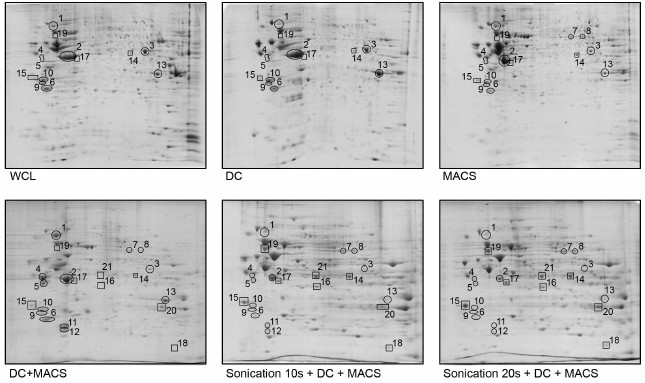
Among many published methods of mitochondria isolation, most are based on DC, and many commercial kits also employ this principal. The only alternative that does not require specialized and expensive equipment (as opposed to ultracentrifugation and free-flow electrophoresis) is magnetic separation using anti-TOM22 antibodies. Therefore, we first analyzed the proteomic profiles of mitochondria isolated by these two fundamentally different techniques requiring only basic equipment: DC (Fig. 1, left) and the original Miltenyi Biotec protocol of MACS (Fig. 1, right) and compared them to electrophoretic pattern of WCL. As Fig. 2 (upper row) and table illustrate, both DC and the original MACS protocols did not provide satisfactory elimination of non-mitochondrial proteins. ENO1, YWHAZ, YWHAE, and TPM4 in DC preparation, HSP90AB1 in MACS preparation, and ACTB in both DC and MACS preparations did not show any depletion compared to WCL. Moreover, ANXA2 was enriched in the DC preparation. In general, the MACS protocol performed slightly better, but contamination with non-mitochondrial proteins remained unacceptably high.
Fig. 1. Graphical summary of mitochondria isolation methods compared in the study. DC, differential centrifugation; DC+MACS, magnetic separation of crude mitochondria fraction obtained by DC; Sonication+DC+MACS, modification of the DC+MACS protocol in which homogenization in hypoosmotic buffer was replaced by sonication in sucrose buffer; MACS, magnetic separation performed in full compliance with the Miltenyi Biotec protocol. For details see “Materials and Methods”.
Fig. 2. Two-dimensional electrophoresis of FTC-133 whole cell lysate and lysates of FTC-133 mitochondria purified according to five different protocols. WCL, whole cell lysate; DC, differential centrifugation; MACS, magnetic separation performed if full compliance with the Miltenyi Biotec protocol; DC+MACS, magnetic separation of crude mitochondria fraction obtained by DC; Sonication+DC+MACS, modification of the DC+MACS protocol in which homogenization in hypoosmotic buffer using a Potter–Elvehjem homogenizer was replaced by sonication in sucrose buffer for the indicated time. Protein spots identified as mitochondrial by mass spectrometry are enclosed in rectangles; spots identified as non-mitochondrial are enclosed in circles. Spot identities are listed in the table. One-hundred micrograms of total protein, nonlinear pH gradient 3-10, Coomassie blue staining.
Spot identities, subcellular localization, and arbitrary intensities in
whole cell lysate and lysates of mitochondria obtained by four
different protocols
Notes: WCL, whole cell lysate; DC, differential centrifugation; MACS,
original Miltenyi Biotec protocol of magnetic separation; DC+MACS,
magnetic separation of crude mitochondria fraction obtained by DC;
Sonication+DC+MACS, modification of the DC+MACS protocol in which
homogenization in hypoosmotic buffer is replaced by sonication in
sucrose buffer. For details, see “Materials and Methods”.
Spots were manually ranked according to their intensities as follows:
(+) very faint; (++) faint; (+++) moderate; (++++) strong; (+++++) very
strong; NL, spot could not be localized in the corresponding 2D gel.
LC-MS results are present in supplementary Table S1 (see
Supplement).
As the principle of magnetic separation was expected to enable isolation of very pure organelles (with the only theoretical exception being co-isolation with physically attached cellular structures, such as mitochondria-associated membranes [15]), we supposed that nuclei and cell debris could be nonspecifically stuck in columns, and low-speed pre-centrifugation was expected to solve this problem. To this end, we added an additional step to the original Miltenyi Biotec protocol – centrifugation of cell lysate at 1000g for 5 min prior to incubation with anti-TOM22 antibodies. This modification of the protocol resulted in 2-fold decrease in mitochondria yield and would have led to unjustified waste of columns (each LS column has a capacity of up to 700 µg of mitochondrial protein, whereas our modified protocol yielded 75 µg protein per 2·107 cells). To overcome this problem, we used crude mitochondria fraction obtained by DC as a starting material for magnetic separation (Fig. 1, middle-left), which was also expected to improve purity. The resulting 2D-electrophoregram is shown in Fig. 2. Contrary to our expectations, combined DC+MACS protocol did not substantially improve the purity of mitochondria. Some proteins (HSP90AB1, VIME) demonstrated enrichment as compared to DC, MACS, or even WCL.
Sonication in sucrose buffer was shown to be the best cell disruption method for proteomic studies of mitochondria among many tested options, providing high yield and purity [16]. Chaiyarit and Thongboonkerd subjected cultured cells to sonication in sucrose buffer using a Bandelin Sonopuls HD 200 homogenizer equipped with MS 72/D for 3, 5, and 10 s (50% cycle), and chose 10-s regimen as the best option. We compared this cell disruption method with classical homogenization in hypoosmotic buffer using a Potter–Elvehjem homogenizer, as well as with two extended sonication regimens (15 and 20 s). Cell disruption level and mitochondria yield increased with increasing sonication time from 10 to 15 s, and it remained almost unchanged with further increase, reaching up to 90 mg of mitochondria per gram of wet cell mass at 20 s (mean ± SD = 55.7 ± 13.4). This was 7.7-time more than using hypoosmotic buffer and Potter–Elvehjem homogenizer (mean ± SD = 11.7 ± 2.6; Fig. S1 in the Supplement to this paper on the site of the journal http://protein.bio.msu.ru/biokhimiya and Springer site Link.springer.com).
Replacing the Potter–Elvehjem homogenization with sonication remarkably altered protein spot intensities and even the presence in 2D gels, whereas duration of sonication did not matter (Fig. 2, lower row). We analyzed 22 protein spots whose intensity or presence substantially differed between Sonication+DC+MACS and other protocols using LC-MS. Of those, 21 spots could be reliably identified as containing either only mitochondrial or only non-mitochondrial proteins (the table and Table S1 from Supplement). Eight spots referred to one or several mitochondrial proteins, and their intensities were greatly enhanced after sonication. Thirteen spots corresponded to 10 non-mitochondrial proteins. Of those, HSP90AB1, ENO1, VIME, YWHAZ, YWHAE, TPM4, CTSB, and ANXA2 became almost undetectable after sonication. ACTB (β-actin), which was very abundant in all other preparations, showed great reduction in quantity (Figs. 2 and 3). However, LMNA demonstrated enrichment after sonication.
Fig. 3. Contamination of mitochondria preparations obtained by four different isolation procedures with non-mitochondrial proteins assessed by Western blotting. WCL, whole cell lysate; DC, differential centrifugation; MACS, magnetic separation performed if full compliance with the Miltenyi Biotec protocol; DC+MACS, magnetic separation of crude mitochondria fraction obtained by DC; Sonication+DC+MACS, modification of the DC+MACS protocol in which homogenization in hypoosmotic buffer using a Potter–Elvehjem homogenizer was replaced by sonication in sucrose buffer for 20 s. Pol II, DNA-directed RNA polymerase II; P155, SWI/SNF complex subunit SMARCC1; H3, histone H3; GRP 78, 78 kDa glucose-regulated protein.
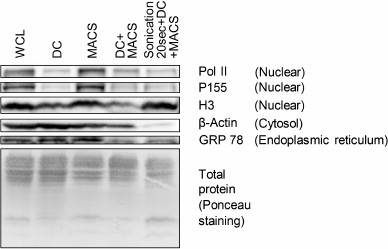
To clarify if other nuclear proteins were also enriched in the Sonication+DC+MACS preparation, we used Western blot to measure abundance of DNA-directed RNA polymerase II, SWI/SNF complex subunit SMARCC1, and histone H3 in mitochondria samples isolated by the tested protocols (Fig. 3). We found that unlike LMNA gene products, polymerase II and chromatin remodeling complex subunit SMARCC1 were largely depleted in the Sonication+DC+MACS as well as in the DC and DC+MACS preparations. Histone H3 was present in all mitochondria samples, being most abundant in the Sonication+DC+MACS sample. Thus, the Sonication+DC+MACS preparation appeared to be substantially contaminated only with extremely abundant nuclear proteins [17]. One possible explanation for this finding is that sonication causes DNA fragmentation and stronger destruction of nuclei compared to Potter–Elvehjem or syringe homogenization, thus releasing more nuclear proteins that further nonspecifically contaminate the mitochondria fraction. The MACS preparation contained as much nuclear proteins as the WCL, possibly due to clogging of the column by nuclei and/or their fragments.
As no proteins representing endoplasmic reticulum were found by our mass-spectrometric analysis, we assessed the amount of GRP 78 (a chaperone located in the lumen of endoplasmic reticulum) in mitochondria samples obtained by the four tested protocols using Western blot. This showed that only the DC+MACS and Sonication+DC+MACS procedures were able to decrease the amount of this protein (Fig. 3).
We studied mitochondria preparation obtained by the best-performing protocol (20 s Sonication+DC+MACS) using transmission electron microscopy. It revealed mitochondria of varying integrity (Fig. 4a). We classified them into three categories and quantified each type among 237 mitochondria detected on consecutive sections. Organelles with well-preserved cristae, electron-dense (gray) matrix, and intact outer and inner membranes (Fig. 4b) comprised 37%; organelles with well-preserved cristae lacking electron-dense content (Fig. 4c) – 24%; and organelles with distorted cristae (Fig. 4d) – 39%. Double-membrane vesicles were also seen, which likely represent mitochondrial debris (Fig. 4e). All mitochondria appeared swollen and nearly spherical. Single membrane-bound vesicles and flattened cisternae were also present in the sample along with various forms of damaged mitochondria. These data suggest that mitochondria obtained by the 20 s Sonication+DC+MACS protocol were generally nonfunctional, and this method should not be used to study their activity.
Fig. 4. Electron micrograph of the mitochondria preparation obtained by the 20 s Sonication+DC+MACS protocol. a) Overview. Varying degree of mitochondria preservation can be seen. b) Well-preserved mitochondria with electron-dense matrix. c) Well-preserved mitochondria with electron-transparent matrix. d) Mitochondria with distorted cristae. e) Double- and single-membrane vesicles. Arrowheads mark magnetic beads; the asterisks mark clusters of an unidentified contaminant (presumably, precipitated BSA – a component of the Separation buffer used for mitochondria isolation).
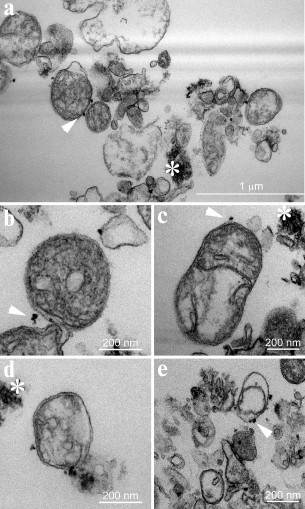
To exclude possible microsomal contamination, we evaluated the presence of single-membrane vesicles by examining sets of consecutive sections. The number of single-membrane bound vesicles with electron-transparent content appeared to be low, and their total volume was very small compared to the total volume of mitochondria and mitochondria-derived fragments. We did not discover any readily recognizable fragments of nuclear envelope in the sample.
To quantify enrichment of mitochondria by the 20 s Sonication+DC+MACS protocol, we measured mitochondrial DNA content using real-time PCR and normalized it to the total protein amount. The enrichment averaged 3-fold compared to whole cell preparation (Fig. S2 in the Supplement).
Our data show that Sonication+DC+MACS provides incomparably high enrichment of mitochondrial proteins and the strongest depletion of cytoplasmic components among all tested methods. Beyond that, the Sonication+DC+MACS procedure doubles the yield of mitochondria compared to DC and MACS. Not very abundant nuclear proteins also get substantially depleted, although such plentiful proteins as histone H3 and lamins, significantly contaminate the Sonication+DC+MACS fraction.
The DC results in equally low contamination with low-abundance nuclear proteins and much lower contamination with histone H3 and lamins compared to Sonication+DC+MACS. However, enrichment of mitochondrial proteins is very poor, and the presence of cytoplasmic components is very high. The DC+MACS protocol does not have any advantages compared to DC and lowers mitochondria yield 2-fold. The MACS protocol did not demonstrate any advantages compared to other tested methods of mitochondria isolation.
In summary, combination of cell disruption by sonication with differential centrifugation and consecutive magnetic separation yields high quantities of very pure mitochondria suitable for large-scale proteomic studies. However, this isolation method should not be used for functional studies of mitochondria, as most of the purified organelles lose their integrity.
Acknowledgments
This work was supported by the Russian Science Foundation (project No. 16-15-10423). Mass spectrometric measurements were performed using the equipment of “Human Proteome” Core Facility of the Institute of Biomedical Chemistry (Russia), which is supported by the Ministry of Education and Science of the Russian Federation (agreement 14.621.21.0017, Project ID RFMEFI62117X0017). Some of the experimental procedures were performed using equipment obtained under the Moscow State University development program PNR5.13.
REFERENCES
1.Nunnari, J., and Suomalainen, A. (2012)
Mitochondria: in sickness and in health, Cell, 148,
1145-1159.
2.Zong, W. X., Rabinowitz, J. D., and White, E.
(2016) Mitochondria and cancer, Mol. Cell, 61,
667-676.
3.D’Aquila, P., Bellizzi, D., and Passarino, G.
(2015) Mitochondria in health, aging and diseases: the epigenetic
perspective, Biogerontology, 16, 569-585.
4.Palmfeldt, J., and Bross, P. (2017) Proteomics of
human mitochondria, Mitochondrion, 33, 2-14.
5.Picard, M., Wallace, D. C., and Burelle, Y. (2016)
The rise of mitochondria in medicine, Mitochondrion, 30,
105-116.
6.Eremina, L., Pashintseva, N., Kovalev, L.,
Kovaleva, M., and Shishkin, S. (2017) Proteomics of mammalian
mitochondria in health and malignancy: from protein identification to
function, Anal. Biochem., doi: 10.1016/j.ab.2017.03.024.
7.Witter, R. F., Watson, M. L., and Cottone, M. A.
(1955) Morphology and ATPase of isolated mitochondria, J. Biophys.
Biochem. Cytol., 1, 127-138.
8.Weinbach, E. C. (1961) A procedure for isolating
stable mitochondria from rat liver and kidney, Anal.
Biochem., 2, 335-343.
9.Picard, M., Taivassalo, T., Ritchie, D., Wright, K.
J., Thomas, M. M., Romestaing, C., and Hepple, R. T. (2011)
Mitochondrial structure and function are disrupted by standard
isolation methods, PLoS One, 6, e18317.
10.Kappler, L., Li J., Haring, H. U., Weigert, C.,
Lehmann, R., Xu, G., and Hoene, M. (2016) Purity matters: a workflow
for the valid high-resolution lipid profiling of mitochondria from cell
culture samples, Sci. Rep., 6, 21107.
11.Hornig-Do, H. T., Gunther, G., Bust, M.,
Lehnartz, P., Bosio, A., and Wiesner, R. J. (2009) Isolation of
functional pure mitochondria by superparamagnetic microbeads, Anal.
Biochem., 389, 1-5.
12.Rabilloud, T. (2008) Mitochondrial proteomics:
analysis of a whole mitochondrial extract with two-dimensional
electrophoresis, Methods Mol. Biol., 432,
83-100.
13.Afanasyeva, M. A., Britanova, L. V., Korneev, K.
V., Mitkin, N. A., Kuchmiy, A. A., and Kuprash, D. V. (2014) Clusterin
is a potential lymphotoxin beta receptor target that is upregulated and
accumulates in germinal centers of mouse spleen during immune response,
PLoS One, 9, e98349.
14.Brechalov, A. V., Georgieva, S. G., and
Soshnikova, N. V. (2014) Mammalian cells contain two functionally
distinct PBAF complexes incorporating different isoforms of PHF10
signature subunit, Cell Cycle, 13, 1970-1979.
15.Wieckowski, M. R., Giorgi, C., Lebiedzinska, M.,
Duszynski, J., and Pinton, P. (2009) Isolation of
mitochondria-associated membranes and mitochondria from animal tissues
and cells, Nat. Protoc., 4, 1582-1590.
16.Chaiyarit, S., and Thongboonkerd, V. (2009)
Comparative analyses of cell disruption methods for mitochondrial
isolation in high-throughput proteomics study, Anal. Biochem.,
394, 249-258.
17.Geiger, T., Wehner, A., Schaab, C., Cox, J., and
Mann, M. (2012) Comparative proteomic analysis of eleven common cell
lines reveals ubiquitous but varying expression of most proteins,
Mol. Cell. Proteomics, 11, M111. 014050.
Supplemental Figs S1-S2 and Table S1 (PDF)