REVIEW: Interpreting Chromosomal Rearrangements in the Context of 3-Dimentional Genome Organization: A Practical Guide for Medical Genetics
V. S. Fishman1,2*, P. A. Salnikov1,2, and N. R. Battulin1,2
1Federal Research Center, Institute of Cytology and Genetics, Siberian Branch of the Russian Academy of Sciences, 63009 Novosibirsk, Russia; E-mail: minja-f@ya.ru2Novosibirsk State University, 630090 Novosibirsk, Russia
* To whom correspondence should be addressed.
Received November 15, 2017; Revision received December 4, 2017
In this exciting era of “next-gen cytogenetics”, the use of novel molecular methods such as comparative genome hybridization and whole genome and whole exome sequencing becomes more and more common in clinics. This results in generation of large amounts of high-resolution patient-specific data and challenges the development of new approaches for interpretation of obtained information. Usually, interpretation of chromosomal rearrangements is focused on alterations of linear genome sequence, underestimating the role of spatial chromatin organization. In this article, we describe the main features of 3-dimentional genome organization, emphasizing their role in normal and pathological development. We highlight some tips to help physicians estimating the impact of chromosomal rearrangements on the patient phenotype. A separate section describes available tools that can be used to visualize and analyze human genome architecture.
KEY WORDS: chromosomal rearrangements, 3-dimensional nuclear architecture, TAD, 3C, Hi-C, human congenital disordersDOI: 10.1134/S0006297918040107
Abbreviations: 3C, chromosome conformation capture (technology); ChIP, chromatin immunoprecipitation; DSBs, double-strand DNA breaks; Hi-C method, high-throughput extension of 3C technology; IGH, immunoglobulin heavy chain; TADs, topologically associating domains.
Genome compaction is required to fit approximately two meters of human
DNA into a cell nucleus. There are several levels of genome compaction,
each involving interaction of DNA with specific proteins. At the
primary level, the DNA is wrapped around histones (Fig. 1), which resembles thread (DNA) wound around a spool
(nucleosomes formed by histones) [1]. The wrapped
DNA forms a fiber, which twists and bends creating multiple loops.
Large loops may contain smaller loops, generating a structure close to
fractal [2]. It is considered that architectural
proteins, especially CTCF and cohesin, play the main role in loop
formation [3].
Fig. 1. The major structures formed during DNA compaction. Left: schematic image of hierarchical levels of DNA compaction in the nucleus. Right: their representation on Hi-C maps. Arrow indicates a peak that reflects the fact that anchor loci are juxtaposed by loop closure.
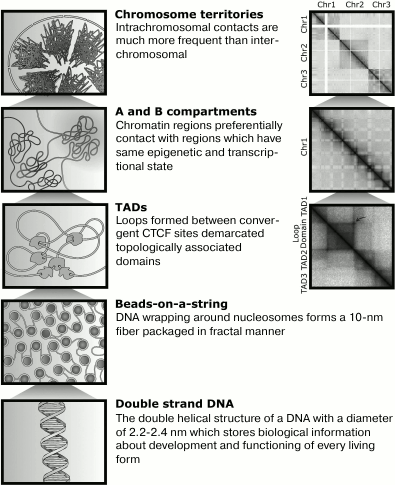
Both levels of DNA compaction are important for genome functioning. Modifications of histones affect DNA accessibility and demarcate regions of active or repressed chromatin [4]. Loops allow spatial connections between promoters and distal regulatory elements. Groups of loops are coordinately regulated during basic genomic processes: transcription and replication, representing units of genome organization [5-7].
Techniques developed for analyzing histone modifications, such as ChIP (chromatin immunoprecipitation), provide extensive information about epigenetic changes of chromatin during normal and pathological development [4]. Much less is known about spatial organization of the genome, the role of 3-dimensional nuclear architecture in gene regulation, and clinical consequences of alteration of chromatin topology.
CHROMOSOME CONFORMATION CAPTURE METHODS
For a long time, microscopy was almost the only tool to study spatial organization of genomes. Major principles of genome architecture – the presence of chromosomal territories and radial asymmetry of eu/heterochromatin distribution [8] were suggested and proved using different microscopy-based methods, especially fluorescent in situ hybridization (FISH). Although the resolution of optical imaging systems increases with time, there is a fundamental maximum to the resolution of any optical system due to the diffraction limit.
To overcome the resolution limit of optical systems, Dekker and colleagues proposed a novel biochemical approach called chromosome conformation capture (3C) to study chromosomal architecture indirectly, without visualizing DNA [9]. The original 3C technology and its derivatives require DNA fixation and genome-wide generation of double strand breaks in the first step of the experiment. Next, the method employs the fact that ends of spatially collocated fragments of DNA can be ligated to each other, and products of the ligation reaction can be detected using methods of molecular biology (often by DNA-sequencing). Each product of ligation reaction between pairs of loci is interpreted as evidence of physical contact (or interaction) between these loci in nuclei. For details of 3C technology, we recommend a recent review [10].
It is important to note that in a 3C experiment distance between loci is estimated indirectly, based on the number of physical interactions between them – the more interactions are detected, the closer loci are considered to be located. For this reason, it is possible to precisely estimate distance, even if it is below the limit of microscopy resolution. Moreover, the Hi-C method, the high-throughput extension of 3C technology, provides information about contact frequencies of all pairs of genomic loci in a single experiment [11].
There is a special characteristic of all 3C technologies, including Hi-C, which one should bear in mind while analyzing experimental data. The farther apart two loci are located in linear DNA molecules, the rarer, on average, they contact with each other [7, 9, 11]. Because sequencing of 3C-reaction products is a stochastic process, the less abundant the product is, the deeper sequencing needed to estimate its quantity. To estimate distances between loci separated by several hundreds of megabases, one should capture several billion of contacts – the sequencing costs for such experiments account for hundreds of thousands of dollars [7].
Recommendation: Use Hi-C databases containing large numbers of contacts (interactions), preferentially more than 100 million. Some databases provide numbers of reads instead of numbers of contacts. Note, that number of contacts is typically several times smaller than number of reads because of filters applied during reads-to-contacts conversion.
To reduce experiment cost, researchers usually conduct moderately deep sequencing and merge information about contacts of neighboring loci. Theoretically, information about contacts can be acquired for a locus as small as 400-4000 bp; the exact locus size is determined by properties of enzymes used in a 3C experiment. In existing databases, the actual size of a locus called resolution vary from 5000 to 100,000 bp. Lower resolution means higher minimal locus size, i.e. resolution 5000 is higher than 100,000. Of course, the fewer the contacts are determined in Hi-C experiment, the lower will be the resolution of the analysis.
Recommendation: Exploring Hi-C data, the user may use different resolutions. Considering that distant loci have small numbers of interactions, we recommend using low resolution for analysis of faraway regions. Averaging of contacts of several neighboring loci will allow better estimation of rare long-range contacts.
SPATIAL CONTACT MAPS AND THEIR ANALYSIS
Result of Hi-C experiment is an information about pairwise contact frequency for every genome loci. Such information may be represented as a table, where genome coordinates situated on rows and columns and respective contact frequencies situated on table cells (Fig. 1). Contact frequencies may be indicated by color scale, and thus patterns of contact distribution are visible at first sight. Such table is called the heatmap or the matrix of spatial contacts.
Functional Role of Spatial Genome Organization
Hi-C allowed identifying various topological structures in the human genome ranging from several kilobases to megabases and investigating their functional role. Consider these structures and the aftermath of their disruptions in the context of the development of genetic diseases.
Compartments. Compartments are long DNA regions having the same distribution of contacts with other genome loci [11, 12]. There are several definitions of compartments. For example, all genome can be divided into active A-compartment and inactive B-compartment [11, 12]. Regions from the same compartments often spatially interact, and contacts between loci from different compartments are infrequent. Therefore, a Hi-C map looks like a chessboard – intensive colored squares of interactions between regions from certain compartment alternates with squires depleted of contacts, which belong to intersections of regions from different compartments (Fig. 1).
Taking that compartments are identified by analysis of spatial contacts of loci, one may consider that compartments matter only for spatial genome organization. However, in fact, loci of A- and B-compartments are different not only by situation in nucleus, they have different genetic and epigenetic features [5, 12]. A-compartment characterized by high GC-content, high gene density, transcriptional activity, and epigenetic modification that is specific for open chromatin. B-compartment is characterized by opposite features and corresponds to heterochromatin [5, 12]. Compartments may be further divided to more types, for example, in one report [7] the authors identified six types of compartments: A1, A2, B1, B2, B3, B4, and each of these types display specific sets of epigenetic markers.
It is difficult to predict how chromosomal rearrangement may affect structure of compartments. With respect of the rearrangement, one should consider the phenomenon of “spreading”, when chromatin markers propagate through the genome [13]. This means that fusion of regions from different compartments as result of rearrangement may lead to alterations of their epigenetic state.
Loops. It may be easy to notice by Hi-C map analysis that spatial distance of DNA loci strictly correlates to distance between them in the linear molecule. This observation is consistent with the fractal model of genome compaction – the closer regions lie in linear DNA, the higher frequency of their spatial contacts. Therefore, having information about genome coordinates of any two loci we can expect defined frequency of contacts between them. For several loci, observed contact frequencies is significantly higher than expectations [7]. Such contacts are defined as peaks and may be explained as a stable chromatin loop between corresponding loci (anchors of the loop) (Fig. 1).
Loops play a crucial role in regulation of genes. In most cases, a loop contains interacting enhancers and promoters [7]; therefore, loop disruption leads to dysregulation of gene expression [14-17]. Sometimes several smaller loops appear in one large loop, and specific enhancer–promoter pairs lie in each of them [7]. There is also a case where a large regulatory element (super-enhancer) is situated in one loop with several genes whose functions it regulates [18].
In the great majority of cases, loop anchors are convergent CTCF-binding sites [7]. It is experimentally shown that deletion or inversion of a CTCF-binding site disrupts the local loop organization of the genome [14, 15]. This means that comparing translocation coordinates with CTCF-binding sites we may conjecture how rearrangement can influence loop topology near it borders.
There are two experimental approaches for detecting CTCF-binding sites in the whole genome – ChIP-seq and ChIA-PET. Using a dataset obtained by ChIA-PET is preferable because this method not only allows searching for CTCF-binding sites but also identifying which pairs of CTCF proteins interact in vivo forming a loop [19]. ChIP-seq only reveals CTCF-binding sites, and because far from all pairs of convergent CTCF-binding sites form a loop, it is difficult to predict consequences of CTCF-binding site rearrangement based on ChIP-seq data.
Recommendation: Pay attention to CTCF-binding site locationы when analyzing chromosome rearrangement. If a CTCF-binding site near a loop anchor is deleted or inverted, and ChIA-PET verifies involvement of the CTCF-site in loop formation, it is probable that regulation of genes in this loop may be disrupted.
Topologically associated domains, also known as TADs, are regions of DNA that often contact within themselves but rarely with other genomic loci (Fig. 1) [6]. We may imagine a TAD as a ball, or ravel of loops, isolated from surrounding chromatin. This analogy is useful but not true by looking at TAD formation mechanisms. TADs likely do not exist in a single cell, but represent statistical ensemble of dynamic small loops, forming inside a big stable loop. A stable loop is revealed in a greater fraction of cells, but dynamic loops are short-lived and exist in a small number of cells. By averaging of information about loops in a cell population, topological structure that is reminiscent of a ball become detectable [20]. Therefore, TAD boundaries often represent an anchor of a strongly marked loop on a Hi-C heatmap (Fig. 1). TADs having such a loop are called loop domains, and these domains can be visualized in a Hi-C map because of a peak in a vertex of a triangle corresponding to this domain.
Considering that TADs are formed by loops, it is not surprising that their boundaries are enriched with convergent CTCF-binding sites [6, 7, 19]. There are many other elements marking TAD boundaries, of which we note housekeeping genes. It is believed that their active transcription interferes with a chromatin loop appearing, thereby preventing contacts of TADs with each other [6, 21].
Recent studies have identified compact structures within TADs [22]. They are spatially separated from the remaining part of the TAD and therefore are called subTADs. The existence of subTADs is in consistent with the fractal model of the genome. The fractal principle, or nesting, is also evident considering small loops that appear within a greater loop [7].
TADs play important roles in many molecular processes [23]. For estimation of consequences of chromosomal rearrangements, one must consider that loops formed within TADs create an environment for specific enhancer–promoter interactions. At the same time, TAD boundaries prevent interactions between regulatory elements and genes lying in different TADs.
If rearrangements result in changes in intra-TAD contacts, it may lead to loss of connection between genes and their regulators lying within a TAD. Moreover, translocation of part of a TAD region that does not contain a TAD boundary or deletion of boundaries between TADs may lead to their fusion. This may induce severe damage, because genetic elements from one TAD are placed under control of regulators from another TAD, resulting in an aberrant expression pattern of affected genes.
Recommendation: For analysis of chromosome aberrations, we may estimate a probability of TAD disruption or changes of intra-TAD contacts by the method that we used for loops – guided by CTCF-binding site distribution according to ChIP-Seq and ChIA-PET data. As in the case of a loop, disruption of a TAD boundary (caused by inversion or deletion of CTCF-binding sites) may lead to alteration of gene regulation within a TAD. In addition, there is a need to consider the fact that translocations of part of a TAD may cause its fusion with another domain and formation of ectopic enhancer–promoter interactions.
EXAMPLES OF CHROMOSOMAL REARRANGEMENTS ENTAILING PATHOLOGICAL
PHENOTYPE DUE TO DISRUPTION OF NUCLEAR SPATIAL ARCHITECTURE
Misregulation of gene expression and consequent development of a disease because of disturbances in 3-dimensional chromatin architecture has been clearly demonstrated in many experimental studies. The group led by Stefan Mundlos investigated large chromosomal rearrangements (ranging from hundreds of kilobytes to megabytes) in several patients with limb deviations (polydactyly, brachydactyly, F-syndrome) [14], sex inversion, or Cooks syndrome [15]. In some cases, genomic rearrangements resulted in abnormal gene dosage; however, some rearrangements do not change gene dosage, but still result in development of pathology. Furthermore, the analysis of the human genome spatial contact maps revealed that all rearrangements disrupt TAD boundaries, and the genes associated with the developing pathology appeared to lie within the altered TADs.
To account for the cause-effect relationships between mutations and the resulting phenotype, the authors designed a similar chromosomal rearrangement in the mouse genome. Analysis of the chromatin architecture of modified animals confirmed the correlation between the chromosome rearrangements and aberrant structure of TADs, leading to the formation of new, abnormal promoter–enhancer interactions, changes in gene expression, and, as a result, the development of pathological phenotype in mutant mice similar to that of patients [14, 15].
Another research group investigated the chromosomal rearrangement t(2;13)(q35;q14) often found in rhabdomyosarcoma [24]. This rearrangement is known to provoke PAX3 and FOXO1 gene fusion, and the resulting protein activates the genes responsible for cell proliferation. A recent study showed that not only the “hybrid” PAX3–FOXO1 gene is formed as a result of translocation, but also the TADs containing these genes unite. Consequently, the hybrid gene PAX3–FOXO1 acquires a unique pattern of expression, which is presumably an important event in the process of malignant cell transformation. It should be noted that the hypothesis is based upon the analysis of spatial contact maps showing disrupted TAD structure and changes in the pattern of gene expression.
Finally, we want to mention recent analysis describing various balanced chromosome rearrangements identified in the amniotic fluid of 10 embryos. Comparing rearrangement positions with the map of spatial contacts, the authors predicted misregulation of gene expression related to changes in TADs spatial organization. Pregnancy outcomes coincided quite well with the authors’ forecast [25].
PRACTICAL GUIDE FOR INTERPRETING CHROMOSOMAL
REARRANGEMENTS
To find various elements of topological structure in a region of chromosomal rearrangement (compartments, TADs, loops), it is necessary to analyze Hi-C data. It is important to note that 3D architecture is conserved across different cell types. For example, coordinates of 65% of the borders of TADs were similar in human embryonic stem cells and fibroblasts [6]. Even such a different cell types as spermatozoa and fibroblasts show a high degree of similarity of three-dimensional genome organizations [26]. Therefore, a rough estimation of the spatial genome organization of the cell type of interest can be done by analyzing Hi-C data obtained on another type of cell or tissue. This is important, since high-resolution Hi-C data are available for only a very small number of human cell types.
On the other hand, it is worth keeping in mind that the spatial genome organization in different cell types can have its own features. For example, if a gene has an enhancer that is active only in neurons, then the loop connecting this enhancer with the gene promoter can appear exclusively on the neuron spatial contacts map and will not exist on maps obtained for other cell types.
Different computational tools have recently been developed to analyze and visualize Hi-C data. However, working with most of this software requires programming skills, so their use will be difficult for most physicians and biologists. Fortunately, two convenient online services allow visualizing 3D contact maps without installing special programs.
HiGlass [27] (http://higlass.io/app/) can visualize the contact map for GM12878, the human lymphoblastoid cell line. These data have been published [7]. Navigation on the map is carried out as in the usual online maps such as Google maps. The user can specify the coordinates of the region of interest (according to the genome version hg19) or zoom into the area of interest with scroll. Note that when you zoom in, the resolution that is depicted in the lower right corner changes. In addition, it is convenient to navigate in the genome relative to genes whose position is displayed on the left and top of the screen. The advantages of the HiGlass service include convenient interface and quick work. Since the spatial contact map is a very large data set, without special optimization, working with it heavily loads even powerful personal computers. Disadvantages of HiGlass: only one human lymphoblastoid cell map is available in the online version; it is not possible to load the available information according to ChIP-Seq, ChIA-PET, RNAseq, etc. However, this information is easy to obtain using a genome browser such as the UCSC Genome Browser (https://genome.ucsc.edu/cgi-bin/hgTracks?db=hg19).
Juicebox [28] (http://aidenlab.org/juicebox/) is a more versatile tool for working with spatial contacts maps that was created and is maintained by one of the leading scientific teams in the field – the laboratory of Erez Aiden. Unlike the online version of HiGlass, in Juicebox you can choose to operate one of the many available Hi-C datasets. In addition, the list of available maps is updated when new data is published. Unfortunately, when choosing a map from the list by the name of the map, it is not always clear from what cells or tissues it was obtained. The choice of the necessary map is also complicated by the fact that in the list there are maps not only for human cells, but also for various animals and even plants.
When using Juicebox, we recommend loading the following available maps of human cells in high resolution:
– 4DN Dekker Lab H1 hESC combined – map for human embryonic stem cells H1 [5];
– Phanstiel and Van Bartle et al. | Bioarxiv 2017 – PMA THP-1 Monocytes (3.9B) – for human monocytes;
– Phanstiel and Van Bartle et al. | Bioarxiv 2017 + PMA THP-1 Macrophages (3.7B) – for human macrophages [29];
– Rao and Huntley et al. | Cell 2014 GM12878 (human) in situ MboI primary + replicate (4.9B) – for lymphoblastoid cell line GM12878 [7].
The GM12878 map is the only one available in the HiGlass service. A big advantage of Juicebox is the ability to display not only basic genomic annotations, such as the position of genes, but also data obtained by the ENCODE consortium, including ChIP-seq, CTCF simultaneously with the contact map. In addition, it is possible to install a desktop version of the program with an extended function to the personal computer. The disadvantage of Juicebox is that it requires substantial PC resources.
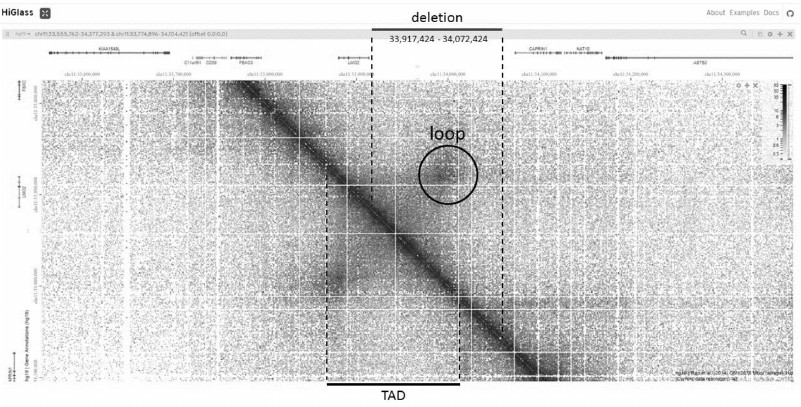
Let us try to use the available information about the spatial genome organization for the analysis of one of the somatic mutations found in a large-scale study of patients with acute lymphoblastic leukemia [30]. The mutation is a deletion of 155,000 bp in the intergenic region of chromosome 11 (33,917,424-34,072,424) and does not affect the coding parts of known genes (Fig. 2). If you zoom into the area surrounding the deletion in HiGlass, you can find that the deletion overlaps with a pronounced TAD bounded by the loop. There is a single gene in this TAD, the LMO2 gene. It is known that LMO2 is a protooncogene, so it can be assumed that a deletion removing one of the bases of the loop leads to a change in the correct folding of chromatin in this region, which in turn leads to a change in the expression of the protooncogene and causes the disease [31].
Fig. 2. LMO2 gene region on HiGlass contact map. Deletion borders are from [30], TAD including LMO2 and a peak of the loop forming this TAD are highlighted.
Finally, we would like to review the 3Diseases browser (http://3dgb.cbi.pku.edu.cn/disease/) [32]. This software was developed in the frame of analysis of more than 154,000 chromosomal rearrangements available in the ClinVar database. The authors draw a connection between genomic positions of rearrangements and TADs generating a list of rearrangements that potentially disrupt gene regulation due to changes in genome architecture. Using the 3Diseases browser web-application, one can find chromosomal rearrangement and associated pathology by a gene symbol. It is important to note that this tool used data obtained on several different human cell types.
CORRELATION BETWEEN LOCALIZATION OF CHROMOSOMAL REARRANGEMENTS
AND 3-DIMENSIONAL GENOME ARCHITECTURE
Spatial chromatin folding needs to be considered not only for explanation of the results of chromosomal aberrations, but to understand causes of their occurrence, because a spatial proximity contributes to partner selection in translocations [33, 34].
In most cases, translocations are related to reparation of two double-strand breaks (DSBs) of DNA. Causes of chromatin breakage may be universal: ionizing radiation, oxidative stress, replication across a nick, pathologic action of nuclear enzymes and mechanical pressure; but may also be cell-type specific: off-target activity of activation-induced cytidine deaminase (AID) and proteins of recombination-activating genes (RAGs) complex in lymphoid cells [35] and meiotic recombination in the germ line.
Further physical juxtaposition of two DSBs is necessary for their reparation. We do not consider homologous recombination, because it rarely leads to translocations and does not correlate with spatial proximity. There are two models describing nonhomologous end-joining reparation. The “contact first” model supposes that spatial proximity of loci determines partner selection and precedes breakage. The alternative model “breakage first” proposes that a free end of a chromosome starts directed migration in search of a translocation partner, and they juxtapose after DSB occurrence [36, 37]. It is necessary to mention that both models may take a place, but we apply the “contact first” model as more general. According to this model, spatial distance between genomic loci must play an important role in determination of frequency of translocations.
Direct experimental evidence that spatial proximity has an impact on translocation partner selection was reported [34]. The researchers obtained B-cell lines capable of inducible G1-phase cell cycle arrest and single integrations of the meganuclease restriction site. These cells were arrested in G1-phase for the prevention of homologous reparation and apoptosis and treated with gamma-irradiation to induce DSB, and at the same time, the expression of meganuclease was induced. This lead to frequent translocations of a region near the meganuclease site to random genomic loci, and the authors applied high throughput genome wide translocation sequencing to identify frequencies of different translocations. These data were compared with contact frequencies obtained by Hi-C analysis. The comparison revealed that translocation frequencies strictly correlate with Hi-C contacts of loci, especially in the case of cis-translocations. Although these results indicate that translocations are guided by spatial genome architecture, the same study provided evidence of frequent translocations between regions of genome where frequency of DSB is high, even if corresponding loci are located far from each other according to the Hi-C data. To explain this observation, the authors highlight heterogeneity of spatial contacts of cells, meaning that in some cells these loci can be close in space, even if population-averaged number of contacts between them is low [34].
An interesting and atypical example of how spatial position of a locus influences translocation partner selection is a reciprocal translocation between regions on chromosomes 8 and 14 in human B-cells that leads to fusion of IGH (immunoglobulin heavy chain) promoter to the MYC oncogene. The result of this translocation is development of Burkitt lymphoma. HIV-1 infected individuals have a significant predisposition to this type of cancer [38]. For a long time, the mechanisms of this phenomenon remained unclear, the most intriguing in this story was the way in which HIV, not infecting B-cells, causes predisposition to the specific chromosomal rearrangement in them.
It was known that when resting B-lymphocytes receive a proliferation-activating signal, they start expressing MYC. In this case, the MYC locus moves preferentially to the transcription factory where the IGH locus is [39]. In this way, if a DSB will be created in the MYC locus, translocation between MYC and IGH may occur with high probability. It should be noted that MYC is not active in circulating lymphocytes and DSB do not occur in the MYC locus in the absence of HIV infection.
Creation of DSBs in the MYC loci in HIV-infected individuals is mediated by Tat protein. That protein is encoded by HIV and regulates the life cycle of the virus, but it also changes the expression of the host genes. It accumulates in the nuclei but also can be found in significant concentrations in blood plasma [40]. Circulating B-cells are able to internalize Tat. There it causes RAG1 ectopic expression that recognizes recombination signal sequence (RSS) and creates DSBs. Unfortunately, RSS is present in the MYC region. After DSB creation and binding of DNA reparation complexes, MYC relocates directly to the IGH loci by an unknown means. Colocalization of IGH and MYC increases frequency of their translocation [38]. At least for now there is no evidence of a special molecular mechanism taking part in recombination of those loci.
Finally, another important report should be mentioned. In that work, a massive database of known human translocations that cause cancer and genetic diseases was compiled [33]. It reveals that the loci partners of these translocations have a significantly higher Hi-C contacts score than randomly selected pairs of loci with the same size, and the most frequent translocations have a higher frequency of contacts than others. The most interesting achievement of this research is that it shows that the loci of cell-type-specific cancer translocations have a higher frequency of Hi-C contacts in this cell type than translocations specific for other types. This means that tissue-specific features of the chromatin architecture explain why different types of cells have predispositions for different chromosomal rearrangements [5, 41].
Whereas spatial genome architecture clearly influences translocation partner selection, many other factors influence translocation frequency: fragile loci of the genome, dynamics of DSBs, epigenetic chromatin states, and positive selection may increase frequency of translocation that should be rare if only spatial architecture of the genome is taken into account [33].
The spatial architecture of chromatin plays an important role in regulation of human genomic events. For understanding of way chromosomal rearrangements influence phenotype, it is necessary to find answers for three questions: (1) How will rearrangement change the spatial chromatin architecture? (2) How will these changes affect gene expression? (3) What kind of phenotypical aftermath will be caused by changes of gene expression in the whole organism?
Answering each of these questions is challenging and requires new studies of molecular mechanisms, compiling large databases, developing of models, and their experimental verification. Right now, many scientific groups are focused on these questions [42, 43], including our laboratory. Unfortunately, we are still far from being able to accurately predict the phenotype that will be generated by a chromosomal rearrangement. However, for particular cases, medical genetics can be guided by simple recommendations and the user-friendly services that were described in this report for conjecture about the fact that aberration affects development of pathology in the patient.
Acknowledgments
This work was supported by the Russian Science Foundation (project No. 17-74-10143).
REFERENCES
1.Richmond, T. J., and Davey, C. A. (2003) The
structure of DNA in the nucleosome core, Nature, 423,
145-150.
2.Mirny, L. A. (2011) The fractal globule as a model
of chromatin architecture in the cell, Chromosome Res.,
19, 37-51.
3.Merkenschlager, M., and Nora, E. P. (2016) CTCF and
cohesin in genome folding and transcriptional gene regulation, Annu.
Rev. Genom. Human Genet., 17, 17-43.
4.Bannister, A. J., and Kouzarides, T. (2011)
Regulation of chromatin by histone modifications, Cell Res.,
21, 381-395.
5.Dixon, J. R., Jung, I., Selvaraj, S., Shen, Y.,
Antosiewicz-Bourget, J. E., Lee, A. Y., Ye, Z., Kim, A., Rajagopal, N.,
Xie, W., Diao, Y., Liang, J., Zhao, H., Lobanenkov, V. V., Ecker, J.
R., Thomson, J. A., and Ren, B. (2015) Chromatin architecture
reorganization during stem cell differentiation, Nature,
518, 331-336.
6.Dixon, J. R., Selvaraj, S., Yue, F., Kim, A., Li,
Y., Shen, Y., Hu, M., Liu, J. S., and Ren, B. (2012) Topological
domains in mammalian genomes identified by analysis of chromatin
interactions, Nature, 485, 376-380.
7.Rao, S. S. P., Huntley, M. H., Durand, N. C.,
Stamenova, E. K., Bochkov, I. D., Robinson, J. T., Sanborn, A. L.,
Machol, I., Omer, A. D., Lander, E. S., and Aiden, E. L. (2014) A 3D
map of the human genome at kilobase resolution reveals principles of
chromatin looping, Cell, 159, 1665-1680.
8.Cremer, C., and Cremer, T. (2001) Chromosome
territories, nuclear architecture and gene regulation in mammalian
cells, Nat. Rev. Genet., 2, 292-301.
9.Dekker, J., Rippe, K., Dekker, M., and Kleckner, N.
(2002) Capturing chromosome conformation, Science, 295,
1306-1311.
10.De Wit, E., and De Laat, W. (2012) A decade of 3C
technologies-insights into nuclear organization, Genes Dev.,
26, 11-24.
11.Lieberman-Aiden, E., Van Berkum, N. L., Williams,
L., Imakaev, M., Ragoczy, T., Telling, A., Amit, I., Lajoie, B. R.,
Sabo, P. J., Dorschner, M. O., Sandstrom, R., Bernstein, B., Bender, M.
A., Groudine, M., Gnirke, A., Stamatoyannopoulos, J., Mirny, L. A.,
Lander, E. S., and Dekker, J. (2009) Comprehensive mapping of
long-range interactions reveals folding principles of the human genome,
Science, 326, 289-293.
12.Imakaev, M., Fudenberg, G., McCord, R. P.,
Naumova, N., Goloborodko, A., Lajoie, B. R., Dekker, J., and Mirny, L.
A. (2012) Iterative correction of Hi-C data reveals hallmarks of
chromosome organization, Nat. Methods, 9, 999-1003.
13.Talbert, P. B., and Henikoff, S. (2006) Spreading
of silent chromatin: inaction at a distance, Nat. Rev. Genet.,
7, 793-803.
14.Lupianez, D. G., Kraft, K., Heinrich, V.,
Krawitz, P., Brancati, F., Klopocki, E., Horn, D., Kayserili, H.,
Opitz, J. M., Laxova, R., Santos-Simarro, F., Gilbert-Dussardier, B.,
Wittler, L., Borschiwer, M., Haas, S. A., Osterwalder, M., Franke, M.,
Timmermann, B., Hecht, J., Spielmann, M., Visel, A., and Mundlos, S.
(2015) Disruptions of topological chromatin domains cause pathogenic
rewiring of gene–enhancer interactions, Cell, 161,
1-14.
15.Franke, M., Ibrahim, D. M., Andrey, G.,
Schwarzer, W., Heinrich, V., Schopflin, R., Kraft, K., Kempfer, R.,
Jerkovic, I., Chan, W.-L., Spielmann, M., Timmermann, B., Wittler, L.,
Kurth, I., Cambiaso, P., Zuffardi, O., Houge, G., Lambie, L., Brancati,
F., Pombo, A., Vingron, M., Spitz, F., and Mundlos, S. (2016) Formation
of new chromatin domains determines pathogenicity of genomic
duplications, Nature, 538, 265-269.
16.Dekker, J., and Heard, E. (2015) Structural and
functional diversity of topologically associating domains, FEBS
Lett., 589, 2877-2884.
17.Valton, A. L., and Dekker, J. (2016) TAD
disruption as oncogenic driver, Curr. Opin. Genet. Dev.,
36, 34-40.
18.Holwerda, S., and De Laat, W. (2012) Chromatin
loops, gene positioning, and gene expression, Front. Genet.,
3.
19.Tang, Z., Luo, O. J., Li, X., Zheng, M., Zhu, J.
J., Szalaj, P., Trzaskoma, P., Magalska, A., Wlodarczyk, J.,
Ruszczycki, B., Michalski, P., Piecuch, E., Wang, P., Wang, D., Tian,
S. Z., Penrad-Mobayed, M., Sachs, L. M., Ruan, X., Wei, C. L., Liu, E.
T., Wilczynski, G. M., Plewczynski, D., Li, G., and Ruan, Y. (2015)
CTCF-mediated human 3D genome architecture reveals chromatin topology
for transcription, Cell, 163, 1611-1627.
20.Flyamer, I. M., Gassler, J., Imakaev, M.,
Brandao, H. B., Ulianov, S. V., Abdennur, N., Razin, S. V., Mirny, L.
A., and Tachibana-Konwalski, K. (2017) Single-nucleus Hi-C reveals
unique chromatin reorganization at oocyte-to-zygote transition,
Nature, 544, 110-114.
21.Ulianov, S. V., Khrameeva, E. E., Gavrilov, A.
A., Flyamer, I. M., Kos, P., Mikhaleva, E. A., Penin, A. A., Logacheva,
M. D., Imakaev, M. V., Chertovich, A., Gelfand, M. S., Shevelyov, Y.
Y., and Razin, S. V. (2016) Active chromatin and transcription play a
key role in chromosome partitioning into topologically associating
domains, Genome Res., 26, 70-84.
22.Weinreb, C., and Raphael, B. J. (2016)
Identification of hierarchical chromatin domains,
Bioinformatics, 32, 1601-1609.
23.Denker, A., and de Laat, W. (2016) The second
decade of 3C technologies: detailed insights into nuclear organization,
Genes Dev., 30, 1357-1382.
24.Vicente-Garcia, C., Villarejo-Balcells, B.,
Irastorza-Azcarate, I., Naranjo, S., Acemel, R. D., Tena, J. J., Rigby,
P. W. J., Devos, D. P., Gomez-Skarmeta, J. L., and Carvajal, J. J.
(2017) Regulatory landscape fusion in rhabdomyosarcoma through
interactions between the PAX3 promoter and FOXO1 regulatory elements,
Genome Biol., 18, 106.
25.Ordulu, Z., Kammin, T., Brand, H., Pillalamarri,
V., Redin, C. E., Collins, R. L., Blumenthal, I., Hanscom, C., Pereira,
S., Crandall, B. F., Gerrol, P., Hayden, M. A., Hussain, N.,
Kanengisser-Pines, B., Kantarci, S., Levy, B., Macera, M. J.,
Quintero-Rivera, F., Spiegel, E., Stevens, B., Ulm, J. E., Warburton,
D., Wilkins-Haug, L. E., Yachelevich, N., Gusella, J. F., Talkowski, M.
E., and Morton, C. C. (2016) Structural chromosomal rearrangements
require nucleotide-level resolution: lessons from next-generation
sequencing in prenatal diagnosis, Am. J. Hum. Genet., 99,
1-19.
26.Battulin, N., Fishman, V. S., Mazur, A. M.,
Pomaznoy, M., Khabarova, A. A., Afonnikov, D. A., Prokhortchouk, E. B.,
and Serov, O. L. (2015) Comparison of the 3D organization of sperm and
fibroblast genomes using the Hi-C approach, Genome Biol.,
16, 77.
27.Kerpedjiev, P., Abdennur, N., Lekschas, F.,
McCallum, C., Dinkla, K., Strobelt, H., Luber, J. M., Ouellette, S. B.,
Ahzir, A., Kumar, N., Hwang, J., Alver, B. H., Pfister, H., Mirny, L.
A., Park, P. J., and Gehlenborg, N. (2017) HiGlass: web-based visual
comparison and exploration of genome interaction maps, bioRxiv,
1-7.
28.Durand, N. C., Robinson, J. T., Shamim, M. S.,
Machol, I., Mesirov, J. P., Lander, E. S., and Aiden, E. L. (2016)
Juicebox provides a visualization system for Hi-C contact maps with
unlimited zoom, Cell Systems, 3, 99-101.
29.Phanstiel, D. H., Van Bortle, K., Spacek, D.,
Hess, G. T., Shamim, M. S., Machol, I., Love, M. I., Aiden, E. L.,
Bassik, M. C., and Snyder, M. P. (2017) Static and dynamic DNA loops
form AP-1-bound activation hubs during macrophage development, Mol.
Cell, 67, 1037-1048.
30.Mullighan, C. G., Goorha, S., Radtke, I., Miller,
C. B., Coustan-Smith, E., Dalton, J. D., Girtman, K., Mathew, S., Ma,
J., Pounds, S. B., Su, X., Pui, C.-H., Relling, M. V., Evans, W. E.,
Shurtleff, S. A., and Downing, J. R. (2007) Genome-wide analysis of
genetic alterations in acute lymphoblastic leukaemia, Nature,
446, 758-764.
31.Hnisz, D., Weintraub, A. S., Day, D. S., Valton,
A., Bak, R. O., Li, C. H., Goldmann, J., Lajoie, B. R., Fan, Z. P.,
Sigova, A., Reddy, J., Borges-Rivera, D., Lee, T. I., Jaenisch, R.,
Porteus, M. H., Dekker, J., and Young, R. (2016) Activation of
proto-oncogenes by disruption of chromosome neighborhoods,
Science, 351, 1454-1458.
32.Li, R., Liu, Y., Li, T., and Li, C. (2016)
3Disease browser: a web server for integrating 3D genome and
disease-associated chromosome rearrangement data, Sci. Rep.,
6, 34651.
33.Engreitz, J. M., Agarwala, V., and Mirny, L. A.
(2012) Three-dimensional genome architecture influences partner
selection for chromosomal translocations in human disease, PLoS
One, 7, e44196.
34.Zhang, Y., McCord, R. P., Ho, Y.-J., Lajoie, B.
R., Hildebrand, D. G., Simon, A. C., Becker, M. S., Alt, F. W., and
Dekker, J. (2012) Chromosomal translocations are guided by the spatial
organization of the genome, Cell, 148, 908-921.
35.Lieber, M. R. (2016) Mechanisms of human lymphoid
chromosomal translocations, Nat. Rev. Cancer, 16,
387-398.
36.Aten, J. A., Stap, J., Krawczyk, P. M., Van Oven,
C. H., Hoebe, R. A., Essers, J., and Kanaar, R. (2004) Dynamics of DNA
double-strand breaks revealed by clustering of damaged chromosome
domains, Science, 303, 92-95.
37.Iarovaia, O. V., Rubtsov, M. A., Ioudinkova, E.,
Tsfasman, T., Razin, S. V., and Vassetzky, Y. S. (2014) Dynamics of
double strand breaks and chromosomal translocations, Mol.
Cancer, 13, 249.
38.Grogg, K. L., Miller, R. F., and Dogan, A. (2006)
HIV infection and lymphoma, J. Clin. Pathol., 60,
1365-1372.
39.Osborne, C. S., Chakalova, L., Mitchell, J. A.,
Horton, A., Wood, A. L., Bolland, D. J., Corcoran, A. E., and Fraser,
P. (2007) Myc dynamically and preferentially relocates to a
transcription factory occupied by Igh, PLoS Biol., 5,
1763-1772.
40.Musinova, Y. R., Sheval, E. V., Dib, C., Germini,
D., and Vassetzky, Y. S. (2016) Functional roles of HIV-1 Tat protein
in the nucleus, Cell. Mol. Life Sci., 73, 589-601.
41.Parada, L. A., McQueen, P. G., and Misteli, T.
(2004) Tissue-specific spatial organization of genomes, Genome
Biol., 5, R44.
42.Whalen, S., Truty, R. M., and Pollard, K. S.
(2016) Enhancer–promoter interactions are encoded by complex
genomic signatures on looping chromatin, Nat. Genet., 48,
488-496.
43.Di Pierro, M., Cheng, R. R., Lieberman Aiden, E.,
Wolynes, P. G., and Onuchic, J. N. (2017) De novo
prediction of human chromosome structures: epigenetic marking patterns
encode genome architecture, Proc. Natl. Acad Sci. USA,
114, 12126-12131.