Interleukin-4 Restores Insulin Sensitivity in Lipid-Induced Insulin-Resistant Adipocytes
I. S. Stafeev1,2,a*, S. S. Michurina1,3, N. V. Podkuychenko1,3, A. V. Vorotnikov1,4,b*, M. Yu. Menshikov1, and Ye. V. Parfyonova1,2
1Institute of Experimental Cardiology, National Medical Research Center for Cardiology, 121552 Moscow, Russia2Lomonosov Moscow State University, Faculty of Basic Medicine, 117192 Moscow, Russia
3Lomonosov Moscow State University, Faculty of Biology, 119991 Moscow, Russia
4Lomonosov Moscow State University Medical Center, 119991 Moscow, Russia
* To whom correspondence should be addressed.
Received August 29, 2017; Revision received October 26, 2017
Obesity and latent inflammation in adipose tissue significantly contribute to the development of insulin resistance (IR) and type 2 diabetes. Here we studied whether the antiinflammatory interleukin-4 (IL-4) can restore insulin sensitivity in cultured 3T3-L1 adipocytes. The activity of key components of the insulin signaling cascade was assessed by immunoblotting using phospho-specific antibodies to insulin receptor substrate IRS1 (Tyr612), Akt (Thr308 and Ser473), and AS160 (Ser318) protein that regulates translocation of the GLUT4 glucose transporter to the plasma membrane. IR was induced in mature adipocytes with albumin-conjugated palmitate. IR significantly reduced phosphorylation levels of all the above-mentioned proteins. Addition of IL-4 to the culturing medium during IR induction led to a dose-dependent stimulation of the insulin-promoted phosphorylation of IRS1, Akt, and AS160. At the optimal concentration of 50 ng/ml, IL-4 fully restored activation of the insulin cascade in IR cells, but it did not affect insulin signaling activation in the control cells. IL-4 neither upregulated expression of key adipogenesis markers GLUT4 and PPARγ nor caused lipid accumulation in the adipocytes. These results demonstrate that IL-4 can restore insulin sensitivity in adipocytes via mechanisms not associated with induced adipogenesis or de novo formation of lipid depots.
KEY WORDS: insulin resistance, interleukin-4, inflammationDOI: 10.1134/S0006297918050036
Abbreviations: Akt, protein kinase B; AS160, Akt substrate of 160 kDa; FBS, fetal bovine serum; GLUT4, type 4 glucose transporter; IKK, IκB kinase; IL-4, interleukin-4; IR, insulin resistance; IRS1, type 1 insulin receptor substrate; PA–BSA, palmitic acid (PA) conjugate with bovine serum albumin (BSA); PCR, polymerase chain reaction; PDK1, phosphoinositide-dependent protein kinase-1; PPARγ, peroxisome proliferator-activated receptor γ; TLR, Toll-like receptor.
Obesity and type 2 diabetes contribute to disability and mortality in
the contemporary society. Obesity provokes latent inflammation in
adipose tissue resulting in adipocyte hypertrophy and development of
hypoxia [1]. It also activates the oxidative and
endoplasmic reticulum stresses in cells in response to overnutrition
[2, 3]. These indirect effects
and direct stimulation of the Toll-like receptor 4 (TLR4) and
TLR-dependent inflammatory signaling by free fatty acids in adipocytes
result in activation of proinflammatory cytokine expression that
maintain latent inflammation via autocrine signaling in adipose tissue
[4-6].
Inflammation contributes to insulin resistance (IR) development [7], including IR in adipose tissue [8]. Association between IR and inflammation has been confirmed in many clinical and experimental studies. The major strategy of the antiinflammatory therapy widely used in clinical practice is to suppress proinflammatory signaling using antagonists of proinflammatory cytokine receptors (anakinra, etanercept, etc.) or nonspecific antiinflammatory drugs (salicylates). An alternative approach is being developed since 2010 and is much less studied [9, 10]. It involves excitation of antiinflammatory signaling, for example, by natural antiinflammatory receptor agonists such as antiinflammatory cytokines IL-4, IL-13, etc. Here, we investigated the possibility to restore insulin signaling by the antiinflammatory cytokine IL-4 in experimental IR model of 3T3-L1 adipocytes.
The insulin receptor is a classical tyrosine kinase receptor involved in several intracellular signaling cascades [8]. Its unique feature is the use of insulin receptor substrate (IRS) protein and its major IRS1 isoform as the immediate target. Tyrosine phosphorylation of IRS1 by insulin receptor initiates different signaling pathways, including a major insulin-dependent cascade that was the subject in our study. The tyrosine phosphorylated IRS1 (including Tyr612) transmits the signal to PI3 kinase, which generates phosphatidylinositol 3,4,5-triphosphate (PIP3) to activate phosphoinositide-dependent kinase (PDK1), resulting in PDK1-dependent phosphorylation of protein kinase B (Akt) on Thr308 that is required for Akt activation [8]. Complete activation of Akt also requires PI3 kinase dependent phosphorylation on Ser473. Among other substrates, Akt phosphorylates the Akt substrate of 160 kDa (AS160 protein), which regulates translocation of the insulin-dependent glucose transporter GLUT4 to the plasma membrane. This provides mechanism by which insulin activates glucose uptake from the blood into adipocytes and myocytes, which express GLUT4.
IR is characterized by impaired insulin stimulation of tyrosine phosphorylation of IRS1 and insulin signaling. It is believed to develop in response to IRS phosphorylation on serine residues that disturbs tyrosine phosphorylation of IRS. Various factors, including inflammatory pathway as the major of them, trigger serine phosphorylation of IRS [5-8]. This leads to decreased insulin-induced phosphorylation of AS160 and translocation of GLUT4 to the plasma membrane, impaired glucose uptake and development of hyperglycemia and type 2 diabetes. Thus, antiinflammatory therapy has a potential in prevention of type 2 diabetes.
IL-4 is a pleotropic cytokine produced mostly by activated T lymphocytes and, to a lesser extent, by macrophages and eosinophils. Acting in autocrine manner to activate the STAT6 transcription factor, IL-4 induces antiinflammatory phenotype in macrophages and T lymphocytes [11]. This antiinflammatory immune shift may counteract latent inflammation and IR development in adipose tissue. We hypothesized that IL-4 may have potential for IR therapy in adipose tissue.
MATERIALS AND METHODS
Study design. All experiments were performed in cultured mouse 3T3-L1 adipocytes with the fibroblast-like morphology. The cells were subjected to adipogenic differentiation for 10 days. The extent of differentiation was assayed on day 10 by staining the cells with the lipophilic dye Oil Red O. IR was induced in the differentiated adipocytes with palmitic acid in the absence or presence of different IL-4 concentration (25, 50, and 100 ng/ml); the cells were incubated with IL-4 for 24 h.
To estimate insulin sensitivity, the cells were incubated with 100 nM insulin for 20 min. Immunoblotting was used to assess activation of insulin cascade as an insulin-dependent increase in phosphorylation of the major components of insulin cascade, such as IRS1, Akt, and AS160. After optimal concentration of IL-4 was established, its effects on adipogenic differentiation of 3T3-L1 preadipocytes were studied. The cells were differentiated by standard protocol in the presence or absence of the optimal IL-4 concentration. Accumulation of neutral lipids and expression of adipogenic markers were then compared in these cells.
Reagents. 3T3-L1 cells (ATCC, USA) were cultured in DMEM with high glucose (4.5 g/liter; PanEko, Russia) supplemented with fetal bovine serum (FBS; Gibco, USA), 2 mM L-glutamine, and 60 U/ml penicillin/streptomycin (Gibco). For adipogenic differentiation, 3T3-L1 preadipocytes were precultured with newborn calf serum (NBCS; Gibco) and differentiated in the presence of insulin, isobutylmethylxanthine, dexamethasone, and rosiglitazone (Sigma, USA). The extent of differentiation was estimated by staining the cells with the lipophilic dye Oil Red O (Merck Millipore, USA).
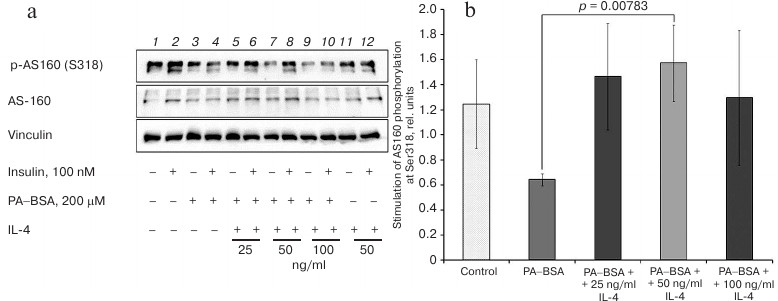
qPCR was performed using a StepOnePlus cycler (Applied Biosystems, USA) and SYBRGreen dye (Syntol, Russia). Total RNA was isolated from adipocytes with an RNeasy Mini Kit (Qiagen, USA). cDNA was synthesized with a RevertAid H Minus First Strand cDNA Kit (Thermo Fisher Scientific, USA). Primers (Evrogen, Russia) used for amplification are shown in the table.
Primers for qPCR
Immunoblotting was performed using primary antibodies against IRS1 phospho-Tyr612 (#44816; Thermo Fisher Scientific); IRS1 (#3407), Akt phospho-Thr308 (#9275), Akt phospho-Ser473 (#4060), AS160 phospho-Ser318 (#8619), and AS160 (#2670), all from Cell Signaling (USA); Akt (ab64148) and horseradish peroxidase-conjugated secondary antibody against rabbit Ig (ab6721) (Abcam, UK).
Culturing and differentiation of 3T3-L1 preadipocytes. 3T3-L1 preadipocytes were cultured in DMEM supplemented with 4.5 g/liter glucose, 10% FBS, 2 mM L-glutamine, and penicillin/streptomycin (60 U/ml).
Adipogenic differentiation was performed according to Zebisch et al. [12]. Briefly, 3T3-L1 preadipocytes were cultured to ~90% confluency in DMEM as above; the medium was then replaced with DMEM containing 10% NBCS instead of FBS (days 0-2 of differentiation). On day 3, the medium was replaced with DMEM supplemented with 10% FBS, 0.5 mM dexamethasone, 0.25 μM isobutylmethylxanthine, 2 μM rosiglitazone, and 1 μg/ml insulin. The cells were cultured for another 2 days (days 5-7 of differentiation) and then transferred to the initial DMEM medium. On day 10, the cells were used for experiments or fixed with 4% formaldehyde for 1 h and stained with Oil Red O.
Lipid-induced IR model. Palmitic acid (PA) conjugated with bovine serum albumin (BSA) was used as a classic inducer of IR in the high-fat diet model. Conjugation with BSA increases the solubility of PA and its absorption by the cells. PA–BSA conjugate was prepared as described in [13] by adding 0.2 M PA solution in 96% ethanol to 20% BSA solution in the Krebs–Ringer buffer (120 mM NaCl, 5 mM KCl, 1.1 mM MgCl2·6 H2O, 25 mM NaHCO3, pH 7.4) at a 1 : 25 ratio. The mixture was carefully stirred for 1 h; the pH of the reaction mixture was maintained at 7.4.
Mature 3T3-L1 adipocytes were incubated for 24 h in FBS-free DMEM (1 g/liter glucose, 2 mM L-glutamine, 60 U/ml penicillin/streptomycin) containing 0.1% BSA. PA–BSA was then added to final concentration of 300 μM PA. The cells were cultured for 24 h in the same medium and then stimulated with 100 nM insulin for 20 min. The medium was aspirated; the cells were washed three times with an ice-cold PBS and lysed on ice in RadioImmuno Precipitation Assay (RIPA) buffer (150 mM NaCl, 1% Triton X-100, 0.5% sodium deoxycholate, 0.1% SDS, 50 mM Tris-HCl, pH 8.0) containing protease inhibitor cocktail (cOmplete Tablets EASYpack; Roche, Switzerland) and phosphatase inhibitors (10 mM sodium glycerophosphate, 20 mM sodium pyrophosphate, 10 mM sodium fluoride, and 1 mM sodium orthovanadate). The lysates were centrifuged for 10 min at 16,000g, and supernatants were carefully collected by separating them from the pellets and floating lipids.
Immunoblotting. Cell lysates were separated by Laemmli SDS-PAGE [14] and proteins were electrotransferred onto polyvinylidene fluoride (PVDF) membranes at 1 A/h. The membranes were blocked for at least 2 h in 5% fat-free milk in Tris-buffered saline (TBS) containing 0.1% Tween 20 (TBST) and incubated in TBST containing 1% fat-free milk with primary and secondary antibodies in dilutions recommended by vendor. The protein bands were visualized using the Clarity ECL reagent kit (BioRad, USA) and Fusion FX gel-documenting system (Vilber Lourmat, France) in the accumulating regime. Quantitation was performed with the GelAnalyzer2010 program. The results are presented as histograms with the stimulation of phosphorylation at the activating residue parameter that corresponds to the increase in protein phosphorylation at given residue in response to insulin stimulation. For this, relative levels of protein phosphorylation (phosphorylated/total protein) before and after cell stimulation with insulin were determined. Each of the obtained values was normalized to the load control (usually, vinculin); the ratios were then calculated between the values obtained for stimulated and control cells.
RT-qPCR. Total RNA was isolated from differentiated 3T3-L1 adipocytes using an RNeasy Mini kit (Qiagen). RNA concentration and purity were determined using Nanodrop 2000 micro spectrometer (Thermo Fisher Scientific). The isolated total RNA and the RevertAid H Minus First Strand cDNA kit (Thermo Fisher Scientific) were used to synthesize cDNA. Each reaction mixture contained 1 μg of total RNA, so that the amount of synthesized cDNA in the reaction tubes was considered to be the same.
Neutral lipid staining with Oil Red O. To visualize the mature adipocytes, 3T3-L1 cells were stained with the lipophilic dye Oil Red O on day 10 of differentiation. The cells were fixed for 30 min in 4% formaldehyde and then washed 3 times with PBS, stained for 50 min with the dye, and washed two times with deionized water. After aspiration of the dye, the cells were examined under an Axiovert 200 light microscope (Carl Zeiss, Germany). Oil Red O was extracted from the cells with isopropanol, and the optical density of the extracts was determined at 600 nm using Eppendorf BioPhotometer (Eppendorf, Germany).
Statistical analysis. Statistical data treatment was performed using MS Excel 2007. The results are shown as the mean ± standard deviation. The significance of differences between the groups was estimated using the two-tailed t-test with different sample dispersion; the differences were considered significant at p < 0.05.
RESULTS
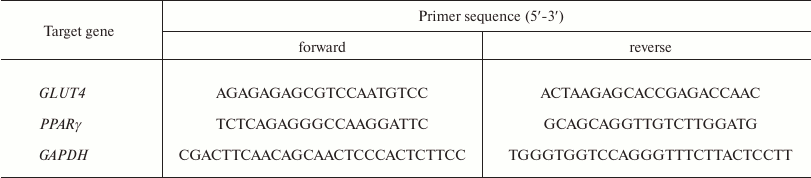
IL-4 restores activating phosphorylation of IRS1 in cells with lipid-induced IR. First, we studied how IL-4 affects the initial step of insulin signaling in standard model of lipid-induced IR. IR was induced by treating mature 3T3-L1 adipocytes with PA–BSA conjugate. To estimate the extent of IR, insulin-stimulated phosphorylation of IRS1 on Tyr612 was monitored by immunoblotting. Figure 1 shows that in the untreated cells, insulin increased Tyr612 phosphorylation ~3-fold. In PA–BSA-treated cells, insulin did not affect Tyr612 phosphorylation (p = 0.02 as compared to the untreated control cells). These results indicate that PA–BSA efficiently induced IR in 3T3-L1 adipocytes.
Fig. 1. IL-4 stimulates insulin-dependent IRS1 phosphorylation at Tyr612 in 3T3-L1 adipocytes with experimental lipid-induced IR: a) immunoblotting; b) statistics of insulin-stimulated phosphorylation of IRS1 (n = 3). IR was induced with PA–BSA for 24 h in the presence or absence of the indicated IL-4 concentrations in the culturing medium as described in “Materials and Methods”.
Activation of inflammatory response is an important mechanism of IR development caused by lipid overload. We studied the possibility to restore insulin cascade activation with the antiinflammatory cytokine IL-4 under the IR conditions. While IL-4 did not exert any significant effect at 25 ng/ml (p = 0.3); 50 ng/ml of IL-4 restored insulin-induced phosphorylation of Tyr612 in IRS1 (p = 0.014) (Fig. 1, a and b). Further increase in IL-4 concentration up to 100 ng/ml in the culturing medium produced an opposite effect by attenuating the insulin-induced stimulation of Tyr612 phosphorylation (Fig. 1b). Although the underlying mechanism remains unclear, our results indicate that IL-4 at concentration of 50 ng/ml efficiently restored the ability of insulin to stimulate IRS1 phosphorylation in resistant 3T3-L1 adipocytes.
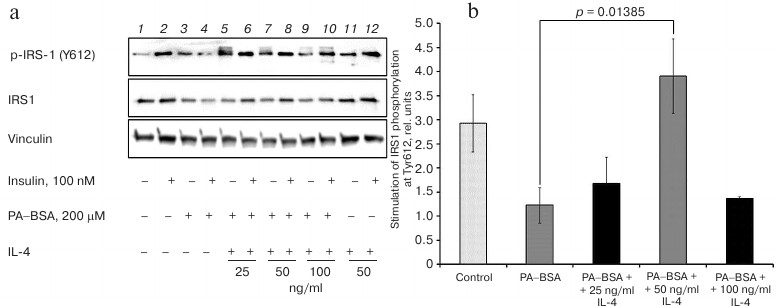
IL-4 restores Akt phosphorylation in cells with lipid-induced IR. To investigate how IL-4 affects intermediate steps of insulin signaling, we explored phosphorylation of two Akt activating sites. Insulin stimulated phosphorylation of Thr308, that is essential for Akt activation, by ~6-fold in normal adipocytes, whereas this stimulation was only 4-fold in resistant adipocytes (p < 0.001) (Fig. 2, a and b). Similarly, treatment with insulin resulted in 8-9-fold increase in Akt phosphorylation on Ser473 in control cells, while it was only 2-fold in cells with IR (p < 0.001) (Fig. 2, c and d). Taken together, these results demonstrate that the ability of insulin to stimulate PI3 kinase and phosphorylation of Akt is considerably decreased in IR.
Fig. 2. IL-4 restores insulin-dependent phosphorylation of Akt at Thr308 (a, b) and Ser473 (c, d) in 3T3-L1 adipocytes with experimental lipid-induced IR: a, c) immunoblotting; b, d) statistics of insulin-stimulated phosphorylation of Akt at Thr308 (n = 3) or Ser473 (n = 3), respectively.
IL-4 activated, in concentration-dependent manner, phosphorylation of Akt at both Thr308 (Fig. 2, a and b) and Ser473 (Fig. 2, c and d) in cells with IR. The effect of IL-4 was not uniform. At low IL-4 concentrations (25 ng/ml) the formally calculated stimulation of Akt phosphorylation was lower than in the absence of IL-4 and did not exceed 1.5-fold. IL-4 increased both basal and insulin-dependent Akt phosphorylation to such an extent that differences between the two values vanished. This effect might be expected if these values reflect maximal levels of Akt phosphorylation. At higher concentrations (50 and 100 ng/ml), IL-4 did not affect basal phosphorylation of Akt, but increased the insulin-induced phosphorylation, presumably to the maximal level, i.e. comparable to that in stimulated control cells without IR (Fig. 2, a and c). As a result, IL-4 completely restored insulin-induced phosphorylation of Thr308 in resistant cells to the levels observed in cells without IR (Fig. 2b), and increased Ser473 phosphorylation stimulated by insulin ~2-fold (Fig. 2d). Yet, 50 ng/ml IL-4 did not affect the profile of Akt phosphorylation in the absence of IR (Fig. 2, a and c, right panel).
Thus, IL-4 restores the ability of insulin to activate PI3 kinase pathway and phosphorylation of Akt in 3T3-L1 adipocytes under conditions of lipid-induced IR with the maximal effect observed at 50 ng/ml of IL-4.
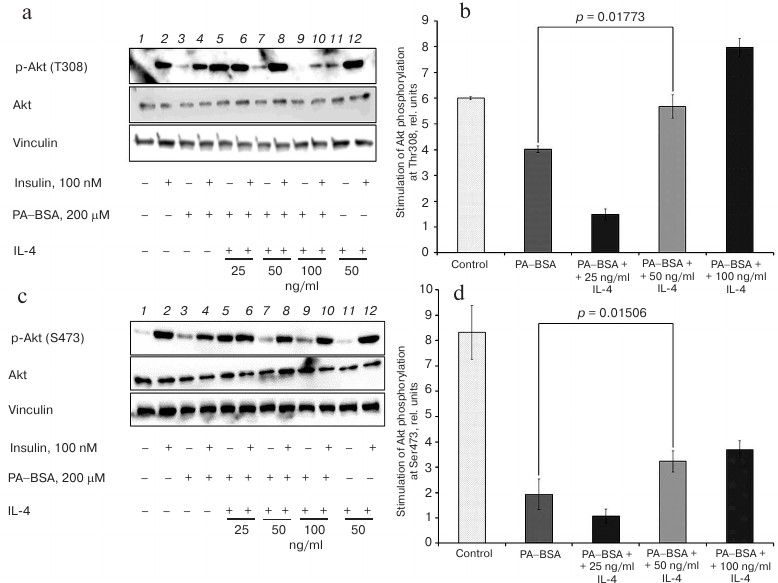
IL-4 restores Akt-dependent phosphorylation of AS160 in lipid-induced IR. Akt phosphorylation of AS160 initiates GLUT4 translocation to the plasma membrane and glucose transport into the cells. Insulin only slightly (1.2-fold) stimulated phosphorylation of the key Ser318 residue in AS160 in 3T3-L1 adipocytes (Fig. 3), which may be due to the presence of other Akt-phosphorylated residues in AS160 that have different sensitivity to insulin [15, 16]. IR impaired stimulation of Ser318 phosphorylation and decreased it ~2-fold (p = 0.04) (Fig. 3b).
Fig. 3. IL-4 stimulates insulin-dependent phosphorylation of AS160 at Ser318 in 3T3-L1 adipocytes with experimental lipid-induced IR: a) immunoblotting; b) statistics of insulin-stimulated phosphorylation of AS160 (n = 3).
In cells with experimentally induced IR, IL-4 increased the insulin-induced, but not basal phosphorylation of Ser318 in AS160 (Fig. 3a). In the presence of 25 or 50 ng/ml IL-4, insulin stimulated this phosphorylation ~1.5-fold, which is higher than in the control cells in the absence of IR (Fig. 3b). This effect was significant for both concentrations (p = 0.03 and p < 0.01, respectively). However, at 100 ng/ml, IL-4 failed to produce a significant effect on AS160 phosphorylation (p = 0.09). In the absence of IR, treatment of cells with 50 ng/ml IL-4 did not affect the profile of AS160 phosphorylation at Ser318 (Fig. 3a, right panel).
Thus, IL-4 restores the ability of insulin to activate insulin- and Akt-dependent phosphorylation of AS160 in 3T3-L1 adipocytes under conditions of lipid-induced IR. Both 25 and 50 ng/ml concentrations were sufficient to produce maximal effect.
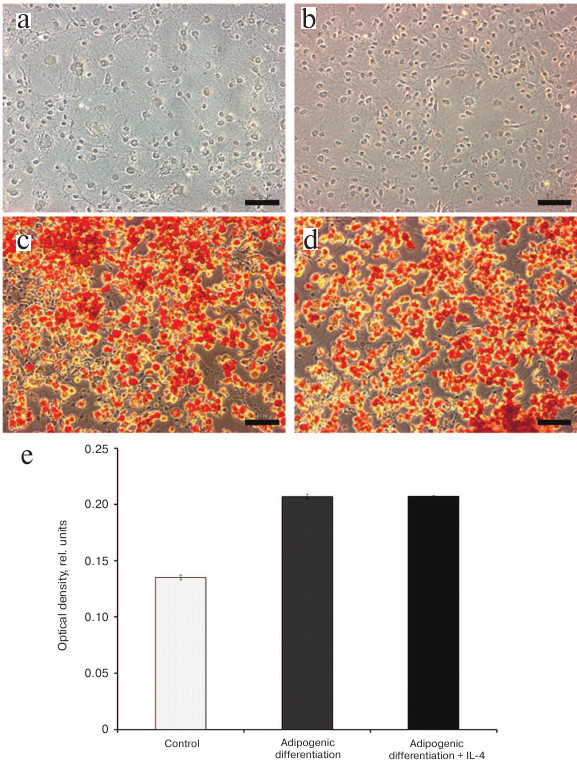
IL-4 does not affect accumulation of neutral lipids by 3T3-L1 adipocytes. Action of several antidiabetic compounds (thiazolidinediones, metformin) that restore sensitivity of adipose cells to insulin is due to formation of new fat depots via activation of adipogenic differentiation of the precursor cells [17]. To explore the effect of IL-4 on adipogenic differentiation of 3T3-L1 preadipocytes, the cells were subjected to standard differentiation procedure in the presence or absence of 50 ng/ml IL-4. The extent of differentiation was determined at the day 10 by staining the lipid droplets with the lipophilic dye Oil Red O followed by quantification of the dye extracted from cells with isopropanol.
The light microscopy analysis revealed no effect of 50 ng/ml of IL-4 on accumulation of neutral lipids by preadipocytes (Fig. 4, a and b). By the day 10 of differentiation, ~80% of cells contained neutral lipids stained with Oil Red O irrespectively of the presence or absence of IL-4 in the culturing medium during differentiation (Fig. 4, c and d). Quantification of the extracted Oil Red O also revealed no difference between the cells differentiated in the presence or absence of IL-4 (Fig. 4e). Preadipocytes that were cultured for 10 days without induction of differentiation contained twice less lipophilic dye than the cells after adipogenic differentiation (Fig. 4e, control). This indicates that IL-4 does not stimulate accumulation of neural lipids in 3T3-L1 cells (at least, at the concentration of 50 ng/ml), most likely due to its inability to stimulate adipogenic differentiation.
Fig. 4. IL-4 does not affect adipogenic differentiation of 3T3-L1 preadipocytes: a-d) phase contrast microscopy of undifferentiated 3T3-L1 preadipocytes cultured in the (a) absence or (b) presence of 50 ng/ml IL-4, and cells after 10 days of adipogenic differentiation in the (c) absence or (d) presence of 50 ng/ml IL-4. The cells were stained with Oil Red O; e) quantification of the neutral lipid content at the day 10 of differentiation (optical density of Oil Red O extracts at 600 nm). The control represents averaged data from (a) and (b).
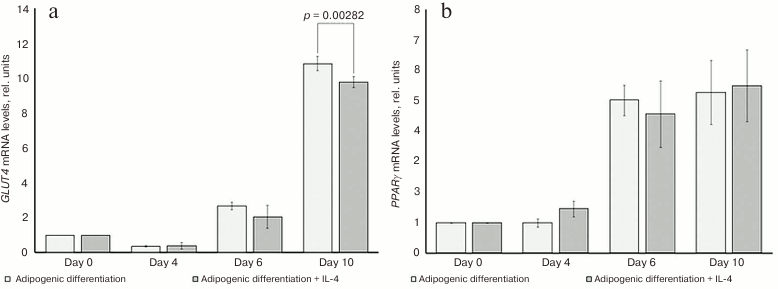
IL-4 only slightly decreases GLUT4 expression and does not affect PPARγ expression. To prove inability of IL-4 to induce or to affect the rate of adipogenic differentiation, we determined the mRNA levels of the key adipogenic markers GLUT4 and PPARγ (peroxisome proliferator-activated receptor γ) during adipogenic differentiation of 3T3-L1 cells in the presence or absence of 50 ng/ml IL-4.
As expected, expression of both GLUT4 and PPARγ considerably increased starting from the day 6 of adipogenic differentiation (Fig. 5). However, we did not observe marked differences in the levels of GLUT4 or PPARγ mRNAs (Fig. 5, a and b, respectively) in cells differentiated in the presence or absence of 50 ng/ml IL-4. Only at the day 10, there was a slight, but significant decrease, in the GLUT4 mRNA level in cells differentiated in the presence of IL-4 (p = 0.003). This is in agreement with no differences in accumulation of neutral lipids observed above, indicating that IL-4 neither induces, nor stimulates adipogenic differentiation of 3T3-L1 cells.
Fig. 5. Effect of IL-4 on the expression of adipogenic marker genes (a) GLUT4 and (b) PPARγ in 3T3-L1 adipocytes. The corresponding mRNA levels were determined by qPCR (n = 3) at different stages of adipogenic differentiation in the presence or absence of 50 ng/ml IL-4.
DISCUSSION
Here, we demonstrated that IL-4 stimulates activity of insulin signaling pathway in 3T3-L1 adipocytes. When used in the optimal concentration of 50 ng/ml, IL-4 maximally activated phosphorylation of all the key components of the insulin pathway (IRS1, Akt, and AS160) and restored cell sensitivity to insulin under IR conditions. At this concentration IL-4 only slightly affected insulin cascade activity in the control cells in the absence of IR, did not upregulate expression of GLUT4 and PPARγ (adipogenesis marker genes), and produced no effect on adipogenic differentiation of 3T3-L1 preadipocytes. Therefore, restoration of insulin sensitivity by IL-4 is most likely due to its signaling activity and does not proceed via formation of new fat depots.
The positive action of IL-4 on insulin sensitivity is likely related to the specifics of mechanisms of lipid-induced IR development in adipocytes. It is likely that free fatty acids act distinctively in these cells than in muscle and liver cells that develop lipotoxicity and activate atypical protein kinase C isoforms [18]. The major target of free fatty acid in adipose tissue is the type 4 Toll-like receptors (TLR4) that trigger classical inflammatory cascade via IκB kinase/nuclear factor κB (IKK/NF-κB) [5-8]. Activation of IKK/NF-κB upregulates expression of proinflammatory cytokines that act as autocrine factors and promote latent inflammation in adipose tissue [5, 6]. This increases activity of stress-activated kinases (JNK, IKK) that mediate inhibitory serine phosphorylation of IRS1, impair insulin signaling and glucose uptake by fat cells, leading to chronic metabolic disorders [7].
IL-4 is a classic antiinflammatory cytokine. Its signaling mechanism is not yet completely understood, but links to activation of the antiinflammatory transcription factor STAT6, which acts as a functional antagonist of the major inflammatory transcription factor NF-κB [11]. STAT6 activates expression of the antiinflammatory cytokines (IL-13, IL-33, TGFβ, etc.), inhibits activity of proinflammatory transcription factors, and restrains proinflammatory cytokine expression, thereby suppressing latent inflammation in adipose tissue. This justifies implementation of IL-4 as an insulin-sensitizing agent in the model of lipid-induced IR in adipocytes. Our results experimentally support this hypothesis.
We used standard cell model of lipid-induced adipose IR to reveal dose dependence of insulin-sensitizing activity of IL-4. The IL-4 concentration of 25 ng/ml was insufficient to restore insulin-dependent phosphorylation of IRS1 and Akt (Figs. 1 and 2). Only in case of AS160, IL-4 at concentration of 25 ng/ml restored insulin-dependent phosphorylation of Ser318 (Fig. 3). Because Ser318 is one of several phosphorylation sites for Akt in AS160 [15, 16], the possibility still exists that phosphorylation of Ser318 alone does not fully reflect the activatory effect of insulin on the total insulin-dependent phosphorylation of AS160.
In resistant adipocytes, 50 ng/ml of IL-4 was sufficient and optimal to restore activation of the key components of insulin cascade up to the levels observed in control cells without IR (Figs. 1-3). The only exception was insulin-dependent phosphorylation of Ser473 in Akt, which significantly increased but did not reach control values (Fig. 2, c and d). However, Tyr308 located in activation loop of the enzyme is most essential for Akt activation by phosphorylation, whereas Ser473 located in the hydrophobic motif is auxiliary [19]. While Thr308 is phosphorylated by PDK1 kinase in the context of classic insulin-activated PI3 kinase pathway, phosphorylation of Ser473 in Akt is mediated by the mammalian target of rapamycin complex 2 (mTORC2) [20]. The mechanisms of mTORC2 activation are not completely clear and involve both insulin-sensitive and insensitive components that may account for partial effect of IL-4 on Akt phosphorylation observed in our work.
Increasing IL-4 concentration to 100 ng/ml did not enhance insulin- sensitizing activity of IL-4. The stimulatory effect of IL-4 on tyrosine phosphorylation of IRS1 was even lower at 100 ng/ml than at 50 ng/ml. This may be due to existence of several mechanisms of IL-4 action in cells, some of which may not depend on insulin or PI3 kinase [11]. The signaling pathways activated by IL-4 in adipocytes are incompletely understood and warrant further studies to explain the optimal effects of intermediate (50 ng/ml) IL-4 concentrations on insulin sensitivity, at least in the cell model.
It is well known that the major antidiabetic drugs, such as metformin and thiazolidinediones, act via increased adipogenesis and de novo formation of insulin-sensitive fat depots [16]. Notably, IL-4 neither affected adipogenic differentiation, nor stimulated expression of adipogenic markers in cultured adipocytes, indicating that IL-4 acts via different mechanisms. Most likely, it activates antiinflammatory signaling, thereby creating new perspectives to control insulin sensitivity in adipose tissue.
In conclusion, we have demonstrated IL-4 potential to counteract IR in adipose cells. When used in optimal concentrations, IL-4 restored insulin sensitivity but did not affect adipogenic differentiation or insulin signaling under normal conditions. Future studies are needed to confirm beneficial effect of IL-4 in human primary adipocytes, to develop an IL-4-based gene therapeutic approach and validate it in a high-fat diet animal model.
Acknowledgments
This work was supported by the Russian Foundation for Basic Research and the National Intellectual Development Foundation for Supporting Scientific Activity of Students, Ph.D. Candidates, and Young Scientists (project 17-34-80026).
The authors have no apparent or potential conflicts of interest related to the publication of this article.
Note added in proof
While our manuscript was in preparation, the paper of Lee, S. E., et al. (2017) Diabetes, 66 (11), 2774-2788, appeared showing that IL-13, an antiinflammatory T-helper type 2 cytokine similar to IL-4, improves systemic glucose metabolism and insulin sensitivity in a high-fat-diet mouse model by increasing expression of growth differentiation factor 15 (GDF15) via Jak/STAT6 pathway in adipose tissue. This is consistent with our results obtained in the model cells and further supports a potential of IL-4 for therapy of insulin resistance.
REFERENCES
1.Trayhurn, P. (2013) Hypoxia and adipose tissue
function and dysfunction in obesity, Physiol. Rev.,
93, 1-21.
2.Ozcan, L., and Tabas, I. (2012) Role of endoplasmic
reticulum stress in metabolic diseases and other disorders, Annu.
Rev. Med., 63, 317-328.
3.Matsuda, M., and Shimomura, I. (2013) Increased
oxidative stress in obesity: implications for metabolic syndrome,
diabetes, hypertension, dyslipidemia, atherosclerosis and cancer,
Obes. Res. Clin. Pract., 7, e330-e341.
4.Satripy, P., and Loskutoff, D. J. (2003) Monocyte
chemoattractant protein 1 in obesity and insulin resistance, Proc.
Natl. Acad. Sci. USA, 100, 7265-7270.
5.Reilly, S. M., and Saltiel, A. R. (2014) A complex
role for adipose tissue macrophages, Nat. Rev. Endocrinol.,
10, 193-194.
6.Stafeev, I. S., Menshikov, M. Y., Tsokolaeva, Z.
I., Shestakova, M. V., and Parfyonova, Ye. V. (2015) Molecular
mechanisms of latent inflammation in metabolic syndrome. Possible role
of sirtuins and peroxisome proliferator-activated receptor type
γ, Biochemistry (Moscow), 80, 1480-1492.
7.Hotamisligil, G. S., and Erbay, E. (2008) Nutrient
sensing and inflammation in metabolic diseases, Nat. Rev.
Immunol., 8, 923-934.
8.Stafeev, I. S., Vorotnikov, A. V., Ratner, E. I.,
Menshikov, M. Y., and Parfyonova, Ye. V. (2017) Latent inflammation and
insulin resistance in adipose tissue, Int. J. Endocrinol.,
2017, 1-12.
9.Ricardo-Gonzalez, R. R., Red Eagle, A., Odegaard,
J. I., Jouihan, H., Morel, C. R., Heredia, J. E., Mukundal, L., Wu D.,
Locksley, R. M., and Chawla, A. (2010) IL-4/STAT6 immune axis regulate
peripheral nutrient metabolism and insulin sensitivity, Proc. Natl.
Acad. Sci. USA, 107, 22617-22622.
10.Darkhal, P., Gao, M., Ma, Y., and Liu, D. (2015)
Blocking high-fat diet-induced obesity, insulin resistance and fatty
liver by overexpression of IL-13 gene in mice, Int. J. Obes.,
39, 1292-1299.
11.Luzina, I. G., Keegan, A. D., Heller, N. M.,
Rook, G. A. W., Shea-Donohue, T., and Atamas, S. P. (2012) Regulation
of inflammation by interleukin-4: a review of
“alternatives”, J. Leuk. Biol., 92,
1-12.
12.Zebisch, K., Voight, V., Wabitsch, M., and
Brandsch, M. (2012) Protocol for effective differentiation of 3T3L1
cells to adipocytes, Anal. Biochem., 425,
88-90.
13.Svedberg, J., Bjorntorp, P., Smith, U., and
Lonnroth, P. (1990) Free-fatty acid inhibition of insulin binding,
degradation and action in isolated rat hepatocytes, Diabetes,
39, 570-574.
14.Laemmli, U. K. (1970) Cleavage of structural
proteins during the assembly of the head of bacteriophage T4,
Nature, 15, 680-685.
15.Kane, S., Sano, H., Liu, S. C. H., Asara, J. M.,
Lane, W. S., Garner, C. C., and Lienhard, G. E. (2002) A method to
identify serine kinases substrates. Akt phosphorylates a novel
adipocyte protein with a Rab GTPase-activating protein (GAP) domain,
J. Biol. Chem., 277, 22115-22118.
16.Sano, H., Kane, S., Sano, E., Miinea, C. P.,
Asara, J. M., Lane, W. S., Garner, C. W., and Lienhard, G. E. (2003)
Insulin-stimulated phosphorylation of a Rab GTPase-activating protein
regulated GLUT4 translocation, J. Biol. Chem.,
278, 14599-14602.
17.Hauner, H. (2002) The mode of action of
thiazolidinediones, Diabetes Metab. Res. Rev., 18,
S10-S15.
18.Samuel, V. T., and Shulman, G. I. (2012)
Integrating mechanisms for insulin resistance: common threads and
missing links, Cell, 148, 852-871.
19.Pearce, L. R., Komander, D., and Alessi, D. R.
(2010) The nuts and bolts of AGC protein kinases, Nat. Rev. Mol.
Cell. Biol., 11, 9-22.
20.Sarbassov, D. D., Ali, S. M., and Sabatini, D. M.
(2005) Growing roles for the mTOR pathway, Curr. Opin. Cell.
Biol., 17, 596-603.