Cytochrome P450 1A1 (CYP1A1) Catalyzes Lipid Peroxidation of Oleic Acid-Induced HepG2 Cells
B. Huang1, J. Bao1, Y.-R. Cao1, H.-F. Gao1, and Y. Jin1,a*
1Key Laboratory of Antiinflammatory and Immune Medicines, Ministry of Education, School of Pharmacy, Anhui Medical University, 230032 Hefei, China* To whom correspondence should be addressed.
Received August 15, 2017; Revision received February 19, 2018
Nonalcoholic fatty liver disease (NAFLD) is a chronic hepatic disease associated with excessive accumulation of lipids in hepatocytes. As the disease progresses, oxidative stress plays a pivotal role in the development of hepatic lipid peroxidation. Cytochrome P450 1A1 (CYP1A1), a subtype of the cytochrome P450 family, has been shown to be a vital modulator in production of reactive oxygen species. However, the exact role of CYP1A1 in NAFLD is still unclear. The aim of this study was to investigate the effects of CYP1A1 on lipid peroxidation in oleic acid (OA)-treated human hepatoma cells (HepG2). We found that the expression of CYP1A1 is elevated in OA-stimulated HepG2 cells. The results of siRNA transfection analysis indicated that CYP1A1-siRNA inhibited the lipid peroxidation in OA-treated HepG2 cells. Additionally, compared with siRNA-transfected and benzo[a]pyrene (BaP)-OA-induced HepG2 cells, overexpression of CYP1A1 by BaP further accelerated the lipid peroxidation in OA-treated HepG2 cells. These observations reveal a regulatory role of CYP1A1 in liver lipid peroxidation and imply CYP1A1 as a potential therapeutic target.
KEY WORDS: nonalcoholic fatty liver disease (NAFLD), CYP1A1, CYP1A1-siRNA, oxidative stress, lipid peroxidationDOI: 10.1134/S0006297918050127
Abbreviations: BaP, benzo[a]pyrene; CYP or CYP450, cytochrome P450 family; CYP1A1, cytochrome P450 1A1; HepG2 cells, human hepatoma cells; HNE, hydroxynonenal; MDA, malondialdehyde; NAFLD, nonalcoholic fatty liver disease; OA, oleic acid; ROS, reactive oxygen species; siRNA, small interfering RNA; SOD, superoxide dismutase; TAG, triacylglyceride.
Nonalcoholic fatty liver disease (NAFLD) is a condition in which
excessive lipid or hepatic abnormalities accumulate in hepatocytes [1]. NAFLD is widely recognized as the most common
driving force that eventually progresses to liver cirrhosis or hepatic
carcinoma [2, 3]. Several lines
of evidence have suggested that oxidative stress may play a key role in
the progression of lipid peroxidation in NAFLD. Mitochondrial oxidation
is the principal oxidative pathway for the deposition of fatty acids
under normal physiologic conditions. As an alternative method,
ω-hydroxylation of fatty acids can be utilized to prevent lipid
overload under the condition of defective oxidative phosphorylation of
mitochondria [4, 5]. In the
process of oxidation of fatty acids, microsomes leak excessive reactive
oxygen species (ROS) when there is an excessive production of ROS, the
balance between intrahepatic antioxidants and oxidants is broken,
surplus ROS abstract a hydrogen atom from polyunsaturated fatty acids,
resulting in the formation of 4-hydroxynonenal (HNE) and
malondialdehyde (MDA) [6, 7].
HNE and MDA have longer half-lives than ROS, and they can diffuse from
their original sites to distant intracellular and extracellular targets
[8], thereby amplifying the effects of oxidative
stress. Lipid peroxidation causes cell death and increases collagen
synthesis, which promotes the progression from steatosis to
fibrosis.
Cytochrome P450 (CYP450) family enzymes are involved in the oxidation of fatty acids and toxins present in the diet and environment [9, 10]. Fer et al. [11] demonstrated that cytochrome P450 1A1 (CYP1A1) is the ω-hydroxylases of polyunsaturated fatty acids, and it is reported that CYP1A1 can use an electron from NADPH to reduce O2, leading to production of H2O2 and superoxide anion radical [12, 13]. Moreover, it has also been reported that CYP1A1 induction is responsible for the enhancement of oxidative stress and increasing of the physiological generation of ROS in human skin [14, 15]. These previous studies demonstrated that CYP1A1 could induce oxidative stress as a result of excessive generation of ROS. However, it remains unclear whether CYP1A1 is implicated in hepatic oxidative stress, especially in regulating the fate of lipid.
For a long time, CYP1A1 has been documented as a pivotal regulator and therapeutic target in breast cancer, coronary artery disease, and arthritis [16-18]. Consistently, many pharmacological inhibitors of CYP1A1 have been identified with promising properties for the administration of these conditions [19]. Recently, it received renewed attention in liver diseases. Under this condition, increased CYP1A1 mRNA and protein levels were determined in the liver of high-fat and high-sucrose diet rats, while a low level of CYP1A1 could be detected in a model of NAFLD in vivo, implying its essential roles in NAFLD [20, 21].
Although NAFLD is the predominant cause of some severe types of liver disease, the mechanisms of its progression remain incompletely understood. At present, there is no approved and reliable treatment for NAFLD [22]. In this study, we found a relationship between CYP1A1 and NAFLD by analyzing the functional role of CYP1A1 in oleic acid (OA)-treated human hepatoma (HepG2) cells. The role of CYP1A1 in the lipid peroxidation of OA-treated HepG2 cells was confirmed. These studies enhance our understanding of CYP1A1 in NAFLD and provide valuable information about developing therapeutic strategies against NAFLD.
MATERIALS AND METHODS
Cell culture. HepG2 cells were acquired from the Shanghai Cell Bank at the Chinese Academy of Sciences. The HepG2 cells were maintained in DMEM medium containing 10% FBS in a 95% humidity incubator with 5% CO2 at 37°C.
Cytotoxicity. Treatment with OA induces morphological similarities to hepatic steatosis [23]. Therefore, the present study recreated a cellular model of NAFLD in vitro using HepG2 cells treated with OA. HepG2 cells were seeded in a 96-well plate at 1·104 cells/well, cultured for 24 h, then supplemented with medium containing different concentrations of OA solution (0.1, 0.2, 0.5, 1.0, and 2.0 mM) and cultured for another 24 h. The medium without OA but containing bovine serum albumin (BSA) was selected as the control. The suitable dosage was evaluated by MTT (3-(4,5-dimethylthiazol-2-yl)-2,5-diphenyltetrazolium bromide) assay.
OA-induced steatosis. HepG2 cells were cultured in 6-well plates at 5·105 cells/well. The cells were treated with 0.2 mM OA solution for 24 h and used for laboratory analyses. Oleic acid (Sigma-Aldrich, USA) was dissolved at a concentration of 10 mM in sodium hydroxide solution (0.1 M NaOH) that contained 10% fatty acid-free BSA (MP Biomedicals, USA).
Staining using Oil Red O. After incubation of HepG2 cells (5·105 cells/well) with OA solution (0.2 mM) for 24 h, the cells were washed three times with phosphate-buffered saline (PBS) and fixed in 4% paraformaldehyde at room temperature for 40 min. After removing the fixative, the cells were washed three times with PBS, then stained with a freshly prepared working solution (3 : 2) of Oil Red O for 20 min at room temperature. After removing the Oil Red O working solution, the cells were washed with 60% isopropanol for 5 s and finally observed under an inverted fluorescence microscope (Olympus, Japan).
Measurement of lipid accumulation. The HepG2 cells were lysed using an ultrasonic cell disintegrator (power 300 W, 5 s each time, 30 s interval, repeat 5 times) on an ice bath. The broken cells were directly measured without centrifugation. Levels of triacylglycerides (TAGs) were measured using a triglyceride determination reagent kit (Dongou, China) according to manufacturer’s protocol.
RNA interference analysis. Small interfering RNA (siRNA) oligonucleotides against the CYP1A1 gene was designed and synthesized by Shanghai Gena Pharma Corporation (China). The sequences were as follows: CYP1A1-siRNA (human) (sense: 5′-GUGAGCACUUCCAAAUGCATT-3′, and antisense: 5′-UGCAUUUGGAAGUGCUCACTT-3′); negative control (NC) (sense: 5′-UUCUCCGAACGUGUCACGUTT-3′, and antisense: 5′-ACGUGACACGUUCGGAGAATT-3′). HepG2 cells were cultured in antibiotic-free DMEM for 24 h and then transfected with siRNA using LipofectamineTM 2000 (Invitrogen, USA) according to manufacturer’s protocol. The OA solution was added to the concentration of 0.2 mM after transfection. Cell culture medium and cell protein supernatants were harvested and kept at –20°C for the quantification of several parameters. Knockdown efficiency was determined by Western blot analysis. The cells were divided into the following groups: control group, OA group, OA + CYP1A1-NC group, and OA + CYP1A1-siRNA group.
Benzo[a]pyrene (BaP) activation. Among polycyclic aromatic hydrocarbons, BaP is the most commonly recognized CYP1A1 agonist [24, 25]. BaP was purchased from Shanghai Macklin Biochemical Company (China). Transfected or primary HepG2 cells were exposed to 0.2 mM OA solution for 24 h. Subsequently, HepG2 cells were treated with BaP (5 μM) for another 24 h. Cells were divided into the following groups: OA group, OA + BaP group, OA + BaP + CYP1A1-siRNA group, OA + BaP + CYP1A1-NC group.
Measurement of oxidative stress. Oxidative stress can be detected by the measurement of superoxide dismutase (SOD), an enzyme used to prevent lipid peroxidation [26]. SOD activities (total SOD) in cell protein supernatant were measured through WST-8 (tetrazolium salt). SOD was determined by a SOD Assay Kit (Beyotime, China) according to manufacturer’s instructions. Protein concentration in lysates was determined using a BCA Protein Assay Kit (Beyotime), and the results are expressed as U/mg protein.
Besides, oxidative stress was also measured by the level of ROS from cells [27]. The fluorescence probe 2′,7′-dichlorofluorescein (DCFH-DA) was used to quantify ROS levels in the HepG2 cells. The fluorescence intensity was proportional to the ROS level within the cytosol. The HepG2 cells were incubated with DCFH-DA for 20 min at 37°C in the dark. The fluorescence signal of DCFH-DA was excited at 488 nm, and emission was detected at 525 nm using the inverted fluorescence microscope.
Measurement of lipid peroxidation. The thiobarbituric acid (TBA) assay was applied to determine lipid peroxidation [28]. Sample homogenates or MDA standards were incubated at 37℃ for 1 h before the addition of trichloroacetic acid, TBA, and acetic acid. Then the reaction mixtures were boiled for 15 min. A microplate plate reader was used to determine optical density at 532 nm. The protein concentration was determined using a BCA protein assay kit. The results are expressed as nmol/mg protein. HNE in the cell culture supernate was analyzed using an ELISA kit (R&D Systems, USA). The microplate plate reader was used to read the optical density at 450 nm. The results are expressed as μmol/liter.
Total RNA isolation and real-time quantitative PCR (RT-qPCR). Total RNA was isolated from HepG2 cells using TRIZOL reagent (Invitrogen, USA), and the first-strand cDNA was synthesized using a ThermoScript RT-PCR Synthesis Kit (Fermentas, Canada) according to the manufacturer’s instructions. Real time PCR was performed in a detection system with SYBR-Green Master Mix (TaKaRa, Japan). The fold-change for mRNA relative to β-actin was determined using the formula: 2–ΔΔCt. RT-PCR primers were purchased from Invitrogen. The primers used were as following: CYP1A1 (human) (forward: 5′-TCGGCCACGGAGTTTCTTC-3′; reverse: 5′-GGTCAGCATGTGCCCAATCA-3′), CYP1A2 (human) (forward: 5′-TTCGCTACCTGCCTAACCC-3′; reverse: 5′-CTCAGGCTTGGTCACAAGGTA-3′), H-actin (human) (forward: 5′-GACAGGATGCAGAAGGAGATTACT-3′; reverse: 5′-TGATCCACATCTGCTGGAAGGT-3′).
Western blot analyses. HepG2 cells were lysed with RIPA lysis buffer (Beyotime). Protein concentration was determined using a BCA protein assay kit. Total protein (50 mg) from samples was separated on 10% SDS-PAGE and then transferred onto polyvinylidene fluoride membranes (PVDF; Millipore, USA). After blocking in 5% nonfat milk, the membranes were washed in TBS-Tween 20 buffer (TBST; Boster, China) and incubated with specific primary antibodies at 4°C overnight. Then the membranes were washed three times with TBST buffer before incubation with specific secondary antibodies for 1 h. Rabbit polyclonal anti-CYP1A1 (Proteintech, USA) was diluted at 1 : 500, and mouse monoclonal anti-β-actin was diluted 1 : 200. The protein blots were detected using the ECL Chemiluminescent Kit (ECL; Thermo Scientific, USA). The primary antibodies were as follows: CYP1A1 (Cell Signaling Technology, USA); recombinant cytochrome P450 1A1 (30 ng/lane; Cloud Clone, USA); CYP1A2 (Cell Signaling Technology); β-actin (Bioss, China).
Statistical analysis. The data are presented as the mean ± SD. Analysis of variance (ANOVA) was used to evaluate the differences among groups. All experiments were repeated three times. Statistical significance was set at p < 0.05. All statistical analyses were performed with SPSS software (version 17.0).
RESULTS
Lipid accumulation in OA-treated HepG2 cells. The effect of different concentrations of OA on the proliferation of HepG2 cells was measured by the MTT assay (Fig. 1a). By contrast with the 0.1, 0.2, and 0.5 mM, OA solution at 1 and 2 mM concentrations significantly reduced proliferation of HepG2 cells by about 60%. Cell viability greater than 90% was considered as nontoxic concentration. Thus, it is considered that 0.2 mM OA medium was sufficient to induce lipid accumulation.
Fig. 1. Lipid accumulation in OA-treated HepG2 cells. The HepG2 cells were treated with OA solution (0.2 mM) for 12, 24, and 48 h. a) Proliferation of OA-induced HepG2 cells was tested by the MTT assay. b) Lipid droplets in HepG2 cells were stained with Oil Red O. c) TAG content in OA-induced HepG2 cells. d) The protein level of CYP1A1 was assessed by Western blot. e) The mRNA level of CYP1A1 was examined by real-time PCR; ** p < 0.01 compared with the control group.
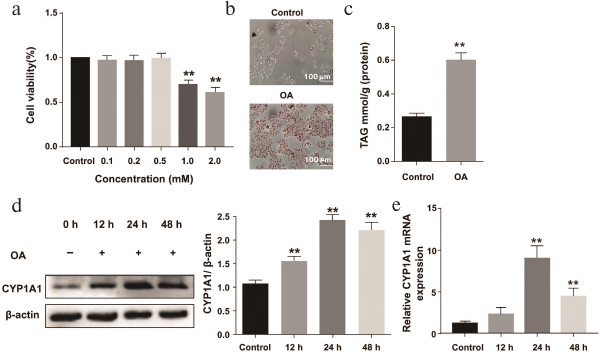
Oil Red O staining provided evidence that OA significantly increased lipid accumulation in HepG2 cells compared with the control group (Fig. 1b), and this was further reflected in cellular TAG level, which was markedly elevated in the OA group compared with control group (Fig. 1c). Thus, the data gave solid evidence for the successful modeling of NAFLD in vitro.
Increased expression of CYP1A1 in OA-treated HepG2 cells. To detect the expression of CYP1A1 in NAFLD, we treated the cells with OA medium (0.2 mM) for 0, 12, 24, and 48 h, respectively. Western blot and real-time PCR analysis demonstrated that the expression of CYP1A1 was elevated in the model groups (Fig. 1, d and e). Level of CYP1A1 in the control group was relatively low (Fig. 1, d and e).
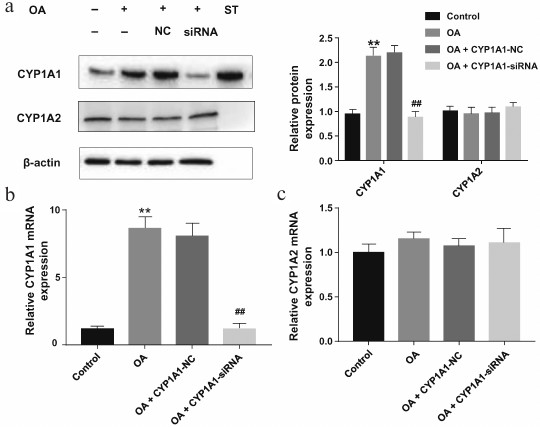
Reduced expression of CYP1A1 after CYP1A1-siRNA transfection in OA-treated HepG2 cells. To investigate the role of CYP1A1 in OA-treated HepG2 cells, siRNA specific for CYP1A1 was used to silence CYP1A1 expression. Western blot and real-time PCR analysis demonstrated that CYP1A1-siRNA noticeably decreased the expression of CYP1A1 (Fig. 2, a and b). Protein standards for CYP1A1 were loaded at 30 ng/lane. As shown in Fig. 2a, the target protein is at the same level with the standard, indicating that the measured protein is CYP1A1. The protein and mRNA expression of CYP1A2 in the model group showed no significant difference compared with the control group (Fig. 2, a-c).
Fig. 2. Effects of changes in the expression of CYP1A1 and CYP1A2 in OA-treated HepG2 cells. After CYP1A1-siRNA or CYP1A1-NC transfection, the HepG2 cells were exposed to OA solution (0.2 mM) for 24 h. a) The protein level of CYP1A1 and CYP1A2 was assessed by Western blot. b, c) The mRNA level of CYP1A1 and CYP1A2 was examined by real-time PCR. The results are expressed as relative expression against β-actin expression; ** p < 0.01 compared with the control group; ## p < 0.01 compared with the OA group.
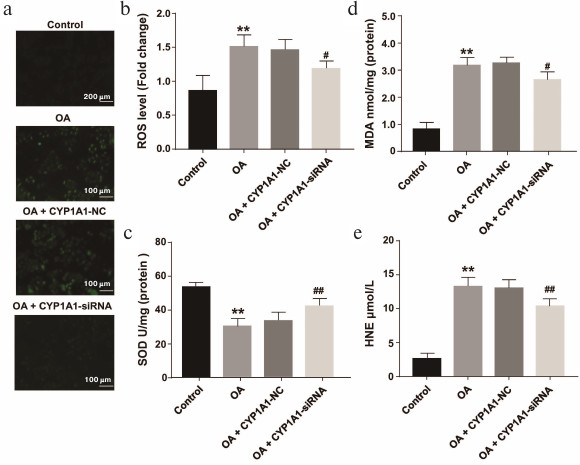
Blockade of CYP1A1 inhibited the OA-induced hepatic oxidative stress and lipid peroxidation in HepG2 cells. To identify whether CYP1A1-siRNA could ameliorate lipid peroxidation and oxidative stress, the contents of ROS and SOD were determined. These were selected as measurements of oxidative stress. MDA and HNE were selected as signs of lipid peroxidation. Our results revealed that on downregulation of CYP1A1 expression, the levels of MDA and HNE were also decreased in OA-stimulated HepG2 cells (0.2 mM) compared with the model groups (Fig. 3, d and e). According to the results of fluorescence measurements, the level of ROS was reduced, while the level of SOD was upregulated in the transfection group compared with the model groups (Fig. 3, a-c). These findings demonstrate that CYP1A1-siRNA can decrease lipid peroxidation, probably due to the regulation of oxidant ROS molecules and antioxidant SOD.
Fig. 3. OA-induced hepatic oxidative stress and lipid peroxidation in primary HepG2 cells and CYP1A1-siRNA-transfected HepG2 cells. a) The level of ROS was analyzed by fluorescence. Representative views from each group are presented (×10). b) Quantification of ROS content. c) Effects of changes in the levels of SOD in the experimental groups. d, e) Effects of changes in the levels of MDA and HNE in the experimental groups; ** p < 0.01 compared with the control group; ## p < 0.01 and # p < 0.05 compared with the OA group.
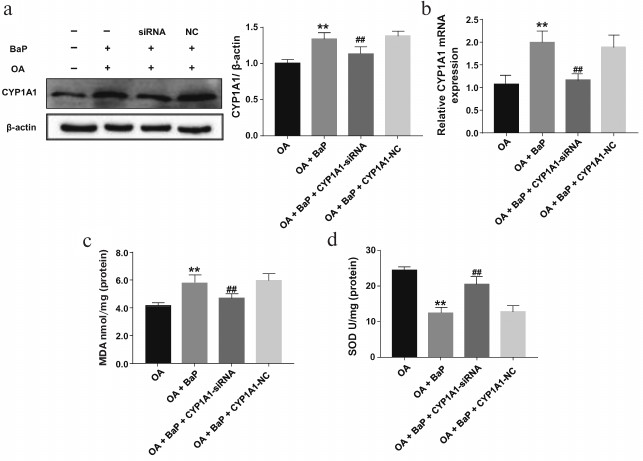
Overexpression of CYP1A1 aggravates oxidative stress and lipid peroxidation in OA-treated HepG2 cells. OA-treated HepG2 cells stimulated by BaP were analyzed to compare the influence of the CYP1A1 genes transcription on lipid peroxidation in OA-treated HepG2 cells. As presented in Fig. 4, a and b, CYP1A1-siRNA decreased the protein and mRNA expression of CYP1A1 in BaP-OA-induced HepG2 cells. However, it still showed higher expression than in the OA group. Compared with BaP-OA-activated cells, the level of SOD in transfected groups was slightly increased (Fig. 4d). Additionally, contents of MDA were reduced in the transfected groups, which further confirmed that CYP1A1 plays a role in lipid peroxidation (Fig. 4c). The data indicate that overexpression of CYP1A1 significantly aggravated lipid peroxidation in OA-treated HepG2 cells.
Fig. 4. Transfected relatively low expression of CYP1A1 alleviated the oxidative stress and lipid peroxidation in BaP-OA-induced HepG2 cells. a) The protein level of CYP1A1 assessed by Western blot. b) The mRNA level of CYP1A1 examined by real-time PCR. c, d) Effects of changes in the levels of MDA and SOD in the experimental groups; ** p < 0.01 compared with the control group; ## p < 0.01 compared with the OA group.
Together, these results suggest that downregulation of CYP1A1 expression attenuated the lipid peroxidation of OA-treated HepG2 cells, and CYP1A1 might be a potential target to reverse hepatic lipid peroxidation.
DISCUSSION
NAFLD is a progressive hepatic disorder and has become the most common cause of liver disease in Western countries. Oxidative stress is the key mechanism promoting NAFLD progression to NASH (nonalcoholic steatohepatitis) and even liver cirrhosis and hepatocellular carcinoma. Accordingly, NAFLD patients have increased levels of oxidative stress and lipid peroxides, and either depleting of antioxidant enzymes or increasing production of oxidative factors can occur in NAFLD [29]. Therefore, inhibition of oxidative stress and blockade of lipid peroxidation in the fatty liver are important strategies for the therapeutic intervention of NAFLD [30].
CYP1A1 is a central player in the bioactivation of precarcinogen. Therefore, it has been proposed as a therapeutic target against cancers and cardiovascular disease [31]. Nevertheless, the functions of CYP1A1 are not limited to precarcinogen metabolism. In the last few years, numerous studies focused on the functions of CYP1A1 in liver disease have been published [32]. However, the exact role of CYP1A1 in the degree of liver lipid peroxidation has not been elucidated.
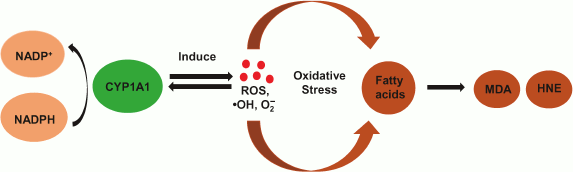
Nevertheless, emerging evidence indicates the potential role of CYP1A1 in promoting the development of oxidative stress. CYP1A1-catalyzed metabolism of its substrates is known to lead to increased ROS. O2•– and H2O2 are byproducts of the normal P450 catalytic cycle. It was reported that CYP1A1 shows high ability for consuming NADPH and generating superoxide anion [33]. These studies suggest that a peroxide-induced reaction might be catalyzed readily by CYP1A1. In this regard, the present study was designed to reveal whether CYP1A1 plays an essential role in the formation of lipid peroxidation in NAFLD (Fig. 5).
Fig. 5. Overview of the role of CYP1A1 in catalysis of lipid oxidation. CYP1A1 modulates ROS activity by the consumption of NADPH. ROS abstract hydrogen atoms from PUFA, resulting in the formation of HNE and MDA.
With respect to NAFLD, OA-induced HepG2 cells serve as a model of NAFLD in vitro. Results of Oil Red O staining indicated extensive lipid droplet accumulation after OA addition. Analysis of TAG results reflects the uptake of OA, and it is entirely consistent with lipid droplets staining with Oil Red O. Therefore, OA-induced HepG2 cell steatosis is a valuable model to study the pathogenesis of NAFLD.
To the best of our knowledge, CYP1A1 is expressed in HepG2 cells at relatively low levels but is upregulated in OA-treated HepG2 cells. To explore the expression of CYP1A1 in NAFLD, we established an NAFLD model in vitro at a set of time points. Here, our study provided the evidence that CYP1A1 is dramatically increased in OA-treated HepG2 cells. We and others have found that CYP1A1 is highly induced in NAFLD [34]. In addition, our study found that the protein expression of CYP1A1 in HepG2 cells is slightly decreased at 48 h, even though it still shows higher protein expression than the control group. These results can be explained by an oxidative repression effect on the CYP1A1 gene. The increased CYP1A1 activity generates ROS that can bind to a transcription factor of the Nuclear Factor I (NF-I) family, which in turn is released from the promoter of CYP1A1 gene. Thus, the expression of the CYP1A1 protein can be decreased [35].
HepG2 cells transfected with CYP1A1-siRNA followed by exposure to OA solution were used to study the effect of CYP1A1 on lipid peroxidation. On one hand, the experimental results showed that blockade of CYP1A1 partially suppressed the deposition of MDA and HNE, indicating that the loss of CYP1A1 could alleviate the excess deposition of lipid peroxides. On the other hand, our experiments provided information on the amount of lipid peroxidation metabolites in cells treated only with OA. Furthermore, treatment of HepG2 cells with CYP1A1-siRNA was shown to influence the concentration of ROS and SOD. Our results demonstrate that CYP1A1 regulates lipid peroxidation by affecting the levels of ROS and SOD.
Based on our literature review, CYP1A2 and CYP1A1 have very high structural similarity and immunoreactivity [36], so it is possible that CYP1A2 serves as an oxidative catalyst in nonalcoholic fatty liver. To clarify this issue, we used the standards of CYP1A1 to show that the protein expression is referred to CYP1A1. In Fig. 2a, the target band has the same molecular weight as the CYP1A1 standard. This shows that the measured protein is CYP1A1. The protein and mRNA expressions of CYP1A2 in the normal group, model group, and transfection group did not change significantly. This further shows that CYP1A1 plays a major catalytic role in lipid peroxidation in NAFLD.
BaP is an important inducer of CYP1A1, and several studies have shown that BaP is involved in redox cycling via CYP1A1 [37, 38]. In contrast with the OA-BaP-CYP1A1-siRNA group, we further found that the overexpression of CYP1A1 increased the level of MDA and decreased the concentration of SOD, revealing the potential importance of CYP1A1 in lipid peroxidation. This finding is consistent with the finding that CYP1A1-siRNA decreased the lipid peroxidation in OA-treated HepG2 cells.
Together, the data of the present study suggest that blockade of CYP1A1 inhibited OA-induced peroxidation in HepG2 cells, while overexpression of CYP1A1 aggravated the peroxidation in OA-induced HepG2 cells. These results indicate that CYP1A1 is a potential therapeutic target for treatment of NAFLD. Pharmacological inhibition of CYP1A1 might be perspective for treatment of NAFLD. Nevertheless, the fundamental role of CYP1A1 in NAFLD is not fully examined in animal models, so studies using in vivo techniques should be urgently conducted.
REFERENCES
1.Xu, C., Wang, G., Hao, Y., Zhi, J., Zhang, L., and
Chang, C. (2011) Correlation analysis between gene expression profile
of rat liver tissues and high-fat emulsion-induced nonalcoholic fatty
liver, Dig. Dis. Sci., 56, 2299-2308.
2.Clark, J. M., and Diehl, A. M. (2003) Nonalcoholic
fatty liver disease: an underrecognized cause of cryptogenic cirrhosis,
JAMA, 289, 3000-3004.
3.Wong, C. R., Nguyen, M. H., and Lim, J. K. (2016)
Hepatocellular carcinoma in patients with non-alcoholic fatty liver
disease, World J. Gastroenterol., 22, 8294-8303.
4.Angulo, P. (2002) Nonalcoholic fatty liver disease,
N. Engl. J. Med., 346, 1221-1231.
5.Petrosillo, G., Portincasa, P., Grattagliano, I.,
Casanova, G., Matera, M., Ruggiero, F. M., Ferri, D., and Paradies, G.
(2007) Mitochondrial dysfunction in rat with nonalcoholic fatty liver
involvement of complex I, reactive oxygen species and cardiolipin,
Biochim. Biophys. Acta, 1767, 1260-1267.
6.Pessayre, D., Berson, A., Fromenty, B., and
Mansouri, A. (2001) Mitochondria in steatohepatitis, Semin. Liver
Dis., 21, 57-69.
7.Esterbauer, H., Schaur, R. J., and Zollner, H.
(1991) Chemistry and biochemistry of 4-hydroxynonenal, malonaldehyde
and related aldehydes, Free Radic. Biol. Med., 11,
81-128.
8.Rolo, A. P., Teodoro, J. S., and Palmeira, C. M.
(2012) Role of oxidative stress in the pathogenesis of nonalcoholic
steatohepatitis, Free Radic. Biol. Med., 52,
59-69.
9.Myasoedova, K. N. (2008) New findings in studies of
cytochromes P450, Biochemistry (Moscow), 73, 965-969.
10.Bonina, T. A., Gilep, A. A., Estabrook, R. W.,
and Usanov, S. A. (2005) Engineering of proteolytically stable
NADPH-cytochrome P450 reductase, Biochemistry (Moscow),
70, 357-365.
11.Fer, M., Corcos, L., Dreano, Y., Plee-Gautier,
E., Salaun, J. P., Berthou, F., and Amet, Y. (2008) Cytochromes P450
from family 4 are the main omega hydroxylating enzymes in humans:
CYP4F3B is the prominent player in PUFA metabolism, J. Lipid
Res., 49, 2379-2389.
12.Puntarulo, S., and Cederbaum, A. I. (1998)
Production of reactive oxygen species by microsomes enriched in
specific human cytochrome P450 enzymes, Free Radic. Biol. Med.,
24, 1324-1330.
13.Stohs, S. J. (1990) Oxidative stress induced by
2,3,7,8-tetrachlorodibenzo-p-dioxin (TCDD), Free Radic. Biol.
Med., 9, 79-90.
14.Melchini, A., Catania, S., Stancanelli, R.,
Tommasini, S., and Costa, C. (2011) Interaction of a functionalized
complex of the flavonoid hesperetin with the AhR pathway and CYP1A1
expression: involvement in its protective effects against
benzo[a]pyrene-induced oxidative stress in human skin, Cell Biol.
Toxicol., 27, 371-379.
15.Furue, M., Uchi, H., Mitoma, C.,
Hashimoto-Hachiya, A., Chiba, T., Ito, T., Nakahara, T., and Tsuji, G.
(2017) Antioxidants for healthy skin: the emerging role of aryl
hydrocarbon receptors and nuclear factor-erythroid 2-related factor-2,
Nutrients, 9, 223.
16.Al-Dhfyan, A., Alhoshani, A., and Korashy, H. M.
(2017) Aryl hydrocarbon receptor/cytochrome P450 1A1 pathway mediates
breast cancer stem cells expansion through PTEN inhibition and
beta-catenin and Akt activation, Mol. Cancer, 16, 14.
17.Zou, J. G., Ma, Y. T., Xie, X., Yang, Y. N., Pan,
S., Adi, D., Liu, F., and Chen, B. D. (2014) The association between
CYP1A1 genetic polymorphisms and coronary artery disease in the Uygur
and Han of China, Lipids Health Dis., 13, 145.
18.Yen, J. H., Tsai, W. C., Lin, C. H., Ou, T. T.,
Hu, C. J., and Liu, H. W. (2003) Cytochrome P450 1A1 and manganese
superoxide dismutase genes polymorphisms in reactive arthritis,
Immunol. Lett., 90, 151-154.
19.Liu, J., Sridhar, J., and Foroozesh, M. (2013)
Cytochrome P450 family 1 inhibitors and structure-activity
relationships, Molecules, 18, 14470-14495.
20.Chiba, T., Noji, K., Shinozaki, S., Suzuki, S.,
Umegaki, K., and Shimokado, K. (2016) Diet-induced non-alcoholic fatty
liver disease affects expression of major cytochrome P450 genes in a
mouse model, J. Pharm. Pharmacol., 68, 1567-1576.
21.Suzuki, S., Sato, Y., Umegaki, K., and Chiba, T.
(2015) The major cytochrome P450 subtype activities in diet-induced
non-alcoholic steatohepatitis mouse model, Endocrinol. Metab.
Synd., 4, 190.
22.Ganesh, S., and Rustgi, V. K. (2016) Current
pharmacologic therapy for nonalcoholic fatty liver disease, Clin.
Liver Dis., 20, 351-364.
23.Hwang, Y. J., Wi, H. R., Kim, H. R., Park, K. W.,
and Hwang, K. A. (2014) Pinus densiflora Sieb. et Zucc.
alleviates lipogenesis and oxidative stress during oleic acid-induced
steatosis in HepG2 cells, Nutrients, 6, 2956-2972.
24.Burczynski, M. E., and Penning, T. M. (2000)
Genotoxic polycyclic aromatic hydrocarbon ortho-quinones generated by
aldo-keto reductases induce CYP1A1 via nuclear translocation of the
aryl hydrocarbon receptor, Cancer Res., 60, 908-915.
25.An, J., Yin, L. L., Shang, Y., Zhong, Y. F.,
Zhang, X. Y., Wu, M. H., Yu, Z. Q., Sheng, G. Y., Fu, J. M., and Huang,
Y. C. (2011) The combined effects of BDE47 and BaP on oxidatively
generated DNA damage in L02 cells and the possible molecular mechanism,
Mutat Res. Gen. Tox. En., 721, 192-198.
26.Xie, C., Chen, Z., Zhang, C., Xu, X., Jin, J.,
Zhan, W., Han, T., and Wang, J. (2016) Dihydromyricetin ameliorates
oleic acid-induced lipid accumulation in L02 and HepG2 cells by
inhibiting lipogenesis and oxidative stress, Life Sci.,
157, 131-139.
27.Charlton, M., Krishnan, A., Viker, K., Sanderson,
S., Cazanave, S., McConico, A., Masuoko, H., and Gores, G. (2011) Fast
food diet mouse: novel small animal model of NASH with ballooning,
progressive fibrosis, and high physiological fidelity to the human
condition, Am. J. Physiol. Gastrointest. Liver Physiol.,
301, G825-834.
28.Chatuphonprasert, W., Udomsuk, L.,
Monthakantirat, O., Churikhit, Y., Putalun, W., and Jarukamjorn, K.
(2013) Effects of Pueraria mirifica and miroestrol on the
antioxidation-related enzymes in ovariectomized mice, J. Pharm.
Pharmacol., 65, 447-456.
29.Jarukamjorn, K., Jearapong, N., Pimson, C., and
Chatuphonprasert, W. (2016) A high-fat, high-fructose diet induces
antioxidant imbalance and increases the risk and progression of
nonalcoholic fatty liver disease in mice, Scientifica,
2016, 5029414.
30.Spahis, S., Delvin, E., Borys, J. M., and Levy,
E. (2017) Oxidative stress as a critical factor in nonalcoholic fatty
liver disease pathogenesis, Antioxid. Redox Signal., 26,
519.
31.Agbor, L. N., Walsh, M. T., Boberg, J. R., and
Walker, M. K. (2012) Elevated blood pressure in cytochrome P4501A1
knockout mice is associated with reduced vasodilation to omega-3
polyunsaturated fatty acids, Toxicol. Appl. Pharm., 264,
351-360.
32.Stiborova, M., Martinek, V., Rydlova, H., Koblas,
T., and Hodek, P. (2005) Expression of cytochrome P450 1A1 and its
contribution to oxidation of a potential human carcinogen
1-phenylazo-2-naphthol (Sudan I) in human livers, Cancer Lett.,
220, 145-154.
33.Melchini, A., Catania, S., Stancanelli, R.,
Tommasini, S., and Costa, C. (2011) Interaction of a functionalized
complex of the flavonoid hesperetin with the AhR pathway and CYP1A1
expression: involvement in its protective effects against
benzo[a]pyrene-induced oxidative stress in human skin, Cell Biol.
Toxicol., 27, 371-379.
34.Fisher, C. D., Jackson, J. P., Lickteig, A. J.,
Augustine, L. M., and Cherrington, N. J. (2008) Drug metabolizing
enzyme induction pathways in experimental non-alcoholic
steatohepatitis, Arch. Toxicol., 82, 959-964.
35.Barouki, R., and Morel, Y. (2001) Repression of
cytochrome P450 1A1 gene expression by oxidative stress: mechanisms and
biological implications, Biochem. Pharmacol., 61,
511-516.
36.Scott, E. E. (2016) The role of
protein–protein and protein–membrane interactions on P450
function, Drug Metab. Dispos., 44, 576-590.
37.Go, R. E., Hwang, K. A., and Choi, K. C. (2015)
Cytochrome P450 1 family and cancers, J. Steroid Biochem. Mol.
Biol., 147, 24-30.
38.Cherng, S. H., Lin, P., Yang, J. L., Hsu, S. L.,
and Lee, H. (2001) Benzo[g,h,i]perylene synergistically transactivates
benzo[a]pyrene-induced CYP1A1 gene expression by aryl hydrocarbon
receptor pathway, Toxicol. Appl. Pharmacol., 170,
63-68.