Structural Study of the Complex Formed by Ceruloplasmin and Macrophage Migration Inhibitory Factor
A. V. Sokolov1,2,3,4#, L. A. Dadinova5#, M. V. Petoukhov5,6,7,8, G. Bourenkov6, K. M. Dubova5, S. V. Amarantov5, V. V. Volkov5, V. A. Kostevich1,2, N. P. Gorbunov1, N. A. Grudinina1, V. B. Vasilyev1,3, and V. R. Samygina5,9,a*
1Institute of Experimental Medicine, 197376 St. Petersburg, Russia2Federal Research and Clinical Center of Physical-Chemical Medicine of Federal Medical Biological Agency, 119435 Moscow, Russia
3St. Petersburg State University, 199000 St. Petersburg, Russia
4Center of Preclinical Translational Research, Almazov National Medical Research Center, 197371 St. Petersburg, Russia
5Shubnikov Institute of Crystallography, FSRC “Crystallography and Photonics”, Russian Academy of Sciences, 119333 Moscow, Russia
6European Molecular Biology Laboratory (EMBL), 22607 Hamburg, Germany
7Frumkin Institute of Physical Chemistry and Electrochemistry, Russian Academy of Sciences, 119071 Moscow, Russia
8Semenov Institute of Chemical Physics, Russian Academy of Sciences, 119991 Moscow, Russia
9National Research Center “Kurchatov Institute”, 123182 Moscow, Russia
# These authors contributed equally to this work.
* To whom correspondence should be addressed.
Received November 1, 2017; Revision received February 2, 2018
Macrophage migration inhibitory factor (MIF) is a key proinflammatory cytokine. Inhibitors of tautomerase activity of MIF are perspective antiinflammatory compounds. Ceruloplasmin, the copper-containing ferroxidase of blood plasma, is a noncompetitive inhibitor of tautomerase activity of MIF in the reaction with p-hydroxyphenylpyruvate. Small-angle X-ray scattering established a model of the complex formed by MIF and ceruloplasmin. Crystallographic analysis of MIF with a modified active site supports the model. The stoichiometry of 3 CP/MIF trimer complex was established using gel filtration. Conformity of novel data concerning the interaction regions in the studied proteins with previous biochemical data is discussed.
KEY WORDS: X-ray analysis, small-angle X-ray scattering, protein–protein interactions, ceruloplasmin, macrophage migration inhibitory factorDOI: 10.1134/S000629791806007X
Abbreviations: CP, ceruloplasmin; FITC, fluorescein isothiocyanate; HPP, p-hydroxyphenylpyruvate; MIF, macrophage migration inhibitory factor; MM, molecular mass; PITC, phenyl isothiocyanate; SAXS, small-angle X-ray scattering.
Macrophage migration inhibitory factor (MIF) is a key proinflammatory
cytokine coordinating delayed-type hypersensitivity and is the central
mediator of innate immune response [1]. The
predominant stoichiometry of MIF is trimeric, and the molecular mass
(MM) of the subunit is 12.5 kDa. Many studies have shown
its important role in various autoimmune diseases, multiple sclerosis,
Alzheimer’s disease, spinal cord injuries, cardiovascular
diseases, and malignant growth [2]. MIF has several
biological activities, including enzymatic properties of tautomerase
and thiol oxidoreductase, hormonal activity, regulation of glucose
homeostasis, and counteraction to corticosteroids. The
N-terminal Pro residue in MIF is crucial for its tautomerase and
proinflammatory activity [2]. Inhibitors of MIF are
regarded as prospective compounds for antiinflammatory therapy, and
some are under clinical studies [3]. MIF has
features of a superligand, binding to various extra- and intracellular
protein molecules [4-6]. It was
shown to form complexes with plasma proteins, in particular, with
ceruloplasmin (CP), a copper-containing ferroxidase [6]. Our study showed that in this complex CP in
noncompetitive mode inhibits the tautomerase activity of MIF in its
reaction with p-hydroxyphenylpyruvate (HPP) by forming a complex
with MIF–HPP [7]. A covalent modification of
the active center in MIF by phenylmethylsulfonyl fluoride (PMSF)
revealed its interaction with CP using surface plasmon resonance [7]. CP is a monomer with MM ~ 132 kDa
containing 6-8 copper ions, of which two with unknown function are
bound to so-called labile binding sites (LS1 and LS2) that are not
always filled [7]. Filling the labile sites in CP
with copper ions is required for inhibiting MIF.
No precise data on the sites involved in interaction in CP and MIF have been obtained so far. In this study, we examined the MIF–CP complex using gel filtration, small-angle X-ray scattering (SAXS), and crystallography. Based on the data of inhibitory analysis and surface plasmon resonance, isothiocyanates irreversibly modifying N-terminal proline of MIF were used to simulate the presence of a substrate in the active center of MIF to create a permanent complex between modified MIF and CP. This resulted in a 3D low-resolution model of the MIF–CP complex and in spotting the sites of interaction between the component of the complex. The active center of MIF interacts with a region in domain IV of CP that contains a labile copper-binding site LS1.
MATERIALS AND METHODS
Reagents. The following reagents were used: UNOsphere Q, UNOsphere S, and Bio-Gel A-1.5m fine (Bio-Rad, USA); EDTA and triethylamine (Merck, Germany); Tris (Serva, Germany); 6-aminocaproic acid, HPP, glycine, neomycin trisulfate, ammonium sulfate, PMSF, phenyl isothiocyanate (PITC), fluorescein isothiocyanate (FITC), CM-Sephadex, DEAE-Sephadex, and Sephacryl S-200 HR (Sigma, USA).
Protein isolation and purification. To obtain a preparation of monomeric CP having A610/A280 > 0.049, human plasma containing 1 mM EDTA and 0.1 mM PMSF was subjected to chromatography on UNOsphere Q and on neomycin-agarose [8]. Then the CP was concentrated to 80 mg/ml in a Vivaspin 20 (Sartorius, Germany) centrifuge cell (MM > 100 kDa retained) with three changes of buffer A (0.1 M Hepes-NaOH, pH 7.4, 50 μM CuSO4). Homogeneous recombinant MIF was obtained by chromatography on DEAE-Sephadex, CM-Sephadex, and UNOsphere S [7].
Modification of MIF and preparation of its complex with CP. MIF was modified using two inhibitors, i.e. FITC and PITC. To 20 mg of MIF in 10 ml of 0.4 M sodium-phosphate-borate buffer, pH 6.4, an inhibitor solution (0.5 mg/ml) in dimethylsulfoxide (in case of FITC) or in isopropanol (in case of PITC) was added. The mixture was incubated with continuous stirring (90 rpm) at 25°C in the dark for 1 h. Excess inhibitor was eliminated by dialysis vs. 200 volumes of 0.1 M Hepes-NaOH, pH 7.4. The extent of modification by FITC or PITC was assayed by comparing A280 and A495, respectively, before and after MIF modification, and also by measuring its activity in reaction with HPP [7]. The MIF–CP complex was prepared by mixing 4 mg of modified MIF with 44 mg of CP and concentrating the mixture in a Vivaspin 20 centrifuge cell (MM > 10 kDa retained) to 0.5 ml in buffer A. The samples were subjected to gel filtration on a Sephacryl S-200 HR column (114 × 1.5 cm) equilibrated with buffer A at 0.2 ml/min. The column was calibrated in advance with protein molecular weight standards from Sigma-Aldrich (USA). The complex was stored at 277 K for several days.
SAXS experiments. The measurements were performed with an AMUR_K laboratory diffractometer (Special Design Bureau of the Institute of Crystallography, Russia) and a HECUS System-3 laboratory diffractometer (PoliMaT, Austria) at fixed radiation wavelength λ (CuKα) = 0.154 nm to study solutions of CP, MIF, and CP–MIF complex. Gel filtration of CP–MIF was performed just before the SAXS experiment. For SAXS, the fractions of eluate with MIF–CP complex were pooled and concentrated to 10 mg/ml. The experimental scattering curves were measured within the range of momentum transfer 0.2 < s < 3 nm–1 (AMUR_K) and 0.2 < s < 2.5 nm–1 (HECUS). The data were normalized to the incident beam intensity, and then the data were corrected for collimation distortions on the height of the X-ray beam (8 mm for AMUR_K and 15 mm for HECUS). Further data processing was performed using programs from the ASTAS package [9]. Background averaging and subtraction was performed using the PRIMUS program. The radius of gyration Rg and maximum size of the solute Dmax were evaluated using distance distribution function p(r) with the GNOM program by indirect Fourier transform. The molecular masses (MM) of the solutes were evaluated from the excluded (Porod) volume VP. An ab initio model of CP–MIF–PITC complex that highlights the positions of individual components was generated by the multiphase beads modeling program MONSA. The scattering from the atomic models was calculated using the CRYSOL program considering the total excluded volume of solvent and the contrast of the hydration shell surrounding the particle.
Crystallization and X-ray analysis. MIF–PITC and MIF–FITC were crystallized by the vapor diffusion method using a hanging drop from 1.9 M ammonium sulfate and 0.1 M Hepes, pH 7.4. The protein concentration was 10 mg/ml. Crystals grew within 3-6 days. Data collection was performed at EMBL beamline P14 Petra III (Hamburg, Germany) using the PILATUS 6M (Dectris, Switzerland) detector. Data were collected at 100 K; 25% glycerol was used for cryoprotection. The diffraction data sets were processed using XDS [10] and SCALA [11]. Data sets from MIF–PITC and MIF–FITC were collected to 1.42 and 1.41 Å, respectively. The structures were solved by molecular replacement with the MOLREP program [12] using PDB code 1l5v as a starting model. The structures were refined using programs Refmac [13] and Coot [14].
RESULTS
Analysis of CP interaction with MIF–PITC and MIF–FITC using gel filtration. To simulate the presence of a substrate in the active center of MIF we prepared two species in which isothiocyanates irreversibly modified the N-terminal proline of MIF. Comparing A280 of MIF before and after modification with PITC and A495 of MIF before and after modification with FITC provided convincing evidence of covalent binding of 1 mole of inhibitor per mole of monomer in trimeric MIF. Upon modification, both forms of MIF showed less than 0.5% of their initial activity with respect to HPP. Subsequent gel filtration of the mixture CP–MIF–PITC in the presence of 50 μM CuSO4 resulted in co-elution of the proteins. The molecular mass of the CP–MIF–PITC complex corresponded to 450 kDa according the calibration curve (Fig. 1a). This value suggests that three molecules of CP were interacting with PITC-modified trimeric MIF. The profile of elution of the CP–MIF–FITC mixture from the same column contained peaks corresponding to the elution volume of the control CP (132 kDa) and trimer of MIF (36 kDa) (Fig. 1a). The same result was obtained for a mixture of non-modified MIF and CP (data not shown).
Fig. 1. Studies of CP–MIF complex by gel filtration and SAXS. a) Elution profiles of the CP–MIF–PITC and CP–MIF–FITC mixtures. b) SAXS curves. Experimental data for CP (1), MIF (2), and CP–MIF–PITC (3) are shown by dark-gray dots (errors are light-gray), approximations from the ab initio model are shown by solid red lines, approximations by atomic models of the individual proteins and by a docking model of the complex use blue dashed lines. c) Structural models of the CP–MIF–PITC complex. The ab initio reconstruction is shown by the balls; the docking-derived model is presented as carbon backbone. CP is drawn in blue, MIF is in red.
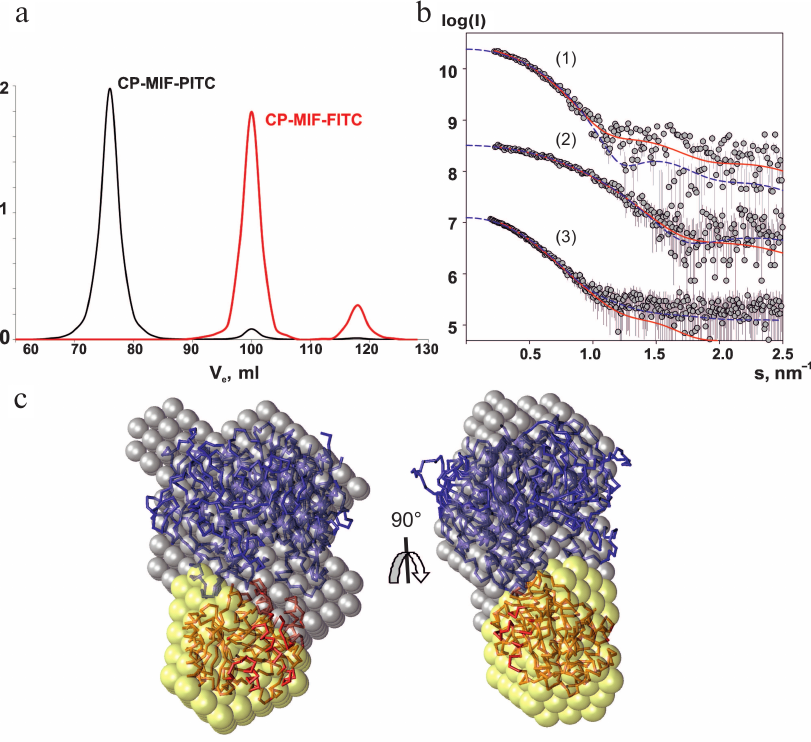
SAXS and modeling. The experimental SAXS profiles from CP, MIF, and CP–MIF–PITC complex are presented in Fig. 1b, and the corresponding overall parameters are summarized in Table 1. Comparison of the structural parameters of the individual proteins and of the CP–MIF–PITC sample suggests that CP is monomeric, MIF is trimeric, and that a 1 : 1 complex is formed between the CP monomer and the MIF trimer. The ab initio reconstruction was performed with simultaneous fitting of the three scattering profiles. Based on the expected molecular masses of the individual components of the complex, the ratio between the phase volumes of 1 : 0.35 (CP/MIF) was used as a restraint as well as the experimental Rg values of the free proteins. All three experimental data sets were well fitted (Fig. 1b and Table 1), and the typical resulting model highlighting the relative positions of the two components within the complex is presented in Fig. 1c. The available atomic models of CP (PDB ID: 4enz) and trimeric MIF (PDB ID: 1l5v) were also utilized to directly compute the fit to the respective experimental SAXS curves. The resulting fits were rather reasonable (Fig. 1b and Table 1), confirming structural similarities in the crystal and solution. Further, these models were employed to build a tentative complex by docking (using the ClusPro 2.0 server). The resulting docking-derived model (Fig. 2a) agrees well with the one reconstructed ab initio (Fig. 1c) and also provides a good fit to the experimental scattering data from CP–MIF–PITC (Fig. 1b and Table 1). Model has been deposited on the small-angle scattering biological data bank (SASBDB) under code SASDDF3.
Table 1. Structural parameters obtained by
SAXS
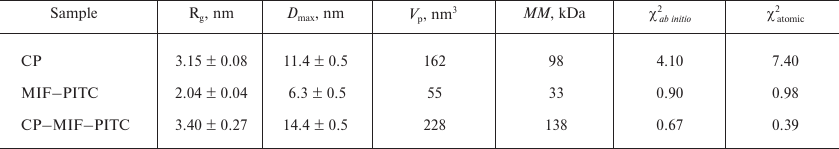
Note: χ2, discrepancy between the experimental data and
the curves calculated based on the model.
X-ray structural analysis of MIF–PITC and MIF–FITC. Attempts to crystallize the MIF–CP complex were unsuccessful; hence, X-ray analysis of two MIF modifications was used to investigate the reason for the absence of interaction between FITC-modified MIF and CP. Data collection and refinement statistics are summarized in Table 2. Both structures, i.e. MIF–FITC and MIF–PITC, are crystallized in space group P212121 and contain a trimer in the asymmetric unit. In general, the overall structure of MIF–PITC and MIF–FITC is very similar to overall structure of MIF with glycerol (PDB ID: 1l5v). Superposition of the structures gives rmsd (root-mean-square deviation) of 0.28 Å (for MIF–FITC) and 0.26 Å (for MIF–PITC) for Cα-atoms. The analysis of refined structures showed that each molecule contains one inhibitor molecule covalently bound to the N-terminal Pro residue. In the case of MIF–PITC, the inhibitor is located deep inside the active center (Fig. 2b). The size of FITC is so large that in the case of MIF–FITC part of the inhibitor goes beyond the active center and stands above the surface of the molecule (Fig. 2b).
Table 2. Data collection and refinement
statistics of MIF structures
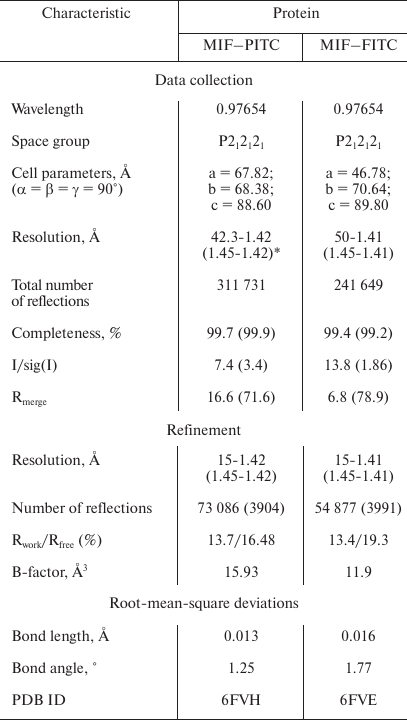
* Values in parentheses are for the highest resolution shell.
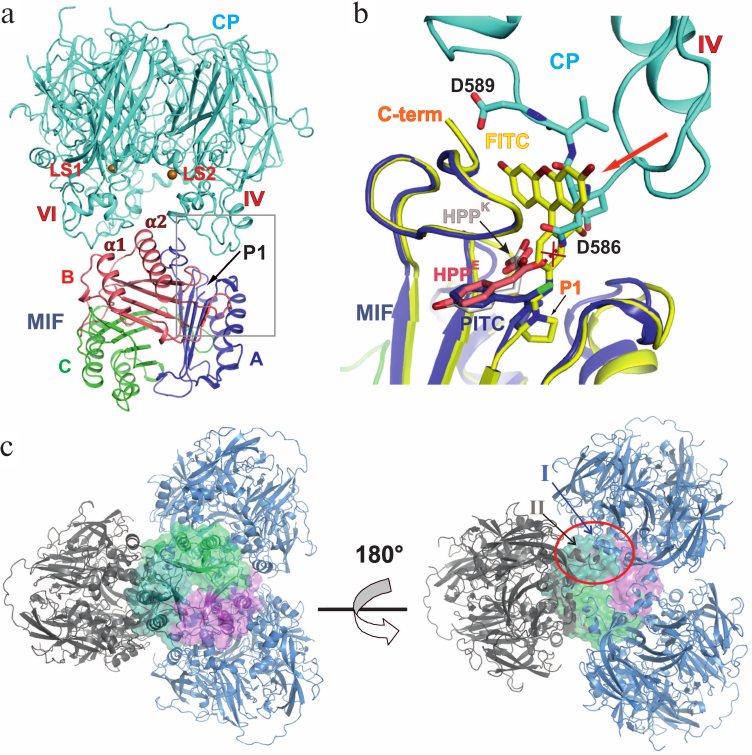
Fig. 2. Interaction of CP and MIF within the complex. a) Secondary structure of the complex. Copper ions in labile sites (designated as LS1 and LS2) of CP are shown as orange spheres. Domains containing labile sites are indicated by roman numerals. The N-terminal proline residue is indicated by P1. b) Interaction area in domain IV of CP with subunit A of MIF. Superposition of crystal structures of MIF–FITC and MIF–PITC on subunit A of the complex. MIF of the complex is not shown. Enol form of HPP in the structure of MIF (PDB: 3ijj) is shown in pink, keto form is shown in light-grey. The protein of HPP (3ijj) structure is not shown. Repulsing of CP and HPP keto form bound to MIF is shown by crossed out red dash line. MIF–FITC is shown in yellow, MIF–PITC in blue. c) Theoretical model of MIF–CP with 1 : 1 stoichiometry. CP is presented as a cartoon; trimeric MIF is shown as a cartoon and surface. The CP molecule in the SAXS model is shown in dark gray. CP molecules derived by multiplication of the SAXS model around the 3-fold axis are shown in blue. The contact CP–CP is encircled by a red oval. CP domains involved in intermolecular contacts are designated with Roman numerals.
DISCUSSION
Protein–protein interactions are fundamental for a living cell. Although X-ray diffraction analysis has been used to solve many structures of large protein–protein complexes, the application of this method is limited to stable, well-structured protein complexes with high affinity of their components. However, weaker protein–protein interactions resulting in formation of transient complexes also play a role of importance in various biological processes, such as signal transduction, posttranslational modifications, cellular transport, catalysis, and regulation of transcription and translation [15]. Moderate affinity of CP to MIF did not allow obtaining a crystal structure of the complex, e.g. the KD of interaction between CP and PMSF-modified MIF was evaluated as 4.2 μM. However, combining of several methods resulted in a three-dimensional model of MIF–CP. According to SAXS, one CP molecule binds to the trimeric MIF. Analysis of the MIF–CP model revealed contact regions localized in domains IV and VI of CP, which contain the sites of labile copper binding (Fig. 2a). It was shown previously that copper binding in these sites changes the conformation of some amino acid residues of CP [16]. This may be an explanation of why filling the labile sites with copper ions is needed for the formation of the MIF–CP complex. The stretch of amino acids 580-593 in domain IV verges upon the entrance to the active center of MIF and interacts with the C-terminal region of subunit A in MIF (Fig. 2b). The stretch 922-933 in domain VI of CP interacts with the end of α-helix 1 and with the beginning of α-helix 2 in subunit B of MIF (Fig. 2a). Superposition of crystal structures of MIF–PITC and MIF–FITC based on Cα-atoms (using the Coot program) using the MIF models of the complex (Fig. 2b) supports the reliability of the SAXS-derived model, in which domain IV of CP interacts with the active center of MIF. In the MIF–FITC structure the molecule of FITC, protruding beyond the surface of the MIF molecule, comes into steric conflict with amino acids of CP (Fig. 2b). This is in line with previous biochemical data on inhibitory effect of CP on MIF and coincides with the results of CP–MIF–FITC gel filtration, when CP and MIF–FITC were eluted separately in elution volumes corresponding to the MM of CP and the trimeric MIF, while the peak fitting a larger molecular mass was absent.
Studying the enzymatic activity of MIF in the reaction with HPP in the presence of CP showed that MIF is virtually completely inhibited in noncompetitive mode with Ki ca. 37 nM [7]. This means that monomeric CP must bind to all the three active centers of the MIF oligomer. In our complex, one molecule of CP binds to trimeric MIF, which can be explained by instability of the complex. It cannot be excluded that MIF–PITC as a ligand of CP is not as efficient as MIF with the substrate. For example, when MIF was modified by PMSF, it bound to CP with dissociation constant 4.2 μM, which is much higher than 37 nM obtained while studying the kinetics of inhibition of HPP–MIF complex by CP [7]. We used the Coot program to model the CP molecule with P3 symmetry, which allowed modeling a CP–MIF complex with 1 : 1 stoichiometry, i.e. each subunit of MIF interacts with a CP monomer. In this case, the three CP monomers do not overlap. Domain I of one CP monomer is likely to interact with domain II of another CP molecule (Fig. 2c, right panel). This model is in good agreement with biochemical data about effective inhibition HPP-tautomerase activity of MIF by CP with labile sites filled by copper ions [7]. It cannot be excluded that in vivo CP binds not to every subunit of MIF, and that the complex persists in various stoichiometries. The low resolution of the PITC–MIF–CP model does not reveal a detailed mechanism of MIF inhibition by CP. However, considering the close location of the interaction site of the two proteins to the entrance into the active center of MIF, it cannot be excluded that in complex with MIF, CP interacts with the keto-from of substrate. This notion is supported by the results of Cα-atoms superposition of MIF structure (code PDB 3ijj) with an enol and keto forms of HPP, the substrate, to the model of the complex (Fig. 2b). The enol form of HPP can be sterically unfavorable for binding to MIF in the MIF–CP complex due to close distances from atoms of the enol form to CP (Fig. 2b).
Thus, the conclusion about an interaction of CP near the MIF active site was based on studies of interactions of CP with different species of MIF by gel filtration and SAXS, matching with data of MIF–PITC and MIF–FITC X-ray analysis. A structural basis of the mechanism of inhibition of the HPP-tautomerase activity of MIF by CP was proposed. Comparison of the results of inhibition by CP of tautomerase activity of MIF, gel filtration experiments, and the theoretical model of the complex suggests that each of the three active centers of the MIF trimer interacts with one molecule of CP. However, the model of the complex obtained by SAXS shows stoichiometry 1 CP/MIF trimer. The discrepancy in stoichiometry defined by different methods can be explained by instability of the complex between CP and modified MIF.
Acknowledgments
The plasmid for expression of recombinant MIF was a generous gift of O. Yu. Tretyakov.
This work was partly supported by the Federal Agency of Scientific Organizations and Russian Foundation for Basic Research (grants No. 15-54-74006, 16-04-01182). Measurements of SAXS curves were performed using equipment of the Center for Collective Usage of FSRC “Crystallography and Photonics”, Russian Academy of Sciences, with the financial support of the Ministry of Education and Science of the Russian Federation. CP was purified with financial support from the Russian Science Foundation (grant No. 17-75-30064).
REFERENCES
1.Calandra, T., and Roger, T. (2003) Macrophage
migration inhibitory factor: a regulator of innate immunity, Nat.
Rev. Immunol., 3, 791-800.
2.Bloom, J., Sun, S., and Al-Abed, Y. (2016) MIF, a
controversial cytokine: a review of structural features, challenges,
and opportunities for drug development, Expert Opin. Ther.
Targets, 20, 1463-1475.
3.Xu, L., Li, Y., Sun, H., Zhen, X., Qiao, C., Tian,
S., and Hou, T. (2013) Current developments of macrophage migration
inhibitory factor (MIF) inhibitors, Drug Discov. Today,
18, 592-600.
4.Pantouris, G., Syed, M. A., Fan, C., Rajasekaran,
D., Cho, T. Y., Rosenberg, E. M., Bucala, R., Bhandari, V., and Lolis,
E. J. (2015) An analysis of MIF structural features that control
functional activation of CD74, Chem. Biol., 22,
1197-1205.
5.O’Reilly, C., Doroudian, M., Mawhinney, L.,
and Donnelly, S. C. (2016) Targeting MIF in cancer: therapeutic
strategies, current developments, and future opportunities, Med.
Res. Rev., 36, 440-460.
6.Meyer-Siegler, K. L., Iczkowski, K. A., and Vera,
P. L (2006) Macrophage migration inhibitory factor is increased in the
urine of patients with urinary tract infection: macrophage migration
inhibitory factor–protein complexes in human urine, J.
Urol., 175, 1523-1528.
7.Kostevich, V. A., Sokolov, A. V., Grudinina, N. A.,
Zakharova, E. T., Samygina, V. R., and Vasilyev, V. B. (2015)
Interaction of macrophage migration inhibitory factor with
ceruloplasmin: role of labile copper ions, Biometals, 28,
817-826.
8.Sokolov, A. V., Kostevich, V. A., Romanico, D. N.,
Zakharova, E. T., and Vasilyev, V. B. (2012) Two-stage method for
purification of ceruloplasmin based on its interaction with neomycin,
Biochemistry (Moscow), 77, 631-638.
9.Petoukhov, M. V., Konarev, P. V., Kikhney, A. G.,
and Svergun, D. I. (2007) ATSAS 2.1 – towards automated and
web-supported small-angle scattering data analysis, J. Appl.
Crystallogr., 40, S223-S228.
10.Kobsh, W. (2010) XDS, Acta Cryst.,
D66, 125-132.
11.Evans, P. R. (2006) Scaling and assessment of
data quality, Acta Cryst., D62, 72-82.
12.Vagin, A. A., and Teplyakov, A. (1997) MOLREP: an
automated program for molecular replacement, J. Appl.
Crystallogr., 30, 1022-1025.
13.Murshudov, G. N., Vagin, A. A., and Dodson, E. J.
(1997) Refinement of macromolecular structures by the
maximum-likelihood method, Acta Cryst., D53, 240-255.
14.Emsley, P., Lohkamp, B., Scott, W. G., and
Cowtan, K. (2010) Features and development of coot, Acta Cryst.,
D66, 486-501.
15.Sara, T., Schwarz, T. C., Kurzbach, D.,
Wunderlich, C. H., Kreutz, C., and Konrat, R. (2014) Magnetic resonance
access to transiently formed protein complexes, Chem. Open,
3, 115-123.
16.Samygina, V. R., Sokolov, A. V., Pulina, M. O.,
Bartunik, H. D., and Vasil’ev, V. B. (2008) X-ray diffraction
study of highly purified human ceruloplasmin, Crystallogr. Rep.,
53, 655-662.