Glutathionylation of Na,K-ATPase Alpha-Subunit Alters Enzyme Conformation and Sensitivity to Trypsinolysis
E. A. Dergousova1,2, Y. M. Poluektov1, E. A. Klimanova1,2, I. Y. Petrushanko1, V. A. Mitkevich1, A. A. Makarov1, and O. D. Lopina1,2,a*
1Engelhardt Institute of Molecular Biology, Russian Academy of Sciences, 119991 Moscow, Russia2Lomonosov Moscow State University, Faculty of Biology, 119234 Moscow, Russia
* To whom correspondence should be addressed.
Received December 9, 2017; Revision received April 13, 2018
We found earlier that Na,K-ATPase is purified from duck salt glands in partially glutathionylated state (up to 13 of the 23 cysteine residues of the Na,K-ATPase catalytic α-subunit can be S-glutathionylated). To determine the effect of glutathionylation on the enzyme conformation, we have analyzed the products of trypsinolysis of Na,K-ATPase α-subunit in different conformations with different extent of glutathionylation. Incubation of the protein in the E1 conformation with trypsin produced a large fragment with a molecular mass (MM) of 80 kDa with the following formation of smaller fragments with MM 40, 35.5, and 23 kDa. Tryptic digestion of Na,K-ATPase in the E2 conformation also resulted in the generation of the fragments with MM 40, 35.5, and 23 kDa. Deglutathionylation of Na,K-ATPase α-subunit increases the rate of proteolysis of the enzyme in both E1 and E2 conformations. The pattern of tryptic digestion of the α-subunit in E2 conformation additionally glutathionylated with oxidized glutathione is similar to that of partially deglutathionylated Na,K-ATPase. The pattern of tryptic digestion of the additionally glutathionylated α-subunit in E1 conformation is similar to that of the native enzyme. The highest rate of trypsinolysis was observed for the α-subunit in complex with ouabain (E2-OBN conformation). Additional glutathionylation increased the content of high-molecular-weight fragments among the digestion products, as compared to the native and deglutathionylated enzymes. The data obtained were confirmed using molecular modeling that revealed that number of sites accessible for trypsinolysis is higher in the E2P-OBN conformation than in the E1- and E2-conformations and that glutathionylation decreases the number of sites accessible for trypsin. Therefore, glutathionylation affects enzyme conformation and its sensitivity to trypsinolysis. The mechanisms responsible for the changes in the Na,K-ATPase sensitivity to trypsinolysis depending on the level of enzyme glutathionylation and increase in the enzyme sensitivity to proteolysis upon its binding to ouabain, as well as physiological role of these phenomena are discussed.
KEY WORDS: Na,K-ATPase, glutathionylation, trypsinolysisDOI: 10.1134/S0006297918080084
Abbreviations: MM, molecular mass; OBN, ouabain; PMSF, phenylmethylsulfonyl fluoride; PVDF, polyvinylidene fluoride.
Na,K-ATPase (Na+/K+ pump) is a heterooligomeric
enzyme embedded into the plasma membrane. Its protomer includes at
least one catalytic (α) and one regulatory (β) subunits with
molecular masses (MM) of 100 and 55 kDa, respectively. Each subunit is
represented by several isoforms (α1-α4 and β1-β3)
that are expressed differently in different tissues. The enzyme
transports Na+ and K+ ions across the plasma
membrane against the electrochemical gradient using the energy of ATP
hydrolysis. During the catalytic cycle, Na,K-ATPase acquires two main
conformations (E1 and E2) characterized by a high affinity to
Na+ and K+, respectively. Na,K-ATPase is
inhibited by cardiotonic steroids, among which the most known is
ouabain. Ouabain (OBN) binds irreversibly to the enzyme and prevents
conformational changes required for catalysis.
We have found earlier [1] that Na,K-ATPase from duck salt glands is purified in a highly glutathionylated state: up to 13 from 23 cysteine residues of the α1-subunit contain bound glutathione (basal glutathionylation). Treatment of Na,K-ATPase with oxidized glutathione (GSSG) leads to additional glutathionylation of 4 regulatory cysteines in the α-subunit (Cys242, Cys452, Cys456, and Cys457). This results in the inhibition of the enzyme activity due to the impairments in the ATP binding to the active site [1, 2]. This so-called “regulatory” glutathionylation is reversed by the glutathione reductase/glutaredoxin coupled enzymatic system that restores the activity of Na,K-ATPase [3]. The significance of glutathionylation of the other cysteine residues still remains unclear. It was suggested that some of cysteines are glutathionylated cotranslationally (basal glutathionylation), which reflects the redox state of the cell at the moment of Na,K-ATPase α-subunit synthesis. These glutathione molecules appear to be included in the spatial structure of the enzyme [4], as even very strong reducing reagents under denaturing conditions are unable to completely remove glutathione from the α1-subunit cysteine residues [3]. We suggested that glutathionylation of some cysteine residues in the α1-subunit affects the conformation and stability of Na,K-ATPase upon the action of various factors, for example, proteolytic enzymes.
To establish how glutathionylation affects the conformation of Na,K-ATPase, we analyzed the products of trypsinolysis of α1-subunit forms in different conformations and with different extent of glutathionylation.
MATERIALS AND METHODS
Enzyme purification. Na,K-ATPase was purified as described by Smith et al. [5] from the salt glands of ducks kept on a high-salt diet. All procedures were performed at 0-4°C. Before protein purification, the glands were stored frozen at –70°C for 1-6 months. All buffer solutions contained protease inhibitors: 5 μM thiorphan (Cayman Chemical, USA) and 0.2 mM phenylmethylsulfonyl fluoride (PMSF) (Sigma, Germany).
The pellet containing purified Na,K-ATPase was resuspended in 25 mM imidazole buffer (pH 7.5) containing 1 mM EDTA and 0.25 M sucrose, aliquoted (20-50 μl) into microtubes, and stored at –70°C.
Protein concentration was measured according to the Lowry method [6]. To dissolve membrane proteins, 1% sodium deoxycholate was added to the protein preparations instead of water.
Na,K-ATPase glutathionylation was conducted by incubating purified Na,K-ATPase with 1 mM GSSG for 30 min at 37°C in 25 mM Tris-HCl buffer (pH 7.5) containing 0.25 M sucrose and 1 mM EDTA. For deglutathionylation, the enzyme was incubated with 3% NaBH4 under the same conditions.
Three types of Na,K-ATPase preparations were subjected to trypsinolysis: glutathionylated enzyme, partially deglutathionylated enzyme, and untreated control (basally glutathionylated enzyme). Proteolysis was conducted in the presence of 150 mM NaCl (conformation E1), 150 mM KCl (conformation E2), or 0.5 mM ouabain (Sigma, Italy) for 5-90 min at 37°C at a Na,K-ATPase/trypsin (PanEco, USA) ratio of 10 : 1 (w/w). The reaction was stopped by adding 2-fold excess (w/w) of soybean trypsin inhibitor.
Electrophoresis in the presence of SDS in polyacrylamide gel (SDS-PAGE) was conducted according to the method of Laemmli [7] using 6% concentrating gel and 15% separating gel. Protein samples were mixed with 4× sample buffer containing 250 mM Tris-HCl (pH 6.8), 8% SDS, 40% sucrose, and bromophenol blue and then heated for 10 min at 50°C. The gels were run at 25 mA per gel for the concentrating gel and at 50 mA per gel for the separating gel. Fractionated proteins were stained with Coomassie blue G-250.
Immunoblotting. After electrophoresis, the gels were washed for 15 min in the electrotransfer buffer (25 mM Tris-HCl, 192 mM glycine, 20% ethanol, pH 8.3) to remove SDS. Proteins were transferred on a polyvinylidene fluoride (PVDF) membrane (Millipore, Ireland) for 75 min at 250 mA (per gel) in a cooled Mini Trans-Blot Electrophoretic Transfer Cell (Bio-Rad, USA). The membranes were blocked for 1 h with the 5% fat-free milk (Valio, Finland) in PBST (10 mM KH2PO4, pH 7.4, 150 mM NaCl, 0.1% Tween 20), washed 4 times for 10 min with PBST, and incubated with antibodies against Na,K-ATPase α1-subunit (dilution 1 : 10,000, clone C464.6; Millipore, USA) or anti-glutathione antibodies (dilution 1 : 3000, clone D8; Millipore) for 15-17 h at 4°C with constant shaking. The membranes were then washed 4 times for 10 min with PBST and incubated for 1.5-2 h with secondary anti-mouse IgG antibodies conjugated with horseradish peroxidase (dilution 1 : 100,000; catalog no. AP124P, Millipore). The membranes were washed 4-5 times for 10 min with PBST, and proteins complexes with primary and secondary antibodies were visualized by the enhanced chemiluminescence (ECL) method with a Molecular Imager Gel Doc XR+ System (BioRad) using a Western Lightning Plus-ECL kit (Perkin Elmer, USA) with the SuperSignal Western Femto Maximum Sensitivity Substrate (Thermo Scientific, USA).
Analysis of trypsinolysis sites in different conformations of Na,K-ATPase. 3D structures of the pig kidney Na,K-ATPase α1-subunit in different conformations were loaded from the Protein Data Bank (rcsb.org): E1P (3WGU); E2 2Rb+ (3B8E; Rb+ is a K+ analog); E2P with ouabain (3N23). Accessibility of Arg and Lys residues (trypsin cleavage sites) was estimated using the GETAREA algorithm (http://curie.utmb.edu/cgi-bin/xgetarea.cgi) [8]. Accessibility of each Arg or Lys residue for the solvent (water molecule with a radius of 1.4 Å) was calculated. Figures with the accessible Arg and Lys residues were produced with the UCSF Chimera software [9].
The models of glutathionylated Na,K-ATPase α1-subunit were constructed with the software. The structures of the Na,K-ATPase α1-subunit were prepared with the PyMOL program (PyMOL Molecular Graphics System, version 2.0; Schrodinger, LLC); the modeling of Na,K-ATPase glutathionylated residues was done with the COOT (Crystallographic Object-Oriented Toolkit) program [10]. All cysteine residues exposed to the cytosol and accessible in each of the structures were glutathionylated. Modeling of the disulfide bonds between SH-groups of glutathione and Na,K-ATPase α-subunit and model minimization were done with the MOE 2014.0901 software (Molecular Operating Environment; Chemical Computing Group ULC, Canada). The force field developed by Engh and Huber was used for the minimization of all structures. The analyzed structures contain different numbers of amino acid residues: 3WGU includes residues 23-1016 (993 a.a.); 3B8E – residues 19-1023 (1004 a.a.); and 3N23 – residues 25-1016 (990 a.a. because residue 369 was replaced by the PHD linker). To evaluate the accessibility of trypsin cleavage sites, we analyzed the same sequence fragment (a.a. 25-1016) for all the structures.
RESULTS AND DISCUSSION
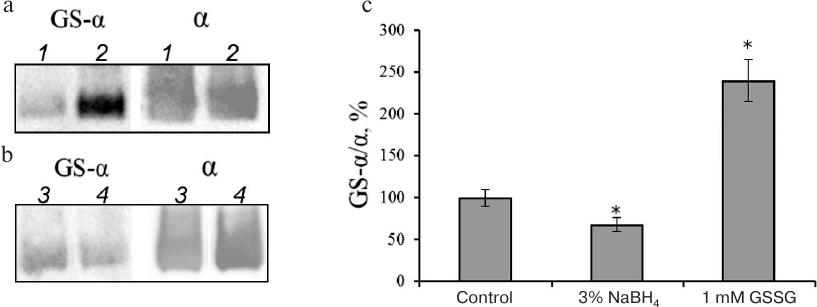
We have shown earlier that the increase in the extent of Na,K-ATPase α-subunit glutathionylation resulting from the enzyme incubation with GSSG (Fig. 1) decreases the enzyme activity [1, 11]. At the same time, treatment of Na,K-ATPase with reducing agents decreases the level of enzyme glutathionylation (the maximal ~40% effect was achieved after incubation with 3% NaBH4) (Fig. 1) and slightly increases its activity [3].
Fig. 1. Glutathionylation of Na,K-ATPase α-subunit after incubation with GSSG (a, c) and sodium borohydride (b, c). a, b) Immunoblotting with antibodies against protein-bound glutathione (GS-α) and Na,K-ATPase α1-subunit (α); a: 1) control; 2) Na,K-ATPase α-subunit incubated with 1 mM GSSG; b: 3) control; 4) Na,K-ATPase α-subunit incubated with 3% NaBH4. Incubation was performed for 30 min at 37°C in 25 mM Tris-HCl (pH 7.5) with 1 mM EDTA and 0.25 M sucrose. c) The results were normalized to the total amount of the α-subunit and shown as mean ± standard deviation from 3-4 independent experiments. Asterisk (*) indicates significant differences with the control at p < 0.05.
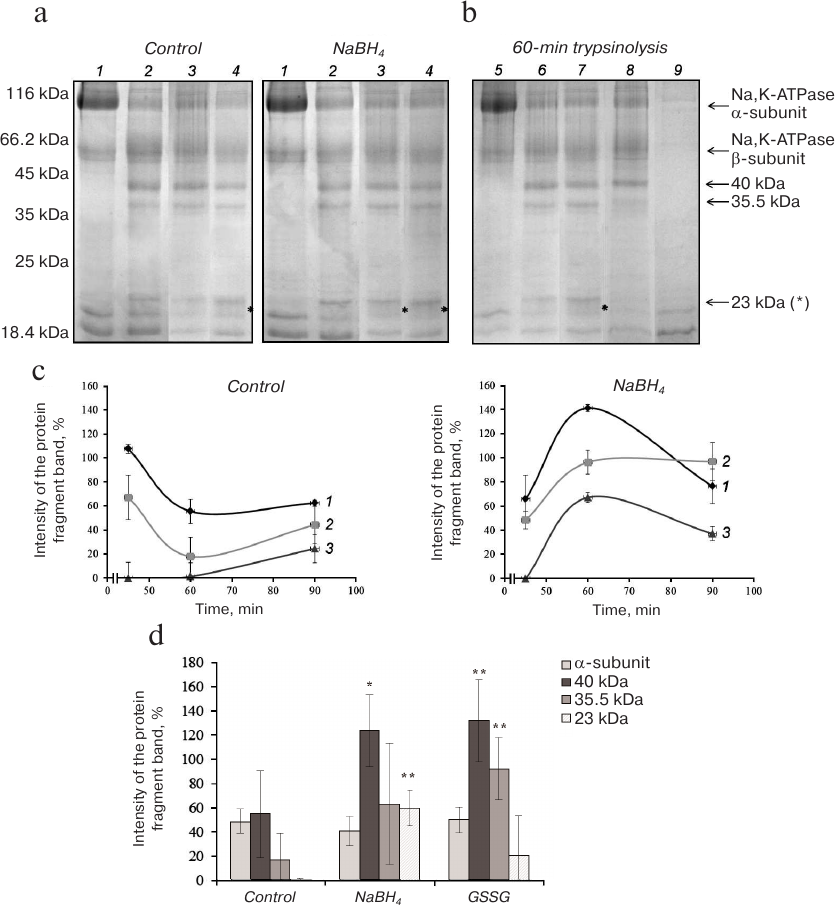
Proteolysis of Na,K-ATPase α1-subunit in the presence of KCl and NaCl (conformations E2 and E1, respectively). Electrophoresis of control (basally glutathionylated) and partially deglutathionylated (reduced with 3% NaBH4) preparations of Na,K-ATPase after their hydrolysis with trypsin for 45-90 min in the presence of KCl revealed significant decrease in the intensity of the Na,K-ATPase α1-subunit band accompanied by accumulation of low-molecular-weight products (fragments with MM ~40, 35.5, and 23 kDa) already after 45 min of trypsinolysis (Fig. 2, a and b). The difference between the control and deglutathionylated preparations was even more pronounced after 1 h of trypsin digestion (Fig. 2c). Proteolysis of deglutathionylated preparation resulted in the increase in the amount of the 40-kDa fragment and appearance of the 23-kDa fragment absent in the control preparation (Fig. 2d). Trypsinolysis of Na,K-ATPase glutathionylated with GSSG resulted in the increase in the amounts of fragments with MM of 35.5 and 40 kDa but did not lead to the statistically reliable change in the amount of the 23-kDa fragment.
Fig. 2. Trypsinolysis of Na,K-ATPase α-subunit in the presence of 150 mM KCl. a) SDS-PAGE of fragments obtained by proteolysis of basally glutathionylated (control) and deglutathionylated with 3% NaBH4 enzyme after incubation with trypsin for: 1) 0 min; 2) 45 min; 3) 60 min; 4) 90 min. b) Trypsinolysis of different Na,K-ATPase preparations for 60 min: 5) control (incubation with inhibited trypsin); 6) basally glutathionylated enzyme; 7) deglutathionylated enzyme incubated with 3% NaBH4; 8) enzyme incubated with 1 mM GSSG (glutathionylated); 9) trypsin autolysis. c) Time course of the accumulation of α-subunit trypsinolysis products obtained by digestion of basally glutathionylated and partially deglutathionylated Na,K-ATPase preparations: 1) 40 kDa; 2) 35.5 kDa; 3) 23 kDa. d) Results of trypsinolysis of partially deglutathionylated, basally glutathionylated, and additionally glutathionylated Na,K-ATPase preparations in the presence of 150 mM KCl for 60 min. The bars represent the intensity of the signal from the analyzed protein band that was calculated by the formula: (Ifragment – Ibackground)/Ibackground × 100%. Asterisk (*), significant difference with the control at p < 0.05; **, significant difference with the control at p < 0.01.
Therefore, in the presence of K+ (E2 conformation), both glutathionylation and deglutathionylation increase the accessibility to proteolysis of bonds whose hydrolysis leads to the formation of the 40-kDa fragment. Deglutathionylation also increases the accessibility of bonds that should be hydrolyzed for the formation of the 23-kDa fragment.
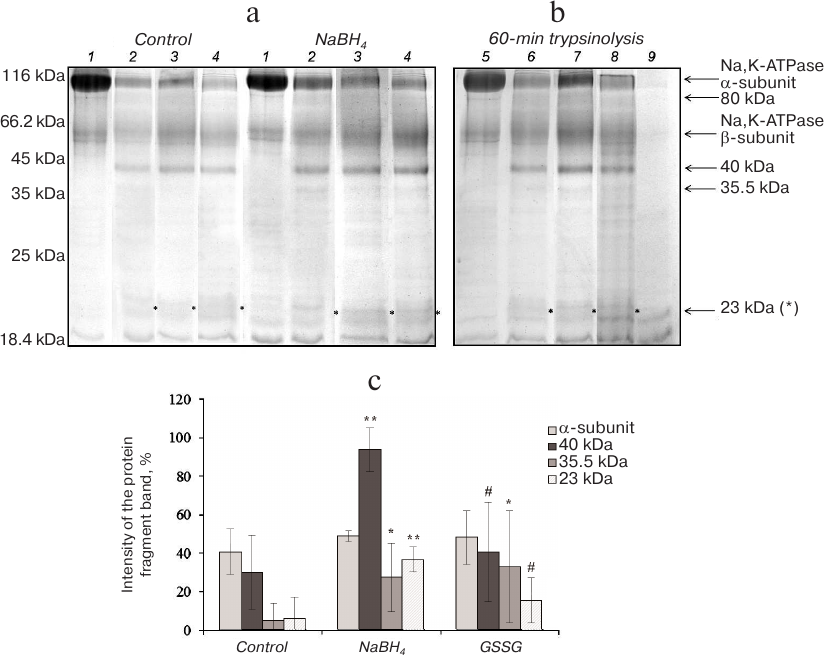
In the presence of NaCl (150 mM), Na,K-ATPase acquires the E1 conformation that has a high affinity for Na+. Incubation of Na,K-ATPase with trypsin in the presence of NaCl for 15-45 min resulted in the appearance of a low-intensity protein band with MM of 80 kDa (data not shown). According to other authors, this band is the first product of trypsinolysis of Na,K-ATPase α1-subunit in the E1 conformation [12]. Further increase in the hydrolysis time resulted in the disappearance of the 80-kDa band followed by accumulation of the 40- and 35.5-kDa fragments and appearance of the 23-kDa band (Fig. 3). It was demonstrated earlier that in the presence of NaCl, Na,K-ATPase α1-subunit is more resistant to proteolysis than in the presence of KCl [13]. The major product of α1-subunit trypsinolysis in 150 mM NaCl was the 40-kDa fragment with two minor bands of 35.5 and 23 kDa. Deglutathionylation led to a significant increase in the amounts of fragments with MM 40 and 23 kDa and also to some increase in the amount of the fragment with MM 35.5 kDa, as compared to the control (Fig. 3). An increase in the extent of protein glutathionylation produced no similar effect. The only observed difference from the control was a slight increase in the amount of the 35.5-kDa fragment (Fig. 3). Therefore, deglutathionylated Na,K-ATPase in the E1 conformation was more sensitive to trypsinolysis than the glutathionylated enzyme.
Fig. 3. Trypsinolysis of Na,K-ATPase α-subunit in the presence of 150 mM NaCl. a) SDS-PAGE of fragments obtained by proteolysis of basally glutathionylated (control) and deglutathionylated with 3% NaBH4 enzyme after incubation with trypsin for: 1) 0 min; 2) 30 min; 3) 60 min; 4) 90 min. b) Trypsinolysis of different Na,K-ATPase preparations for 60 min: 5) control; 6) basally glutathionylated enzyme; 7) deglutathionylated enzyme incubated with 3% NaBH4; 8) enzyme incubated with 1 mM GSSG (glutathionylated); 9) trypsin autolysis. c) Results of trypsinolysis of partially deglutathionylated, basally glutathionylated, and additionally glutathionylated Na,K-ATPase preparations in the presence of 150 mM NaCl for 60 min. The bars represent the intensity of the signal from the analyzed protein bands that was calculated by the formula: (Ifragment – Ibackground)/Ibackground × 100%. Asterisk (*), significant difference with the control at p < 0.05; **, significant difference with the control at p < 0.01; #, significant differences between samples incubated with GSSG and NaBH4 at p < 0.05.
Generation of secondary and tertiary tryptic fragments (MM ~ 44, 37 and 23 kDa for the E1 conformation and 42 and 38 kDa for the E2 conformation) by the cleavage of the 80-kDa fragment has been described earlier [12]. According to our data, proteolysis of Na,K-ATPase in the E1 conformation for 1 h led to the formation of tryptic fragments with MM 40, 35.5 and 23 kDa, and in the E2 conformation – fragments with MM 40 and 35.5 kDa. Because Laemmli’s electrophoresis provides only an approximate estimation of protein molecular masses, we believe that our data are in a good agreement with the results obtained earlier except the appearance of the 23-kDa fragment among the products of prolonged proteolysis of the enzyme in the E2 conformation. The difference between the sensitivity to proteolysis of the E1 and E2 conformations of Na,K-ATPase becomes evident when comparing the proteolysis products of the enzyme preparations with different extent of glutathionylation (Figs. 2 and 3). It was found earlier that for both enzyme conformations, prolonged proteolysis results in the accumulation of a tryptic fragment with MM 19-20 kDa [14]. We suggest that the 23-kDa fragment corresponds to the 19-20-kDa fragment described by other authors and includes the transmembrane fragments M7-M10 involved in the ion occlusion.
Proteolysis of Na,K-ATPase α-subunit in the presence of 0.5 mM ouabain. The cardiotonic steroid ouabain irreversibly binds to Na,K-ATPase α-subunit and induces enzyme transition to the conformation different from E1, E2, and E2P [15]. Trypsinolysis of Na,K-ATPase in the presence of 0.5 mM ouabain proceeded at higher rates than in the presence of NaCl and KCl: formation of the 23-kDa fragment was observed already after 5 min of the enzyme incubation with trypsin. After 15 min of trypsinolysis, the high-molecular-mass proteolytic fragments of 40 and 35.5 kDa disappeared almost completely (Fig. 4a). Increasing the ionic strength of the reaction mixture by adding 150 mM choline chloride slightly slowed down trypsinolysis of the Na,K-ATPase α1-subunit, but the reaction rate still remained significantly higher than in the presence of Na+ and K+ (data not shown).
Fig. 4. Trypsinolysis of Na,K-ATPase α-subunit in the presence of 0.5 mM ouabain. a) SDS-PAGE of fragments obtained by proteolysis of basally glutathionylated (control) and deglutathionylated with 3% NaBH4 enzyme after incubation with trypsin for: 1) 0 min; 2) 5 min; 3) 10 min; 4) 15 min.
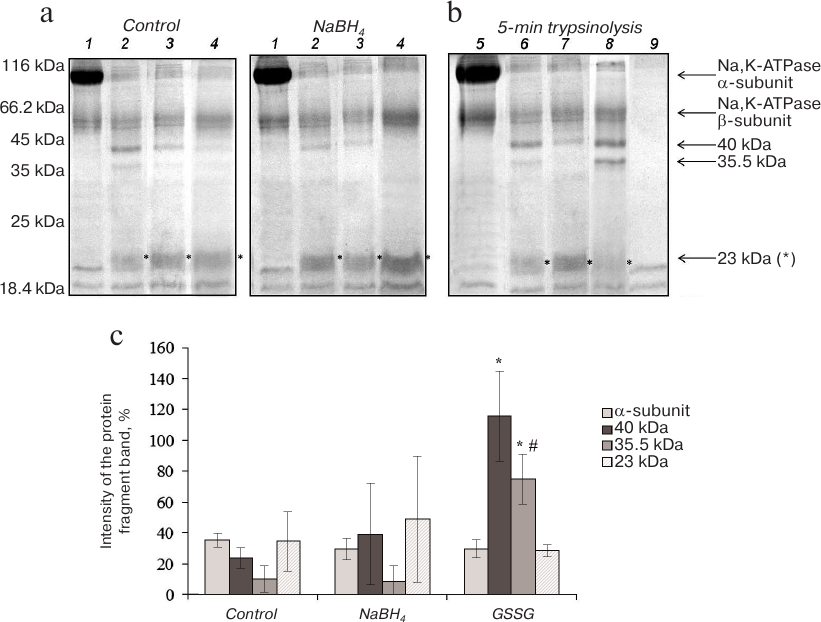
b) Trypsinolysis of different Na,K-ATPase preparations for 5 min: 5) control; 6) basally glutathionylated enzyme; 7) deglutathionylated enzyme incubated with 3% NaBH4; 8) enzyme incubated with 1 mM GSSG (glutathionylated); 9) trypsin autolysis. c) Results of trypsinolysis of partially deglutathionylated, basally glutathionylated, and additionally glutathionylated Na,K-ATPase preparations in the presence of 0.5 mM ouabain for 5 min. The bars represent the intensity of the signal from the analyzed protein bands that was calculated by the formula: (Ifragment – Ibackground)/Ibackground × 100%. Asterisk (*), significant difference with the control at p < 0.05; #, significant differences between samples incubated with GSSG and NaBH4 at p < 0.05.
Deglutathionylation did not alter the character of trypsinolysis of the Na,K-ATPase/ouabain complex, while glutathionylation significantly increased the amounts of the 40- and 35.5-kDa fragments (Fig. 4). As judged from its delayed accumulation, the 23-kDa fragment together with low-molecular-weight peptides are the final products of trypsinolysis of higher-molecular-weight fragments. Taking into account the facts that trypsinolysis of the α-subunit in the presence of ouabain is very fast and that the decrease in the amounts of the 40- and 35.5-kDa fragments is accompanied with the accumulation of the 23-kDa fragment, we suggested that additional glutathionylation slows down proteolysis of the 40- and 35.5-kDa fragments.
Comparison of the results of enzyme trypsinolysis in the presence of 150 mM KCl (E2 conformation) and ouabain (conformation E2-OBN) confirms that conformations E2 and E2-OBN are very different. Because proteolysis of the E2-ouabain complex occurs at a much higher rate, we concluded that ouabain binding to Na,K-ATPase leads to a significant increase in the accessibility of the enzyme polypeptide chain to trypsin.
It is known that in some tissues, ouabain binding to Na,K-ATPase initiates cell signaling cascades not only via Na,K-ATPase inhibition but also by changing its conformation, which in turn results in the binding of some proteins to the enzyme and induces cell signaling [15, 16]. It is reasonable to suggest that proteolysis of the enzyme complex with ouabain might result in the interruption of signaling initiated by Na,K-ATPase. Our results demonstrate that ouabain binding to Na,K-ATPase significantly increases the rate of enzyme trypsinolysis. Although trypsin is absent in the cells of vertebrates, there are other serine proteases that have similar to trypsin specificity, for example, cathepsin B. This suggest that after transferring the signal, Na,K-ATPase becomes very sensitive to proteolysis via ouabain binding.
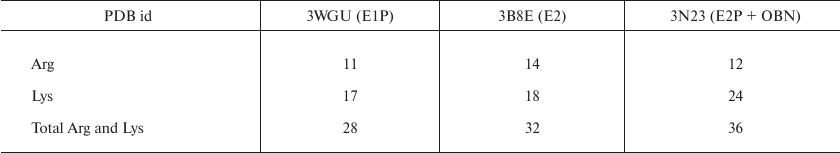
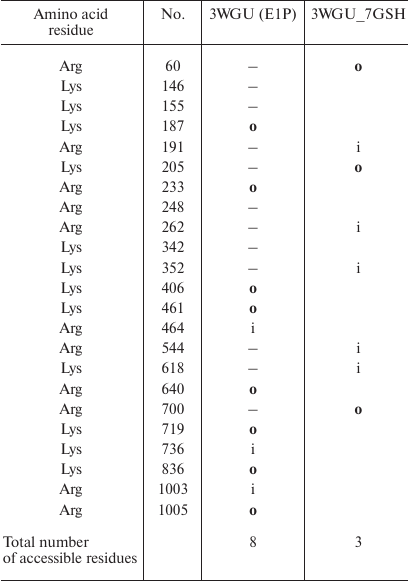
Identification of trypsin cleavage sites in different conformations of Na,K-ATPase α-subunit. The 3D structures of Na,K-ATPase in the E2P-OBN, E2P, E2, and E1P conformations have been resolved by now. Because our experiments were conducted with the enzymes in E1, E2, and E2-OBN conformations, we created the model of Na,K-ATPase α-subunit based on the three existing structures: 3WGU_pig_E1P, 3B8E_pig_E2+2Rb, 3N23_pig_E2P+OBN. We then identified potential sites of trypsinolysis in the α-subunit in these three conformations. Overlapping of the identified sites with the 3D structure of Na,K-ATPase allowed us to reveal the regions accessible for trypsin in each of the investigated structures. We found that each conformation is characterized by its own set of trypsin-accessible sites. Fifteen of these sites were common for all three conformations (Table 1). In total, we identified 28 sites accessible for trypsin in the E1P conformation (3WGU), 32 sites in the E2 conformation (3B8E), and 36 in the E2P-OBN conformation (3N23). Consequently, the number of peptides generated by trypsin digestion should be different for each of the Na,K-ATPase conformation (the list of possible minimal peptides is shown in Table S1; see Supplement to this paper on the Biochemistry (Moscow) website http://protein.bio.msu.ru/biokhimiya or Springer website Link.springer.com). The greatest number of sites accessible for trypsin was found in the E2P-OBN conformation (Table 2), which correlates with our data demonstrating that the maximal rate of proteolysis is observed in the presence of ouabain, because ouabain binding to Na,K-ATPase results in the enzyme transition to the E2P-like conformation.
Table 1. Amino acid residues accessible for
trypsinolysis in three Na,K-ATPase conformations (E1P, E2, E2P+OBN).
The residues common for all three conformations are bolded
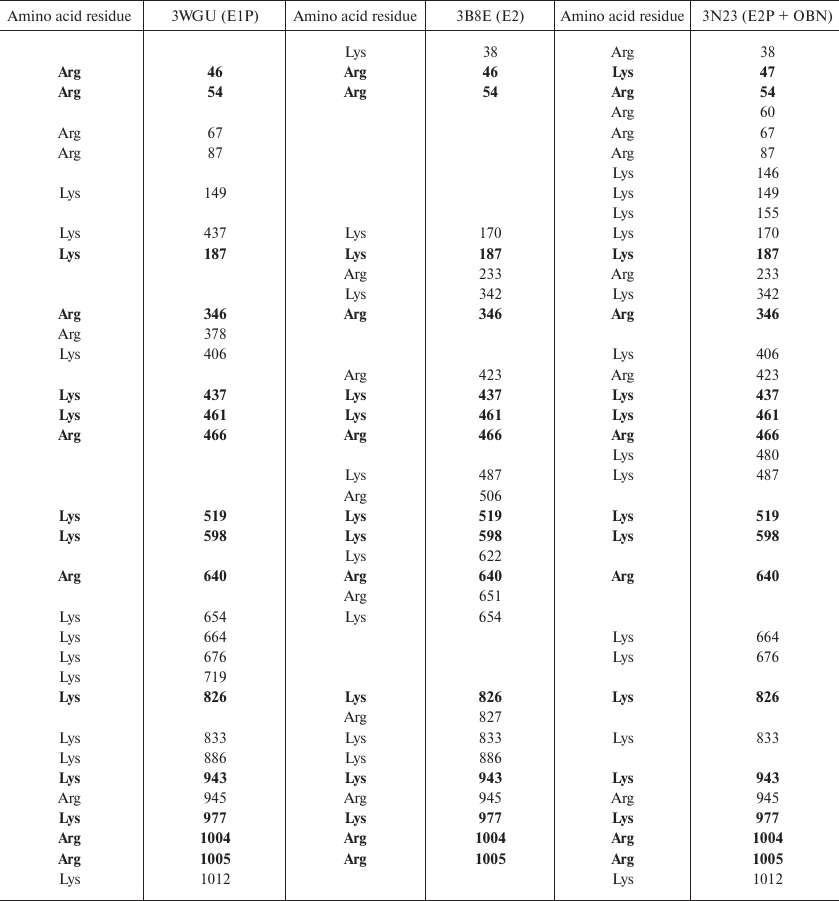
Table 2. The number of amino acid residues
accessible for trypsin in different Na,K-ATPase structures
Effect of glutathionylation of Na,K-ATPase α-subunit on the accessibility of sites for trypsin. For each of the conformations, we used the 3D structures to mark down the sites of glutathionylation located in close proximity to the sites accessible to trypsin (Table 3). As seen from Table 3, cysteine residues that can be glutathionylated are located close only to Arg346, Arg347, and Lys654 residues that are accessible for trypsin in all the three conformations. Since it has been demonstrated that glutathionylation affects the accessibility of the enzyme polypeptide chain for trypsin, we concluded that glutathionylation by itself can affect the conformation of Na,K-ATPase. We created the models of the enzyme in three conformations (Figs. 5-7). For this purpose, glutathione was bound to the accessible cysteine residues (Cys138, 336, 452, 456, 511, 656, and 698) that could be glutathionylated (as it was shown by us earlier in [1, 3]). The models were then minimized. The results of the analysis of the effects of glutathionylation on the accessibility of the enzyme sites for trypsin in different enzyme conformations are presented in Tables 4-6 (only residues whose accessibility was alter by glutathionylation are shown). We found that glutathionylation decreases the number of the accessible sites in the conformation E1P two times (Table 4), which correlates well with our experimental data (Fig. 3) that deglutathionylation results in the acceleration of proteolysis.
Table 3. Cysteine residues that can be
glutathionylated and are located in close vicinity to Arg346, Arg347,
and Lys654. Residues inaccessible for trypsinolysis are colored red,
accessible residues are colored blue, residues with disputable
accessibility are bolded (interpreted as inaccessible)
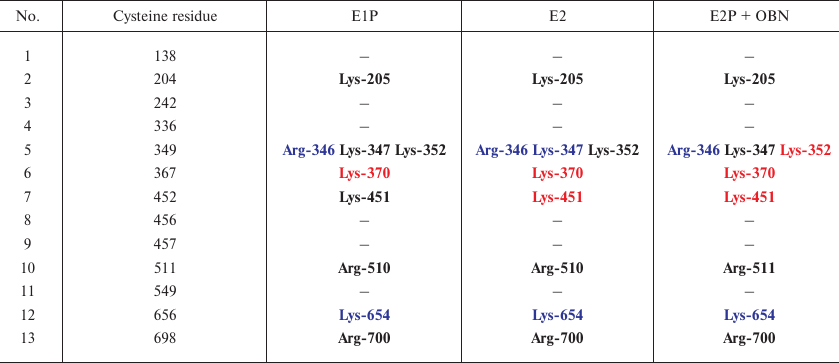
Fig. 5. Structure 3WGU (E1P conformation). Lys and Arg residues accessible for trypsin and Cys residues which may affect the accessibility of trypsinolysis sites from the front (a) and behind (b).
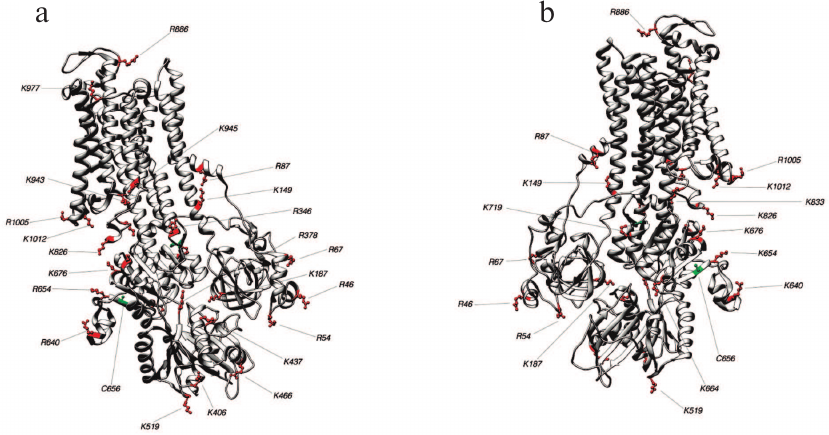
Fig. 6. Structure 3B8E (E2-like conformation). Lys and Arg residues accessible for trypsin and Cys residues which may affect the accessibility of trypsinolysis sites from the front (a) and behind (b).

Fig. 7. Structure 3N23 (E2P+OBN conformation). Lys and Arg residues accessible for trypsin and Cys residues which may affect the accessibility of trypsinolysis sites from the front (a) and behind (b).
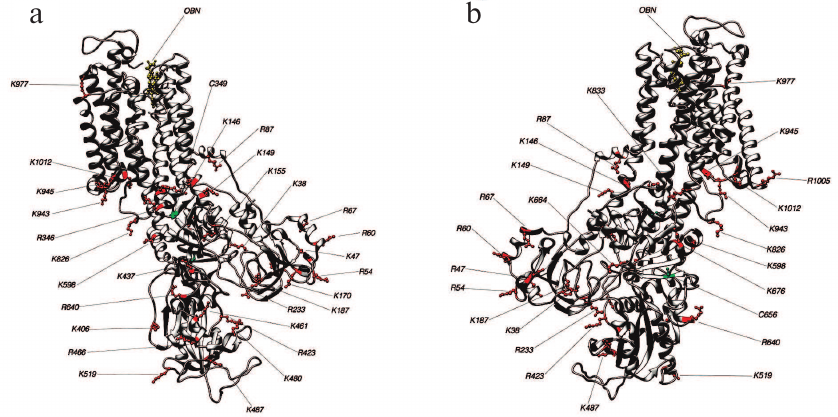
Table 4. Comparison of the original
Na,K-ATPase 3WGU structure (E1P) and its glutathionylated model
(3WGU_7GSH). Only residues whose accessibility changes following enzyme
modification are shown. Accessible residues are indicated with
“o” (out); inaccessible residues are indicated with
“i” (in); residues with disputable accessibility are not
marked
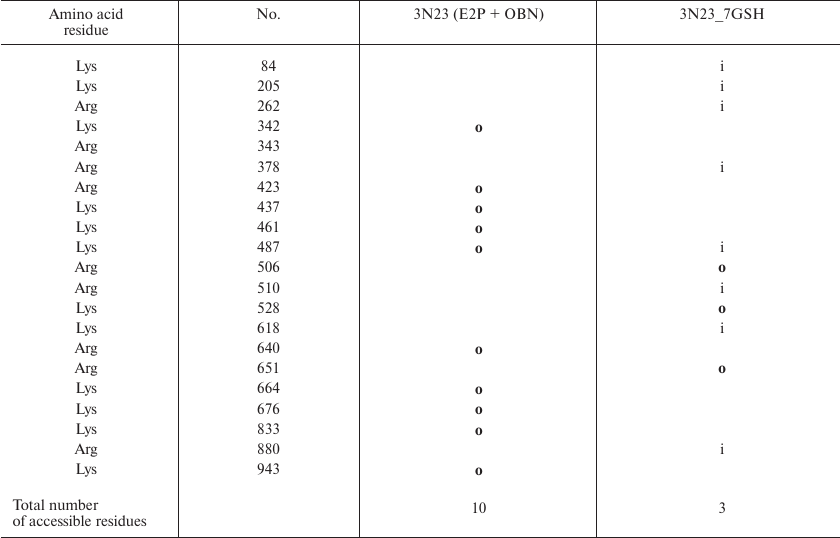
Comparison of the sites accessible for trypsinolysis in the E2 conformation before and after enzyme glutathionylation revealed that glutathionylation did not affect the number of such sites (Table 5). This is in a good agreement with our experiment results (Fig. 2) that proteolysis of deglutathionylated and glutathionylated enzyme preparations occurs at the same rate. At the same time, glutathionylation of the enzyme in the E2P-OBN conformation should decrease the number of accessible sites more than two times (Table 6), which correlated with our observation that additional glutathionylation decreases the rate of proteolysis of Na,K-ATPase in this conformation (Fig. 4).
Table 5. Comparison of the original
Na,K-ATPase 3B8E structure (E2) and its glutathionylated model
(3B8E_7GSH). Only residues whose accessibility changes following enzyme
modification are shown. Accessible residues are indicated with
“o” (out); inaccessible residues are indicated with
“i” (in); residues with disputable accessibility are not
marked
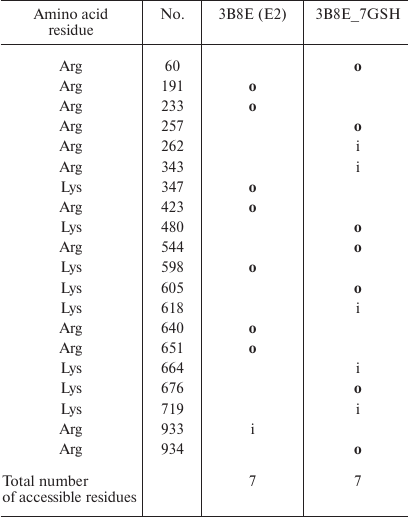
Table 6. Comparison of the original
Na,K-ATPase 3N23 structure (E2P+OBN) and its glutathionylated model
(3N23_7GSH). Only residues whose accessibility changes following enzyme
modification are shown. Accessible residues are indicated with
“o” (out); inaccessible residues are indicated with
“i” (in); residues with disputable accessibility are not
marked
Because Na,K-ATPase α-subunit contains numerous cysteine residues that can be glutathionylated (up to 13 out of 15 Cys residues in the purified enzyme are exposed to the cytosol and can bind glutathione), a question arises on the role of glutathionylation in the enzyme function. Additional glutathionylation of four cysteine residues (Cys242, Cys452, Cys456, and Cys457) with GSSG leads to the suppression of the enzyme activity and may play the regulatory role [1, 2]. Inhibition induced by glutathionylation of these cysteine residues might result from the oxidative stress, when the concentration of GSSG rises significantly. Glutathionylation can be then reversed after the cell returns to a normal redox state via activity of the coupled glutathione reductase/glutaredoxin enzymes, as we have shown earlier in vitro [3]. Reversible glutathionylation may have an important role under physiological conditions. Thus, glutathionylation of regulatory cysteine residues during oxidative stress prevents their irreversible oxidation and simultaneously decreases ATP utilization by Na,K-ATPase that can be significantly high in some tissues (e.g., in the brain).
We have shown that some glutathione molecules cannot be removed from cysteine residues of Na,K-ATPase α1-subunit even with very strong reducing agents [3]. It is assumed that these glutathione molecules modify cysteine residues of the α-subunit during the its synthesis and got incorporated into its tertiary structure, thereby becoming inaccessible for the reducing agents. Mitkevich et al. analyzed the crystal structures of Na,K-ATPase and found that the SH groups of pairs of cysteine residues Cys206–Cys244, Cys369–Cys700, and Cys454–Cys458 are oriented into the isolated cavities containing unresolved electron density [4]. Computer modeling showed that each of these cavities can accommodate one glutathione molecule. It was also demonstrated by mass spectrometry that at least one cysteine residue in the above-mentioned pairs is basically glutathionylated. Glutathione molecule could be completely removed from Cys140, Cys206, and Cys351 under denaturing conditions. Unfortunately, we failed to identify which cysteine residues are deglutathionylated under nondenaturing conditions. Therefore, it is possible that that basal glutathionylation of one of cysteine residues in the pairs Cys206–Cys244, Cys369–Cys700, and Cys454–Cys458 stabilizes the protein. During oxidative stress, Na,K-ATPase α-subunit can be glutathionylated at some other (nonregulatory) residues. In contrast to basal glutathionylation, glutathionylation of these residues (Cys140, Cys206, Cys351) can be reversed with sodium borohydride [3]. We suggest that glutathionylation of some of these cysteines affects enzyme conformation and increases the resistance of Na,K-ATPase α-subunit to proteolysis. This correlates with our results that sodium borohydride deglutathionylates ~40% cysteine residues (which corresponds to ~4 cysteines out of all glutathionylated cysteine residues). Therefore, glutathionylation of these residues might affect the tertiary structure of Na,K-ATPase and increase stability of its α-subunit against trypsinolysis, as evidenced by our data on the effect of the extent of glutathionylation on the enzyme trypsinolysis pattern, as well as by the modeling results. Identification of cysteine residues, whose glutathionylation affects the enzyme conformation is a topic of our future study.
Based on the obtained results we conclude that cysteine residues of the Na,K-ATPase α1-subunit can be subjected to (i) basal glutathionylation that cannot be reversed in the native enzyme, (ii) regulatory glutathionylation that is controlled by various factors (e.g., glutathione and reducing compounds) and regulates the enzyme activity, and (iii) glutathionylation responsible for stabilization of the enzyme conformation under different conditions. Analysis of the fragments obtained by tryptic hydrolysis of different conformations of Na,K-ATPase glutathionylated to a different extent suggests that changes in the level of enzyme glutathionylation affect the conformation and stability of Na,K-ATPase.
Acknowledgments
The research was supported by the Russian Science Foundation (project 14-14-01152; experiments on the estimation of a degree of glutathionylation, Fig. 1) and the Russian Foundation for Basic Research (project 15-04-08832\17; trypsinolysis experiments, Figs. 2-4).
REFERENCES
1.Petrushanko, I. Y.,Yakushev, S., Mitkevich, V. A.,
Kamanina, Y. V., Ziganshin, R. H.,Meng, X., Anashkina, A. A., Makhro,
A., Lopina, O. D., Gassmann, M., Makarov, A. A., and Bogdanova, A.
(2012) S-glutathionylation of the Na,K-ATPase catalytic α subunit
is a determinant of the enzyme redox sensitivity, J. Biol.
Chem., 287, 32195-32205.
2.Petrushanko, I. Y., Mitkevich, V. A., Lakunina, V.
A., Anashkina, A. A., Spirin, P. V., Rubtsov, P. M., Prassolov, V. S.,
Bogdanov, N. B., Hanggi, P., Fuller, W., Makarov, A. A., and Bogdanova,
A. (2017) Cysteine residues 244 and 458-459 within the catalytic
subunit of Na,K-ATPase control the enzyme’s hydrolytic and
signaling function under hypoxic conditions, Redox Biol.,
13, 310-319.
3.Dergousova, E. A., Petrushanko, I. Y., Klimanova,
E. A., Mitkevich, V. A., Ziganshin, R. H., Lopina, O. D., and Makarov,
A. A. (2017) Effect of reduction of redox modifications of Cys residues
in the Na,K-ATPase α1-subunit on its activity,
Biomolecules, 7, 18.
4.Mitkevich, V. A., Petrushanko, I. Y., Poluektov, Y.
M., Burnysheva, K. M., Lakunina, V. A., Anashkina, A. A., and Makarov,
A. A. (2016) Basal glutathionylation of Na,K-ATPase α-subunit
depends on redox status of cells during the enzyme biosynthesis,
Oxid. Med. Cell. Longev., 2016, doi:
10.1155/2016/9092328.
5.Smith, T. W. (1988) Purification of
Na+,K+-ATPase from the supraorbital salt gland of
the duck, Methods Enzymol., 156, 46-48.
6.Lowry, O. H., Rosenbrough, N. J., Farr, A. L., and
Randall, R. J. (1951) Protein measurement with the Folin phenol
reagent, J. Biol. Chem., 193, 265-275.
7.Laemmli, U. K. (1970) Cleavage of structural
proteins during the assembly of the head of bacteriophage T4,
Nature, 227, 680-685.
8.Fraczkiewicz, R., and Braun, W. (1998) Exact and
efficient analytical calculation of the accessible surface areas and
their gradients for macromolecules, J. Comp. Chem., 19,
319-333.
9.Pettersen,E. F., Goddard,T. D., Huang,C. C.,
Couch,G. S., Greenblatt,D. M., Meng,E. C., and Ferrin,T. E. (2004) UCSF
chimera – a visualization system for exploratory research and
analysis, J. Comp. Chem., 25, 1605-1612.
10.Emsley, P., and Cowtan, K. (2004) COOT:
model-building tools for molecular graphics, Acta Crystallogr. D. Biol.
Crystallogr. , 60, 2126-2132.
11.Xianyu, M., Petrushanko, I. Y., Klimanova, E. A.,
Dergousova, E. A., and Lopina, O. D. (2014) Glutathionylation of the
alpha-subunit of Na,K-ATPase from rat heart by oxidized glutathione
inhibits the enzyme, Biochemistry (Moscow), 79,
158-164.
12.Jorgensen, P. L. (1977) Purification and
characterization of (Na++K+)-ATPase. VI.
Differential tryptic modification of catalytic functions of the
purified enzyme in presence of NaCl and KCl, Biochim. Biophys.
Acta, 466, 97-108.
13.Jorgensen, P. L. (1975) Purification and
characterization of (Na+,K+)-ATPase. V.
Conformational changes in the enzyme transitions between the Na-form
and the K-form studied with tryptic digestion as a tool, Biochim.
Biophys. Acta, 401, 399-415.
14.Mahmmoud, Y. A. (2005) Stabilization of trypsin
by association to plasma membranes: implications for tryptic cleavage
of membrane-bound Na,K-ATPase, Biochim. Biophys. Acta,
1720, 110-116.
15.Klimanova, E. A., Petrushanko,I. Y., Mitkevich,V.
A., Anashkina,A. A., Orlov,S. N., Makarov,A. A., and Lopina,O. D.
(2015) Binding of ouabain and marinobufagenin leads to different
structural changes in Na,K-ATPase and depends on the enzyme
conformation, FEBS Lett., 589, 2668-2674.
16.Orlov, S. N., Klimanova, E. A., Tverskoi, A. M.,
Vladychenskaya, E. A., Smolyaninova, L. V., and Lopina, O. D. (2017)
Na+i,K+i-dependent and
-independent signaling triggered by cardiotonic steroids: facts and
artifacts, Molecules, 22, 635.
Supplementary Table S1 (PDF)