REVIEW: Methods for Screening Live Cells
A. A. Gordeev* and A. B. Chetverin
Institute of Protein Research, Russian Academy of Sciences, 142290 Pushchino, Moscow Region, Russia; E-mail: aagordeev@gmail.com* To whom correspondence should be addressed.
Received July 19, 2017
Cell screening or, in other words, identification of cells with certain properties is now increasingly used in scientific and medical research, e.g., in diagnostics, drug testing, and production of cell clones with desired characteristics. In this review, we discuss existing methods of cell screening and their classification according to the cell presentation format. We describe the principles of the one-dimensional and two-dimensional formats and compare the main advantages and drawbacks of these formats. The first part describes the methods based on the 2D-format of cell presentation, when cells are immobilized in the same plane by various techniques. The second part describes the methods of the 1D-screening, when cells are aligned in a line in a stream of fluid and scanned one-by-one while passing through a detector. The final part of the review describes the method of high-performance cell analysis based on the merged gel technique. This technique combines the advantages of both 1D and 2D formats and, according to the authors, might become an effective alternative to many modern methods of cell screening.
KEY WORDS: cell arrays, flow cytometry, microfluidics, merged gelsDOI: 10.1134/S0006297918140080
Screening of living cells is commonly understood as identification of cells with specific properties in large heterogeneous populations, analysis of cell distribution in such populations, or testing the effects of various conditions on cell behavior. Various cell screening methods are widely used in such biology and medicine fields as disease diagnostics, food and water quality control, search for new microbial species, evaluation and monitoring of cell physiology and functioning, studies of the effects of cellular compounds (e.g., enzymes and antibiotics), and drug development. The majority of existing cell screening methods use either two-dimensional (2D) or one-dimensional (1D) formats of cell presentation. In this review we discuss specific features of these formats.
SCREENING METHODS BASED ON THE TWO-DIMENSIONAL FORMAT OF CELL
PRESENTATION
The 2D format of cell screening is based on cell immobilization on a flat support surface. Each of the cells occupies a unique position and can be reinvestigated, which ensures reliable cell identification by morphological or other characteristics. The cells can be easily manipulated and cloned, if the technology used allows it.
Methods based on colony growing. Cell colonies on a support (solid nutrient medium). The first scientist to use this approach was R. Koch [1], who grew bacterial colonies on the surface of solid gelatin and agar nutrient plates in order to obtain pure cultures of pathogens of various diseases. His studies had provided a powerful stimulus for the development of medicine and microbiology; causative agents for many diseases have been isolated and studied [2]. Since R. Petri introduced glass dishes into microbiological practice [3], the method has not changed much and continues to be widely used in modern science. Despite its simplicity and reliability, it has a significant drawback, which is low resolution. Thus, no more than 1000 colonies can be grown in a standard 10-cm Petri dish. If the plating density is high, some colonies merge, and the growth of closely located colonies is inhibited [4, 5]. It is generally recommended to plate no more than 250-300 colony-forming units per dish to ensure reliable colony detection and counting [5, 6]; therefore, only relatively small populations (less than thousands or tens of thousands of cells) can be screened by this method [7-13]. First of all, manual analysis of a large number of Petri dishes is very labor- and time-consuming. Thus, Maullu et al. [14] reported that screening of a library consisting of ~96,000 clones and plated at a density of 300 colonies per dish had taken several months. However, sometimes cell populations consist of hundreds of thousands of cells, as in screening of gene libraries obtained by random mutagenesis of a particular protein [15, 16] or of metagenomic libraries [17-19]. To solve these problems, the screening procedure should be optimized.
The procedure can be simplified by automation. Several models [20-23] have been proposed that photograph dishes with the colonies and analyze the resulting images with a special software, which allows the number of analyzed cells in the studied population to be increased. Thus, Joo et al. [24] used this approach to assay a library consisting of 200,000 cells. There are several commercially available automated cell counters (e.g., ColonyQuant from Schuett Biotec, Germany; Scan series from Interscience, France). According to the manufacturers, these devices can analyze up to six Petri dishes per minute.
Another way to increase the productivity of the Petri dish method is to increase the resolving ability by increasing the colony density. Using this approach, up to 5000 colonies can be grown in the same dish [25]. However, the colonies are small and some of them merge, and the colonies cannot be counted with accuracy. At the same time, clones with selective features could be rapidly identified by scanning of hundreds of thousands of colonies [26]. Sometimes, closely spaced small colonies are screened under a microscope. If the microscope is equipped with appropriate filters, it is possible to analyze the fluorescence of the colonies in addition to optical magnification [15, 25].
As a rule, the above-described approaches enable the analysis of libraries with less than 106 cells, because in the majority of cases, the incidence of the desired cells is above 10–4 [8, 27]. However, when the fraction of the required clones is 10–5-10–6, the occurrence of these clones in a library containing 105-106 cells will be within a single digit range [28, 29]; it is highly probable that they might be even missing from the library. Sometimes, the fraction of the required clones is even smaller, so larger libraries must be created and analyzed for their identification. In this case, strict selection conditions are applied, so that only the desired cells would proliferate and form colonies: up to 107 cells could be plated on a Petri dish with a selective medium, but only single colonies will grow [30]. Using selective conditions, it is possible to analyze libraries consisting of up to ~109 cells and to search for clones which the occurrence of 10–7 [31-34]. Despite the fact that this approach significantly increases screening productivity, it is rarely used, because proper selection procedures (e.g., for cells with particular enzymatic activity) cannot always be successfully developed and implemented [35].
A special problem in molecular biology is identification of rare clones containing in their genome a sequence with either no phenotypic manifestation or whose manifestation is difficult to observe. In the case of small libraries, standard protocols are used that include analysis of each colony by PCR or hybridization. However, if the number of clones is large, such analysis requires a lot of financial and labor resources, which makes the standard approaches unfeasible. Therefore, screening of large libraries includes rough primary selection, when pools of clones (and not individual colonies) are analyzed by PCR. These pools are obtained by washing the colonies off the dish. The positive pools are replated onto a solid nutrient medium but at a lower colony density. Then the screening procedure is repeated until individual clones are isolated [36, 37]. The advantages of this method are high sensitivity and efficiency that make possible screening of a library of up to 100,000 cells within a week. However, analysis of larger libraries requires more dishes and is too labor-consuming. For screening of such libraries, a similar approach was proposed, when the first screening rounds were performed on colonies grown in test tubes in a semi-solid low-temperature-meting agarose (Fig. 1). This type of medium, on the one hand, provides spatial separation of the colonies, and on the other hand, makes it possible to easily mix or centrifuge the cells directly in the test tube. At the first stage, 1 ml of the semi-solid medium contains, on average, 1000 colonies; at each subsequent stage, the colony concentration is reduced ten times. The authors of this approach reported that screening of a library containing 400,000 clones took only four days [38]. Despite significant productivity of this method, it remains highly specialized and is not suitable for direct screening based on the phenotypic features. Indeed, at the first stages of screening, the colonies densely located within the medium volume will inevitably overlap and prevent observation of the colonies distant from the test tube walls.
Fig. 1. Enrichment of gene libraries. A mixture of cells containing clones of interest (as indicated by the formation of the corresponding PCR product) is diluted in new test tubes and subjected to the next rounds of cultivation in gel and PCR screening until individual clones are isolated (reprinted with modifications from [38] with kind permission from Elsevier 2007).
Frost little plate method. The procedures for colony isolation in all the above-described methods do not differ much from the protocol proposed by Koch: the cells are plated and grown on a solid nutrient medium. Only the medium composition, the size of Petri dishes or vessels with similar function, and the colony density are changed, or an additional stage of preliminary rough screening is introduced. However, there are also more significant modifications of this standard approach. Thus, Frost has developed the little plate method for rapid counting of viable bacterial cells [39-41]. He mixed a drop of bacterial suspension with a drop of molten agar and spread approximately 100 µl of the mixture on a coverslip (2 cm × 2 cm) that was then incubated in a wet chamber for 3-6 h, which resulted in the appearance of “Lilliputian” bacterial colonies visible under a microscope at a small magnification. The diameter of such colonies is comparable to the thickness of the gel layer; therefore, it might be assumed that the colonies are positioned in the same plane. If necessary, they can be fixed and stained directly in the gel. Later, this method was improved by Tanner who applied a new procedure for colony staining and proposed to use boarded coverslip to limit the gel area, which made the method more standardized [42]. The Frost little plate method was initially developed for microbiological analysis of food, in particular, milk, milk products, water samples, and wash-offs from vegetables. The results obtained by this method are in a good agreement with the results obtained with traditional Petri dishes [43-46]. However, compared to the standard protocol that uses Petri dishes, the little plate method reduces the time of analysis by an order a magnitude, so that entire procedure could be carried out within the same day. It also requires less consumables (flasks, tubes, and media), which is important in the routine analysis of a large number of samples [44, 47, 48]. In addition to bacteria, the method has been adapted for analysis of yeast and mold fungi [48]. The known drawback of the method is a possible formation of dead cells aggregates that are often present in the analyzed samples (e.g., in pasteurized or sterilized milk) and could be mistaken for growing colonies under the microscope, thereby distorting the results of microbiological analysis [43]. Although Frost suggested that his method could be applied for both cell colonies and individual cells, analysis of individual cells is hindered by the fact that they are located at different depth in the gel and therefore, could not be simultaneously observed under the microscope and compared.
Direct observation of cells under a microscope. There is a number of approaches that provide cell alignment in the same plane for their direct observation and counting, such as the use of wet mounts and counting chambers, cell filtration on a membrane, immobilization on a flat support, etc.
These methods allow the cells to be immediately observed in an analyzed sample, so there is no need to wait for these cells to proliferate and form colonies visible with a naked eye as it occurs when the cells are grown on a nutrient medium. Moreover, when cells in the sample form aggregates or just are close to each other, their progeny might merge into a single colony. Direct observation methods make it possible to study all the cells in a sample and, therefore, are more sensitive than the methods requiring colony formation [42, 49-51].
Direct observation methods are most suitable for studies of heterogenous population consisting of cells of different species. Colonies of different species of microorganisms grow at different rates: some colonies can become visible already after one day of growth, whereas the others require several days to appear. Direct observation methods make it possible to investigate uncultured bacteria, i.e., live bacteria whose cultivation on agar under laboratory conditions is difficult or impossible [52-57]. This is especially important for analysis of soil and water samples from natural sources, in which microorganisms that could be detected by cultivation on agar can comprise less than 1% of total microbial population [58, 59].
Wet mounts. The use of wet mount preparations in the microscopy of live bacteria has started rather early (e.g., the squashed drop or wet chamber methods). To make a wet mount preparation, a drop of the specimen is placed onto a clean degreased slide surface and covered with a coverslip. To prevent fluid movement caused by convection, sample drying, or coverslip displacement, it is recommended that the gap between the coverslip and the slide is sealed with Vaseline®, Vaspar (a mixture of equal parts of Vaseline and paraffin), wax, or transparent nail polish [60, 61]. Wet mounts are better observed under a phase-contrast microscope. Many motile microorganisms move very quickly, which makes it difficult to study them. Adding methylcellulose to the microbial suspension reduces the speed of microbial movement and creates the conditions, at which the movement of flagella becomes visible [62]. The center of the wet mount is characterized by a rapid occurrence of oxygen deficit. This phenomenon allowed Pasteur to discover anaerobic metabolism: when observing a wet mount, he noticed that obligate anaerobes retained their motility only in the center but not at the periphery of the preparation [63]. Wet mounts are also used for studying various eukaryotic cells, from protozoa to cells of higher vertebrates [64-67]. The method is also used for diagnostic purposes (search for pathogenic agents in various clinical samples) and in scientific research, such as studies of heterogenous microbial populations and bacterial motility [60], assessment of cell state (e.g., viability) in analyzed samples [68], studies of the leukocyte activity [69, 70], etc.
The advantages of the wet mount methods are simplicity of sample preparations and possibility of its rapid analysis; however, the main drawback is that the thickness of the liquid layer between the slide and the coverslip varies from preparation to preparation and cannot be controlled. Because it is impossible to determine the preparation thickness, it is impossible to calculate the cell concentration in a sample that might be important in the diagnostic procedures. Moreover, to align the cells in the same plane, it is necessary to press the coverslip toward the slide, which can crush some of the cells, especially if they are animal cells that lack the cell wall.
Cell counting chambers. The above-described problems can be solved by using cell counting chambers – special devices for counting microorganisms and cells in blood, urine, cerebrospinal fluid, etc. The first counting chamber was proposed by the physiologist Malassez in 1874 [71]. A counting chamber is a thick slide with a depression; the bottom of this depression has a counting grid (engraved or applied by vacuum deposition) that is covered by a polished coverslip. Depending on the chamber type, the depth of the resulting chamber varies from 10 to 200 µm. The fixed height of the chamber is ensured by close contact between the slide and the coverslip – the coverslip is reseated against the slide until the appearance of iridescent Newton rings (interference bands) [71, 72].
The structural elements of all grids are large and small squares. Different type of grids (Thoma, Bürker, Predtechensky, Türk, Neubauer, Goryaev, Nusbaum, Fuchs–Rosenthal, etc.) differ in the area, number, and grouping of large and small squares. Knowing the grid parameters, such as the chamber height and areas of small and large squares, makes it possible to calculate the number of cells in a certain volume.
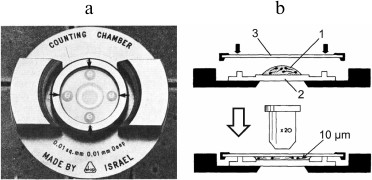
There are open and closed counting chambers. In the closed chambers, the cover slip is reseated after the chamber has been filled, which might let some air bubbles into the sample preparation [71]. Earlier, such chambers were used for the analysis of blood cells (Thoma—Zeiss chamber), cerebrospinal fluid (Dunger chamber), and bacterial suspensions [73, 74], but they have been replaced by the open type chambers. At present, closed chambers are mainly used for analyzing viscous preparations. Thus, the Makler chamber (Fig. 2) with a depth of 10 µm is used for the analysis of undiluted sperm, e.g., sperm cells count, determination of spermatozoon concentration, and sperm motility assay [75-77]. However, results obtained with this chamber are inaccurate and often overestimate the cell concentration [78-81].
Fig. 2. The Makler chamber: photograph (left) and principle of action (right). A drop of the analyzed preparation (1) is placed onto the grid surface (2) and covered with a coverslip (3) (reproduced with modifications from [76] and [77] with kind permission from Elsevier, 1980 and 1984).
Open chambers (Fig. 3) were for the first time described by Alferov in 1883 and then by Bürker in 1905 [71]. These chambers are filled after the cover glass has been reseated. A drop of the analyzed sample is placed onto the slide at the very edge of the coverslip to let the suspension to enter the chamber due to the action of capillary forces [60, 72]. Surface areas with the applied grids are separated from each other and from the slide by grooves that regulate the filling of the chamber. The cells are counted at least 3 min after the chamber is filled to allow the cells to sediment (the sedimentation time depends on the cell size). There are many versions of open chambers that differ in the type and number the grids (from one to ten; usually, two or four) and in chamber depth. Some chambers (e.g., Hausser chamber) are equipped with clamps to fix the coverslip. At present, Fuchs–Rosenthal [82-86], Goryaev [87-89], Thoma [90, 91], Neubauer [81, 92-94], and Bürker [95-97] chambers are widely used. In Russia, Fuchs–Rosenthal and Goryaev chambers are most popular. The Goryaev chamber is typically used for analysis of blood cells. It has a volume of 0.9 µl; its depth is 100 µm, and the grid area is 9 mm2 (Fig. 3). The grid consists of 225 large squares (with the side of 200 µm), 100 of them are nongridded; 25 squares are subdivided into 16 small squares each (with the side of 50 µm); 100 squares are divided by lines. The Fuchs–Rosenthal chamber is commonly used for cells analysis in the cerebrospinal fluid and urine. The concentration of cells in these biological fluids is lower than in the blood; therefore, the size of the Fuchs–Rosenthal chamber is larger than the size of the Goryaev chamber: its volume is 3.2 µl, the grid area is 16 mm2, and the depth is 200 µm [71].
Fig. 3. Open cell counting chamber. Left upper panel, general view; left bottom panel, side view; right panel, Goryaev chamber grid. 1) Slide with engraved grid; 2) longitudinal grooves; the middle part is below the lateral parts by 0.1 mm (the depth of the chamber) and is divided by a transverse groove (3); 4) coverslip.
Traditional counting chambers are not suitable for analysis of bacterial preparations, because of the Brownian motion of bacteria, location of bacterial cells at different depths, and slow sedimentation. These difficulties could be overcome by using shallow (depth, 10 µm) open Thoma chamber. To reduce the Brownian motion, 0.2-0.5% gum arabic or 2% peptone could be added to the bacterial suspension [73].
It should be noted that cell counting with counting chambers is not accurate. The error of the method depends on several factors and might be up to 20% [71, 98]. The accuracy depends on the number of analyzed and counted cells. It is believed that 300-600 cells (at least 100 cells) must be counted in a sample for reliable results [60, 99]. Moreover, although counting chambers have strictly determined dimensions, Norris and Powell [100] found that the thickness of the fluid layer in the chamber is usually more than the nominal depth of the chamber, because of insufficiently tight contact between the coverslip and the slide surface (even when the interference rings are present). The authors believe that this might explains the counting errors and recommend the actual thickness of the suspension layer in the chamber to be determined with an interferometer. In addition, errors can be caused by adhesion of the cells to the coverslip and their agglutination. The movement of the fluid in the chamber is strongly restricted by capillary forces, but because the chamber depth is several times more than the linear dimensions of the cell, the cells are not immobilized in the fluid layer and can change their positions.
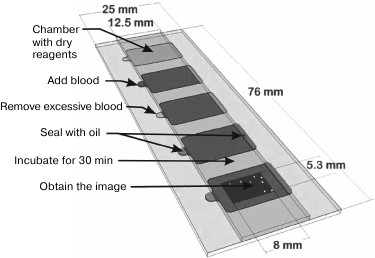
A microfluidic chip (Fig. 4), which is a slightly modified open cell counting chamber, was proposed by M. Beck et al. [101] for determining the concentrations of CD4+ and CD8+ T lymphocytes in the blood of HIV patients undergoing the antiretroviral therapy. The chip is made on a slide and consists of five identical chambers, each with an area of 130 mm2 and depth of ~25 µm. The bottom of the chambers is coated with a layer of dried gelatin (100-150 nm thick) containing a set of fluorescently labeled antibodies for staining the cells of interest. After the chamber is filled with a blood sample due to capillary forces, the antibodies are released into the blood and interact with the cells. Then a snapshot is made of the central part of the chamber, and CD4+ and CD8+ T lymphocytes are counted automatically with a special software. The data obtained with a microfluidic chip are comparable with the results of flow cytometry traditionally used for such purposes. However, the chip is much easier to use and does not require special expensive equipment. One drop of patient’s undiluted blood is sufficient; there is no need for sample pretreatment that might lead to the changes in the cell concentration.
Fig. 4. The use of two-dimensional microfluidic chip. The depth (26.5 µm) and the shape of the chambers are determined by the layer of glue between the two slides of different sizes placed one on top of another. The chambers have openings for loading blood samples and escape of the air. One of the internal surfaces is coated with dried gelatin containing fluorophore-conjugated antibodies for cell staining. The chamber is filled with the analyzed sample due to the action of capillary forces and sealed with a mineral oil. After incubation for 10-30 min, images of fluorescent cells are obtained and used for cell counting (reprinted with modifications from [101], http://dx.doi.org/10.1039/C1LC20565J, with kind permission from the Royal Society of Chemistry).
Cell screening on a membrane. To analyze diluted microbial suspensions whose volume can reach tens of milliliters, these suspensions can be filtered through a membrane. For the first time, this approach was used in 1928 by N. Kholodny [50, 58] for analysis of bacterial plankton – after filtration, the cells were transferred from the filter onto a slide and studied under a microscope. Later, A. Razumov [102] proposed to examine the cells directly on the filter. For better results, phase contrast microscopy [103] or cell staining [104-106] are used. In the case of fluorescent staining, low-autofluorescence polycarbonate [107-110] or aluminum oxide [111] membranes are used for higher contrast images. A multichannel system for image processing has been developed to provide quick identification of bacteria immobilized on the membrane and to assess their metabolic activity [112].
The disadvantage of this method is that filtration exposes cells to pressure that can damage them. Moreover, there are the so-called filterable bacteria whose size is less than the filter pore diameter [113, 114], so that they are not retained by the membrane and, therefore, will be lost for analysis [50]. The method limits the ways the cells can be manipulated, e.g., the refusal to immobilize the cells because of resulting cell death might result in cells washed off the filter and lost.
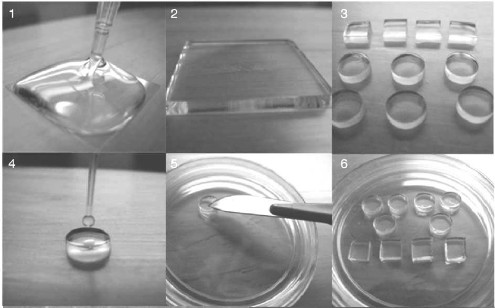
Agarose pad method. The agarose pad method makes it possible to arrange living bacterial cells in the same plane and observe each of them under a microscope. The pads are prepared by pouring nutrient agarose medium onto a glass and then placing another glass on top of the liquid agarose (Fig. 5; http://www.youtube.com/watch?v=8IZmkPffMmg). The resulting “sandwich” is cooled allowing agarose to harden. Then, the agarose layer is taken out and cut into fragments of desired size (agarose pads). A small drop of cell suspension is placed on a pad, which is then turned upside down and placed in a Petri dish (or the pad is simply covered with a coverslip) so that the cells are fixed by being pressed between the pad and the surface of the Petri dish (or the coverslip) [115-118]. Various substances, such as inducers, inhibitors, antibiotics, live dyes, etc., can be added into the agarose to allow the researcher to observe in real time the effects of these substances on the synthesis of certain proteins or their localization [115]. If the observed cells are fluorescent, the components for preparing agarose pads should have low autofluorescence. Agarose pads are soft and do not damage immobilized cells. The agarose layer acts as a reservoir of nutrients and contains a sufficient amount of oxygen for the cells to divide, grow, and form colonies [118-121]. If the incubation time is more than several hours, silicon lubricant or paraffin are used to prevent sample drying; in some cases, special slides with chambers for additional supply of nutrients or oxygen are used [120]. When immobilized on agarose pads, cells can divide and form microcolonies. However, the dividing cells can spread only on the pad/coverslip interface, which results in the formation of loose flat colonies that merge more rapidly than colonies on agar. The disadvantage of the method is also that the cells are immobilized only when pressed between the glass and the agarose pad. Once the pad is taken off, the cells immediately get back the ability to move. Therefore, researchers cannot pick up the cells of interest or change the cell environment by removing or adding new components by virtue of washing the gel.
Fig. 5. Preparation of agarose pads. 1) Melted agarose is poured onto a coverslip; 2) another coverslip is placed on top of the agarose to obtain a “sandwich” of even thickness; 3) the agarose layer is taken out and cut into agarose pads; 4) a drop of cell suspension is applied onto the pad surface; 5) the pad is turned over and transferred into a Petri dish for subsequent observation under a microscope; 6) several pads can be placed in one Petri dish (reprinted with modifications [118], https://www.nature.com/nprot/journal/v7/n1/full/nprot.2011.432.html, with kind permission from Macmillan Publishers Ltd. 2012).
Cell adhesion on a support. Another method for cell arrangement in the same plane is immobilization on a support by adhesion. This approach is frequently used for eukaryotic cells. Adhesion is provided by the interaction between cell surface proteins and charged groups of the support. When adhered to the support and covered with nutrient medium, many eukaryotic cells can grow and multiply. The immobilized cells can be easily examined under a microscope. Initially, the support was made of glass, cellophane, poly(methyl methacrylate) or another polymer, but for a long time glass has remained the most popular material because of its availability [122]. Glass supports are still widely used for cell immobilization in microscopic studies [123-127].
Starting around the second half of the 1970s, polystyrene plasticware has been used in cell culture studies. Polystyrene has a high optic transparency; it is cheap and can be pressed into any desired shape. Polystyrene is also hydrophobic, so cell attach very poorly to it. To make polystyrene an adhesive material, it is modified chemically (e.g., by treatment with sulfuric acid) or physically (by treatment with a corona electric discharge, plasma, or radiation) to induce formation of sulfonic, hydroxyl, aldehyde, ketone, carboxyl, etc., groups on the surface [128-130]. Obviously, since the cells placed on the support are immersed in the medium, they are not perfectly immobilized. Although most cell cultures would adhere to the support, some cells can get detached from the surface and migrate in the solution.
One of the limitations of this method is that it cannot be used for nonadhesive (suspension type) cells, such as blood cells (especially immunocytes), certain cancer cells, and stem cells that are important in various fields of biology and medicine. To solve this problem, a new immobilization method was developed that uses polyethylene glycol-lipid (PEG-lipid). PEG-lipid has an affinity for the membrane and was named “biocompatible anchor for membrane” (BAM) [131, 132]. BAM consists of three successively connected functional units: the hydrophobic oleyl group, hydrophilic PEG chain, and N-hydroxysuccinimide ester group. BSA-coated glass is modified with BAM by virtue of formation of the amide bond between the protein amino groups and N-hydroxysuccinimide ester groups in BAM. Non-adhesive cells are immobilized on the BAM-coated surface due to incorporation of the BAM oleyl fragment into the cell membrane. The authors of the method have shown that such immobilization does not impair cell proliferation.
Bacteria, in particular E. coli, are often immobilized on poly-L-lysine-coated glass, because such immobilization enables cell washing and staining [133].
3D-cultures. When working with cells of higher eukaryotes, it often difficult to reproduce cell microenvironment existing in a multicellular organism, where the development and normal functioning of cells depend on their interactions with the microenvironment represented mostly by the extracellular matrix (ECM). ECM consists of various macromolecules, whose structural integrity and functions are essential for the maintenance of normal cell architecture in tissues, cell development, and tissue-specific functions [134]. Hence, eukaryotic cells are often cultured on supports coated with the ECM components, such as collagen [135, 136], fibronectin [137-139], and laminin [137, 140], ECM derivatives, or compounds that mimic them, such as gelatin [141, 142], poly-D-lysine, poly-L-lysine [143-145], or their combination [146]. This treatment makes cell environment more physiological and increases the adhesiveness of the support.
The so-called 3D-cultures (Fig. 6) are even better mimic of the in vivo conditions of a multicellular organism [147-150]. This approach is based on culturing the cells by submerging them into the ECM layer (strictly speaking, this approach does not belong to methods based on the 2D-format of cell presentation, but we discuss it in this section for comparison). For the first time, the 3D-culture was used in 1972 for growing fibroblasts in the in vitro polymerized collagen matrix that formed a fibrous 3D-network [151]. At present, it is well known that the cell response to certain stimuli in a 2D-culture might be quite different from the cell response in vivo or in a 3D-culture [152-155], partially because cell physiology is determined by the mechanical properties of ECM and by the physical and chemical anisotropy [149, 156-158], which are completely different in 2D- and 3D-cultures [152, 159, 160]. Thus, the 3D-cultures are more preferable for the studies of stem cell differentiation, tissue morphogenesis, cancer biology, and virus–cell interactions, as well as cell-based drug screening and toxicology assays [147, 161, 162].
Fig. 6. Different approaches to culturing eukaryotic cells.
However, 3D-cultures lack a number of advantages of the 2D-cultures. Thus, in 3D-cultures, cells are located at different depths characterized by different physiological conditions, e.g., gas exchange efficiency, nutrient availability, and waste removal. Moreover, the distribution of cells throughout the thickness of the 3D-matrix significantly hinders simultaneous monitoring, screening, and picking up the cells for future use [150, 155]. Another problem is the difficulty of using a conventional microscope for monitoring the cells immersed at different depths in a light-scattering medium [152]. Both these problems are partly overcome by using the so-called on-top cultures (Fig. 6), in which cells attached to the gel surface are cultured in a liquid medium. The ECM components are added to the nutritional medium, from where they partially sediment onto the cell-carrying surface of the gel. This to a certain extent imitates the conditions of 3D-cultures [163, 164]. However, in on-top cultures, the cells and their progeny can easily detach from the surface and float into the surrounding medium. Moreover, the cells often aggregate before adhering to the gel surface and might spread unevenly on it [163].
SCREENING METHODS BASED ON THE ONE-DIMENSIONAL FORMAT OF CELL
PRESENTATION
The 1D-format of cell presentation includes passing the cells through a detector in a fluid flow. This is a high-throughput format that makes it possible to analyze thousands of cells per second.
This approach was first proposed by Moldavan in 1934 [165]. He suggested to pass a cell suspension under pressure through a thin tube placed in the visual field of a microscope. A photoelectric device
mounted on the microscope ocular would record the passing of each cell through the capillary. However, it seems that this device has never been built [166]. During the next decades, a number of instruments have been created for particle counting in suspensions [167-169].
The Coulter counter. One of the most successful first models of a flow cytometer was patented in 1953 by W. Coulter [170] and later named the Coulter counter. The operation principle of this device comprises pressing cells suspended in an electrolyte through a miniature chamber, through which a weak electric current is passing. When passing through the chamber, the cell increases the electrical impedance, which results in a transient decrease in the current. The cell concentration is estimated by counting the number of such pulses during the passing of a definite volume of cell suspension through the chamber. The magnitude and the shape of the pulse depend on the cell size, thereby making it possible to determine the distribution of cells or other particles in the sample by their linear size or volume [72, 171]. Since its creation, Coulter counter has been extensively used by researchers [72, 172-174]. However, in many cases, the data on the cell optical characteristics are required in addition to the information about the cell size. For this, more sophisticated devices have to be used.
Optical flow cytometers. The information about optical properties of cells can be obtained using flow cytometers equipped with an optical system through which the cells are passed one by one in a fluid flow. A significant success in this field of research has been achieved in the second half of 1960s, when an automated flow cytometer was built. This flow cytometer used a microscope optical system (after the principle by Moldovan) capable of measuring and recording the UV absorption and blue light scattering of cells moving by the objective at the rate of 500 cells per second [175]. In 1969, Dittrich and Gohde described a similar device that detected the fluorescence of cellular DNA stained with ethidium bromide [176].
Hydrodynamic focusing. In 1969, a fluorescent cytometer has been developed that differed from the earlier microscope-based systems: in addition to the mutually perpendicular specimen illumination axis and the axis of cell suspension flow in the tube, it had a photomultiplier detection axis that was perpendicular to both these two axes [177]. Argon laser was used to obtain high-density monochromatic light; this is important when working with fluorescence. Moreover, the developed cytometer used the principle of hydrodynamic focusing proposed earlier by Crosland-Taylor [178]. This principle is based on the injection through a special nozzle of a cell suspension into the center of a rapidly flowing wide stream of a buffer solution, the so-called sheath fluid. The nozzle geometry prevents the turbulence of the cell suspension flow and its mixing with the sheath fluid. The volumetric flow rate of the sheath fluid is usually 10-100 times higher than that of the sample. The pressure of the external flow on the suspended cells aligns them in center of the stream. As a result, the cells form a “line” in the fluid flow. Before this invention, the creators of flow cytometers had to choose whether to use a wide tube allowing two or more cells to pass simultaneously through the detector, thereby distorting results of the measurements, or to use a narrow tube that makes it difficult to observe cells because of different refraction indices of the tube material and the cell-containing fluid. In addition, narrow tubes clogged easily [166]. Hydrodynamic focusing solved the above-described problems, on one hand, by using a sufficiently wide flow, and, on the other hand, by localizing the cells in a rather narrow section of this flow.
Further development of flow cytometers has mostly consisted of technical improvements of the suggested prototype. Modern cytometers are equipped with a whole set of lasers and can measure and analyze signals from various cell fluorophores. Some of modern flow cytometers can simultaneously analyze up to 17 fluorescence channels [179].
In addition to fluorescence, flow cytometers can measure the scattering of the laser beam by each cell (Figs. 7 and 8). Both forward (small-angle) scatter and side scatter are evaluated. To measure the forward scatter (FSC), a narrow partition is put in the path of the laser beam to block the laser beam itself but not the scattered rays that are focused by a lens placed between the partition and a photodetector. In this system, the lens usually collects the rays deflected by 0.5-10° from the original direction of the laser beam. In general, a cell with a larger cross-section will deflect the rays stronger. Therefore, FSC is used for estimating the cell volume. However, this is not quite correct, because FSC could be affected by the cell refraction index, which depends on the cell morphology and physiological state [180]. To assess the side scatter (SSC), the collecting lens and photodetector are placed perpendicularly to the laser beam to detect the rays strongly deflected by the cell. The SSC data might provide information on the cytoplasmic and membrane properties of the cells. Analysis of the light scatter alone (without fluorescence data) makes it possible to evaluate the cell morphology, e.g., at the analysis of blood samples (Fig. 9).
Fig. 7. Types of beam scatter in a flow cytometer.
Fig. 8. Cell screening in a laser flow cytometer. The fluid flow and the FSC and SSC collecting lenses are placed on mutually perpendicular axes (reprinted with modifications from [166] with kind permission from Springer Science+Business Media, ©2011).
Fig. 9. Analysis of leukocyte subpopulations in rat peripheral blood based on FSC and SSC. PMN, polymorphonuclear cells; M, monocytes; L, lymphocytes (reprinted from [245] with kind permission from John Wiley and Sons, ©1995).
Analysis of bacterial cells by flow cytofluorometry is problematic, because bacteria are much smaller than eukaryotic cells, for which the majority of modern flow cytometer models have been created. Thus, the average diameter of a bacterium is 1 µm whereas the average diameter of a blood cell is 10 µm; consequently, the surface area of a bacterium is about 100 times smaller and its volume is about 1000 times smaller than those of the blood cells. The signal from fluorescent probes bound to the surface or distributed within the volume of a bacterial cell would be essentially weaker than the signal from a eukaryotic cell. Therefore, flow cytometry of bacteria requires more sensitive detector systems [181, 182].
The key feature of flow cytometers that made them so popular for cell screening is their high throughput. The sample flow rate in modern flow cytometers is several hundred microliters per second, which enables the analysis of up to 100,000 cells per second [183]. However, as a rule, the operational rates do not exceed 10,000 cells per second [184, 185], and the rates lower than 1000 cells per second are commonly used [91, 186, 187]. This is because increasing the screening rate increases the probability of error. At a fixed cell suspension injection rate, the screening rate can be increased by increasing the cell concentration in the suspension. However, such increase might cause cell aggregation before the cells pass through the detector. Moreover, it might also increase the probability that more than one cell will simultaneously pass through the detector (Fig. 10). Another approach for increasing the screening rate is to increase the injection rate of the cell suspension into the sheath flow; however, this will increase the cross-section of the region occupied by the cells (Fig. 11), i.e., impair the hydrodynamic focusing. As a result, more than one cell can simultaneously pass through the detector, which would also lead to the distortion of the results.
Fig. 10. Dependence of the probability of two or more cells passing through a laser beam as a single event on the cell flow rate (reprinted with modifications from [182] with kind permission from John Wiley and Sons, ©2001).
Fig. 11. Influence of the sample feed rate on the efficiency of hydrodynamic focusing. Cell sample in the center of the sheath fluid flow passes through the analytical chamber illuminated by a laser beam. When the sample is injected slowly (left), the cells are better focused and pass through the center of the laser beam one at a time. When the sample is injected quickly (right), the cells are less focused and not illuminated equally because some of them are out of the laser beam focus. Besides, more than one cell can be illuminated simultaneously (reprinted with modifications from [182] with kind permission from John Wiley and Sons, ©2001).
Acoustic focusing. An actively developing technique of flow cytometry is acoustic focusing that is based on the use of sound pressure [188]. The effect of sound pressure on particles was for the first time described by Kundt and Lehmann in 1874 who observed a striated pattern of dust particles levitating in the organ pipes [189]. Later, this effect was used for separation of particles in aqueous solutions [190-193]. When applied in flow cytometry, acoustic focusing substitutes for the traditional, hydrodynamic focusing, since it does not require a flow of sheath fluid but uses physical differences between the carrier fluid and the cells in the cell suspension to align the cells in a queue directed along the central axis of the flow in the capillary (Fig. 12). The possibility to focus the cells in a line without the sheath fluid provides advantages over conventional flow cytometry, such as a rapid analysis of highly diluted samples and unique possibility to control (slow down, stop, or reverse) the flow. The theory of acoustically controlled capillary was described in 2005 [194]; its use for cytometry was suggested a few years later [195].
Fig. 12. Acoustic focusing. Left panel: linear capillary with dense particle focusing along the central axis of the capillary; the fluid flow is directed downward. Right panel: calculated acoustic potential for erythrocytes suspended in PBS in the cross-section of a capillary. Cells with positive acoustic contrast are concentrated in the potential well in the capillary center (reprinted with modifications from [188] with kind permission from John Wiley and Sons, ©2009).
The principle of acoustic cytometry is that sonication of a capillary with the sample stream results in the formation of acoustic radiation pressure field. The distribution of the field potential in the capillary cross-section is shown in Fig. 12. Particles passing through the capillary experience the pressure that transfers them into the potential minimum region (the potential well) and aligns them in a focused line along the capillary axis. Note that such behavior is manifested by almost all particles studied by flow cytometry; however, there are exceptions. Speaking strictly, the behavior of particles in the acoustic field is determined by the acoustic contrast between the fluid and the particle in it. The contrast, in its turn, is determined by the difference between the compressibility and density of the particles and the fluid. The particles that aligned along the central axis of the capillary have a positive acoustic contrast. However, there exist particles with a negative acoustic contrast, such as fat globules or gas bubbles, that migrate towards the capillary walls under the action of the acoustic force. If the density and compressibility of the particles and the surrounding fluid are equal, i.e., acoustic contrast is absent, no acoustic radiation pressure is generated.
It should be mentioned that ultrasonic pressure does not disintegrate the cells. Unlike acoustic lysis of cells in ultrasonic homogenizers that generate ultrasound with frequencies of tens of kHz, acoustic focusing uses ultrasound with a higher frequency (above 1 MHz) that prevents formation of cavitation bubbles, whose collapse leads to cell lysis. Moreover, acoustic lysis uses very high energies, whereas acoustic cytometry is performed at relatively low energies, only hundred milliwatts at a very high sample stream flow rate, so that energy rapidly dissipates in the fluid. It was shown that the acoustic field created by a capillary with an acoustic source in the subMHz region did not affect the viability of Chinese hamster ovary cells [196].
Acoustic cytometry has some disadvantages. First, focusing strongly depends on temperature and the type of carrier medium in which the cells are suspended. Any changes in these factors require optimization of the ultrasound resonance frequency. Second, because of the direct contact between the sample and the capillary walls, the acoustic cytometry system is very sensitive to contamination [197]. Third, the effect of the acoustic force on particles depends on their size. The overall effect, which is a result of the acoustic force action and the opposing fluid resistance, is proportional to the squared particle radius. Hence, small particles are focused more slowly than larger particles with the same acoustic contrast. That means that during flow cytometry of small cells, such as bacteria, the sample flow in the focusing capillary should be slowed down, which would considerable increase the time of analysis. At present, there are no reliable procedures for acoustic focusing of smaller, submicron particles, e.g., bacteria and viruses, and hydrodynamic focusing should be used. Since the acoustic forces do not depend on the flow, any volumetric ratio between the sheath flow and sample flow can be used. In traditional flow cytometers, the volume of the sheath fluid required for sample focusing is usually 100-1000 times larger than the sample volume. In a combined acoustic-hydrodynamic cytometer, it might be reduced to the ratio of 10 : 1, or 2 : 1, or even 1 : 10, that would still be sufficient to prevent the contact between small particles and capillary walls. Because the acoustic forces act on the particles stronger if the particles are located closer to the central axis, focusing in this case requires less time. However, the combination of acoustic and hydrodynamic focusing has some limitations, in particular, the accuracy of focusing can worsen if the sheath fluid and the sample carrier medium are not “acoustically” similar. This effect has a complex nature that is not completely understood yet and depends on physical properties of these fluids, the ratio between their volumes, the delivery system geometry, and other factors. Acoustic focusing followed by hydrodynamic focusing can partially solves this problem, especially for the focusing of smaller particles and prevention of the sample contact with the optic chamber walls.
Modern acoustic cytometers can focus lymphocytes and larger cells at a sample flow rate of 2 to 3 ml/min, that is one to two orders of magnitude higher than in traditional flow cytometers. Such a high sample flow rate enables high-throughput screening of cells even in diluted samples.
Another advantage of acoustic focusing in comparison to the hydrodynamic focusing is that the former can be used for analysis of cells with a small number of fluorophores. In this case, to accumulate a sufficient signal on the detector, the sample stream should be slowed down. In hydrodynamic focusing cytometers, combination of the slow sample stream and dense focusing requires the use of small-size flow systems that can be easily clogged by the cells. As mentioned above, the sample stream rate can be easily reduced in the acoustic focusing cytometers. Moreover, this would even improve the focusing, because cells moving at a lower speed would be subjected to the action of acoustic forces for a longer period of time.
An interesting development in the acoustic cytometry is the method for the formation in the same flow chamber of several parallel streams of focused cells. Such parallel streams are created using multi-node standing waves, when the cells align in the nodes. To demonstrate the possibilities of this approach, a rectangular flow chamber was made of an aluminum frame that was sandwiched between two microscope glass slides (25 mm × 75 mm) and sealed with epoxy glue. The space between the two glass slides was 0.73 mm. Using this flow chamber and acoustic focusing, the authors were able to create up to 37 parallel streams of cells [198].
In acoustic cytometry, the cell stream can be arrested or even reversed. By combining the cell stream control and high throughput, it is possible to create flow cytometers that would combine a statistical power of traditional cytometry with the reliability of cell observation under a microscope. Such tools would provide high-throughput cell screening with the possibility to stop the stream and to obtain images of cells of interest.
When speaking about modern flow cytometry, we must mention devices that do not use cell focusing [197, 199]. The cell stream is limited by a capillary with a small internal diameter. When using this type of cytometers, it is necessary to avoid high concentrations of cells to prevent (i) simultaneous passage of several cells through the detector and (ii) clogging of the capillary with cell aggregates. The optics in such devices is tuned to detect the cells located both along the central axis of the stream and at its periphery [200]; therefore, these cytometers are not as accurate as devices with the hydrodynamic and acoustic focusing, but they are cheaper and easier in operation.
Microfluidic systems. The development of microprocessing and microfabrication technologies has allowed the size of flow systems to be decreased. This has led to the emergence in 1990s of a special interdisciplinary branch of research, microfluidics, that studies the behavior of small (about 10–6-10–18 liters) fluid volumes [201-203] in capillaries with the diameter comparable to the size of eukaryotic cells. Historically, the purpose of microfluidic studies was to make the equipment smaller (to save reagents), simpler, and less expensive to produce [200]. It had been generally believed that these new devices would operate according to the same principles as their macro analogs. However, it turned out that the physics of fluid behavior in microflows is different, thereby promoting development of entirely new devices with no analogs on the macroscale [197, 200, 204, 205].
The flows in the microfluidics systems are, as a rule, laminar and not turbulent. Therefore, the behavior of these fluid flows and the changes in the substance concentrations in them can be modeled mathematically, thereby making it possible to quantitatively predict the cell environment. Such deterministic behavior of the stream in the microchannels is a unique property of microfluidics, that does not have analogs in the macroscopic world and, hence, often requires special engineering approaches. Microchannels, as it is evident from their name, can be manufactured at the cell-size scale; therefore, they can be used for studies of cellular effects, for dispersion and sorting of individual cells, creation of systems with particular physiological parameters, etc. At relatively small additional expenses, microvalves, micropumps, and other modules can be integrated on the same solid support, which would allow the sample to be isolated from its environment in order to prevent errors caused by contamination and human factor and also to automate the delivery of fluids. Because of this, systems based on microfluidic chips are often called “labs-on-a-chip” [203, 206]. It is expected that microfluidics will lower down the cost of high-throughput studies, especially when the manufacturing of the equipment becomes routine. As mentioned above, microfluidic devices consume less reagents, produce less waste, and occupy less space than their macrofluidic analogs; therefore, they can easily be transported and used not only in a limited number of specialized laboratories but in the field as well [200, 204-207].
One of the branches of microfluidics is on-chip flow cytometry. The cost and the complexity of manufacturing of flow system components that are traditionally made from a high-quality glass could be reduced by using inexpensive polymers. The channels manufactured by microprocessing and microfabrication provide a laminar flow that can deliver cells to the optic chamber detection zone with a higher accuracy and better control than in conventional flow cytometers [208]. The new technologies make it possible to manufacture rapidly and at low cost the required components and to create the optimized channel geometry, which is otherwise difficult or impossible to achieve by traditional glass handling methods [200]. Already in 1993, a flow cytometer model was developed [209] that had a chip of two parts made from fused quartz. The hydrodynamic focusing in this model was achieved by injecting the sample into the center of the narrowing flow of sheath fluid. Using this system, the sample stream was focused to 10 µm at a high flow rate (up to 10 m/s).
One of the simplest modern microchannel systems for hydrodynamic focusing consists of two streams of the sheath fluid located on both sides of the sample stream and oriented either perpendicularly or at an angle to it [198, 210]. By varying the channel sizes, the sample can be focused in a very narrow stream. Moreover, the parabolic profile of the flow in these channels allows the particles to be focused to a certain degree in the vertical direction [211]. Further development of this technology has been aimed at the increasing the number of sheath fluid streams. Thus, a device with three sheath fluid streams was proposed, in which the accuracy of focusing was improved by varying the height of the sheath fluid streams. The use of three sheath fluid streams not only resulted in more precise particle focusing, but also increased the processivity and accuracy of cell analysis, which made this device comparable to the commercial flow cytometers [212, 213]. Later, the number of focusing streams was increased – up to eight in some models [214]. In general, increase in the number of sheath fluid streams improves the quality of sample focusing and allows the sample position in the channel to be controlled, but makes the manufacturing of such devices more difficult.
To simplify the manufacturing of microfluidic chips, new schemes for the hydrodynamic focusing with the optimized flow geometry are developed. Thus, a microfluidic chip with the two-stage cascade focusing was proposed (Fig. 13a). At each stage, the sample is injected between the two converging streams of the sheath fluid. In addition to the relatively simple process of chip manufacturing, the hydrodynamic pressure on the cells in this case is less than during the classical hydrodynamic focusing [208, 215, 216]. Another approach, the so-called “spin focusing”, is based on the use of a stream of compressive fluid swirled around the sample stream (Fig. 13b). This approach ensures a high quality of the cell alignment in the center of the flow and, compared to the cascade focusing, requires a simpler design and easier manufacturing of microfluidic system components [208].
Fig. 13. Hydrodynamic focusing with optimized stream geometry. a) Fluid flows in the microfluidic chip with the two-stage cascade focusing (reprinted with modifications from [215] with kind permission from The Royal Society of Chemistry). b) Fluid flows in the microfluidic chip with the hydrodynamic spin focusing. Left panel, operation principle with sheath and sample flow directions; right panel, sample fluid is stained with a dye (reprinted with modifications from [208] based on the Creative Commons Attribution license (CC BY 3.0)).
An approach that has been widely used in microfluidics in recent years is inertial focusing. Inertial focusing is provided by the action of inertial lift forces and also by resistance forces [197] that cause the cross-streamline migration of cells into predicted equilibrium positions. Exact spatial-temporal focusing positions emerge due to the combination of lateral focusing by inertial forces and longitudinal ordering that results from hydrodynamic interaction between the particles. The focusing depends on the particle size and on the cross-section geometry and curvature of the channel along which the sample moves [217]. Inertial focusing is simple; it does not depend on external forces and does not require the sheath fluid, which makes it suitable for high-throughput analysis of cells in microfluidic systems [179, 203]. Thus, a device was developed that performed inertial cell focusing in 256 parallel microchannels [218]. However, a particle has to occupy a significant part of the channel cross-section, which must be taken into account when designing inertial microchannels [179].
It should be noted that modern microfluidic flow cytometers often use acoustic focusing, because it does not require creation of channels for the sheath fluid [198, 208, 219, 220].
Encapsulation of individual cells in separate aqueous vesicles with a diameter of tens or hundreds of microns (and with a femto- or nanoliter volume, respectively) and their analysis is another application of microfluidics. The vesicles are isolated from each other by an oil (non-miscible with water) phase. This approach is called droplet microfluidics [201].
In one of the first works on the encapsulation of individual cells, vesicles were created using a T-shaped junction of capillaries: one – for supplying the oil phase; the other – for the cell suspension. During the droplet generation, the oil and suspension flows are stopped. Then, using the optic capture technology, the cell of interest is brought to the oil–water interface. When a slight excessive pressure is applied to the suspension-containing microcapillary, a portion of the aqueous phase (with a cell in it) adjacent to the interface is pushed into the oil phase forming a microvesicle that is picked up by the oil flow [221]. Because of the necessity to direct each cell to the interface manually, the prototype device had a very low throughput. Later, microfluidic systems were developed for encapsulation of individual cells in lipid vesicles surrounded by a continuous aqueous phase [222] and in vesicles of liquid agarose that formed microbeads after cooling [223]; however, the throughput of these prototypes also was low [201].
In many modern microfluidic emulsion systems, oil and aqueous phases are mixed continuously, without stopping the flows, which certainly increases the rate of vesicle formation but makes cell encapsulation a random process. Therefore, to ensure that no more than a single cell gets encapsulated into a vesicle, the majority of vesicles should remain empty; although even in this case, some vesicles will contain multiple cells. For example, if the cell-containing vesicles comprise only ~15% of all vesicles and the remaining vesicles are empty, 10% of these cell-containing vesicles will have two or more cells encapsulated [224]. There are some approaches to avoid this limitation. One of them is based on the fact that cell-containing vesicles are larger than the empty vesicles. By choosing an appropriate geometry of vesicle flow in oil, empty vesicles might be partially separated from the cell-containing ones. Another approach is based on preliminary uniform distribution of the cells in the capillary with the aqueous phase by inertial focusing. In this case, the fraction of vesicles with a single cell can be increased by establishing a spatial order of the cells in flow and synchronizing their entrance into the oil phase with the vesicles formation. However, even these approaches fail the increase the fraction of the single cell-containing vesicles over 70-80% [201].
Since the cell in an emulsion is isolated in a limited volume of the microdrop, molecules at the cell surface or secreted by the cell rapidly achieve detectable concentrations and can be reliably detected by fluorescent methods, which allows very low amounts of biomarkers to be used [201, 225]. For the first time, this approach was used for investigating alkaline phosphatase activity in E. coli cells, when the cells and the substrate were encapsulated in vesicles. Alkaline phosphatase cleaved the substrate with the formation of fluorescent molecule. Later, the same approach was used for investigation of other E. coli enzymes and of receptor activation on the surface of eukaryotic cells upon ligand binding, as well as in the studies of cytokines, antibodies, and other secreted molecules [201, 205, 225].
Studying cells in emulsions has a number of drawbacks. The microenvironment in vesicles (the level of nutrients and gas exchange) is significantly different from the cell environment in vivo; therefore, in some cases, this approach cannot provide an adequate experimental model. When working with cells in emulsions for long periods of time, it is important to take into consideration the risks associated with a possibilities of coalescence (fusion) of the drops, nutrient depletion, or accumulation of toxic metabolites [201, 225]. Moreover, because of the absence of calibration, it is impossible to reliably assess the content of analyzed metabolites, although it is often interesting for the researchers [205]. Also, the throughput of vesicle analysis is usually lower than the throughput of cell analysis in traditional flow cytometry [225].
In conclusion, all methods of cell screening based on one-dimensional format of cell presentation have a common drawback – they lack the reliability and comprehensiveness of cell identification typical for the two-dimensional screening format. Being measured once, the cell cannot be reanalyzed. A researcher obtains a set of spectral data that only indirectly indicate the type of the cell analyzed, whereas the information on most morphological features and subcellular structure is lost [226, 227]. During the analysis, some cells can aggregate, which distorts the results. Very seldom, samples are additionally tested by direct microscopy to obtain more reliable information [228]. Therefore, it is essential to develop and implement cell screening methods that would combine the availability, reliability of identification, and possibility of repeated analysis typical of two-dimensional screening format with the speed of flow cytometry.
MERGED GEL METHOD
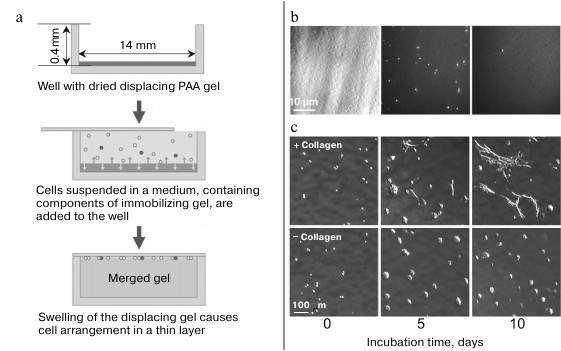
To conclude this review, we consider an approach that combines the availability, reliability of identification and feasibility of repeated analysis of cells characteristic of the 2D screening format with the throughput of flow cytometry and the advantages of 2D and 3D cell cultures. This approach is based on the method of merged gels [229-231]; it comprises two-dimensional format of cell presentation and allows prokaryotic and eukaryotic cells to be both immobilized in a gel and arranged in a thin layer. To do this, cell suspension in a solution containing polyacrylamide (PAA) monomers or molten agarose is poured on the surface of a dried PAA gel. When the dry gel swells, it displaces the cells and collects them on its surface (Fig. 14a). The swelling stops as soon as the upper immobilizing gel is formed, and the cells become fixed in the surrounding matrix. The more the displacing gel swells, the higher is the concentration of the cells and the closer they are to the merged gel surface. Using this approach, E. coli cells placed in a 400 µm-deep well were concentrated more than 200 times into a less than 2 µm-thick layer [230].
Fig. 14. Merged gel technique. a) Merged gel formation (reprinted with modifications from [230] with kind permission from John Wiley and Sons, 2011). b) Screening of E. coli cells in a merged gel. A mixture of GFP-expressing and nonexpressing E. coli cells was embedded in a merged gel. Left: cell layer viewed in the light field mode; all cells are visible. Center: same cells viewed in the fluorescent mode; only GFP-expressing cells (~1% of the population) are visible. Right: fluorescent image of a field with one of seven GFP-expressing cells found among 1.5·107 cells of the monolayer (reprinted with modifications from [230] with kind permission from John Wiley and Sons, 2011). c) The effect of collagen on the growth of embryonic fibroblasts in a merged gel (reprinted with modifications from [231] with kind permission from BioTechniques, 2012).
Unlike the Frost little plates and agarose pads, merged gels tightly pack and firmly immobilize cells in a monolayer – the cells retain their position even when the gel is intensely washed for long periods of time. Such reliable immobilization of all cells in the same plane in the merged gel makes it possible to assign a unique two-dimensional address to each cell, so it could be easily found later. Immobilization makes it easy to influence the cells, e.g., to synchronize their division [72] by rapidly changing the medium composition via simply washing the gel in an appropriate solution. Cell immobilization also gives a possibility to individually monitor each cell in a large population either in real time or at certain time intervals, for example, in the studies of intracellular dynamics [232].
Placing every cell in a gel at the same depth, the merged gels technique ensures uniformity of physicochemical conditions, such as rates of gas exchange, nutrient supply, and waste removal. It is also important that immobilization conditions are mild, without unnecessary mechanical or other types of stress; therefore, almost all cells remain viable and able to multiply in the gel.
It should also be noted that, unlike the agarose pad method, when dividing cells form 2D-colonies that are spread between the pad and the coverslip, bacterial cells immobilized in a merged gel form compact spheroid microcolonies reminiscent of “Lilliputian” bacterial colonies grown on Frost little plates.
The microcolonies of eukaryotic cells in a merged gel are much more compact than colonies growing in 2D-cultures on a plastic surface; their morphology is more typical of 3D-cultures. As in traditional 3D-cultures, the cells are submerged in the agarose matrix that partially mimics the in vivo cell environment. Due to its mechanical properties (stiffness, elasticity), the PAA matrix also contributes to mimicking the cell natural environment [157]. However, unlike traditional 3D-cultures, cells and microcolonies they produce are submerged in the matrix at the same depth, which provides identical physicochemical conditions for all cells and makes them available for simultaneous observation.
To better suit the requirements of various cells, other known natural or synthetic 3D-matrices can be used for cell immobilization instead of agarose [148-150, 233-236]. Also, ECM components can be added to agarose for the optimal development of certain cell types [158, 237-240]. Thus, addition of commercial collagen (mixture of type I and III collagens) promoted the growth of fibroblasts and influenced the morphology of their colonies (Fig. 14c). In this case, collagen was retained in the gel due to mechanical incorporation into the agarose matrix without any covalent attachment to it [241].
The high density of cells in merged gels provides for a high-throughput cell screening. For example, just a few GFP-expressing cells were found among 1.5·107 other bacterial or 2·105 eukaryotic cells within 30 min with a manually controlled (not automated) microscope (Fig. 14b), i.e., the screening rate was ca. 8000 bacterial or 100 eukaryotic cells per second. For bacterial cells, the achieved throughput of manual screening approximated the throughput of automatic flow cytometry (see above). Such a high rate of cell screening in a monolayer was made possible because all cells in the two-dimensional vision field of the microscope were analyzed at once, whereas in the flow cytometry, the cells are analyzed consecutively, one by one.
Although for eukaryotic cells the achieved screening throughput is lower than that in flow cytometry, the two-dimensional format of cell presentation enables analysis of the obtained images and, therefore, increases the detection reliability: each cell can be differentiated from other cells and particles of noncellular origin. Besides, because each cell has its unique address in the gel, cells of interest identified during rapid initial screening can easily be re-located and analyzed in detail. At present, the gels are scanned manually, but this process can significantly be accelerated and made more informative by automation. For instance, it would be possible to quantitatively describe the phenotypic parameters of each cell and to determine their mean values and dispersion for the cell population. The same could be done for the fluorescence intensity of cells or other parameters of interest. The equipment and programs for automated scanning and analysis of two-dimensional cellular chips have been already developed and are available commercially [242-244].
In conclusion, the merged gel-based two-dimensional format of cell presentation combines the advantages of the 1D- and 2D formats of cell screening but lacks their drawbacks. Indeed, the merged gel format combines the high throughput cell screening typical for flow cytometry with the reliability of visualization, possibility of cell reexamination, immobilization of cells under mild nontraumatic and uniform physicochemical conditions characteristic of the two-dimensional format. At the same time, it mimics cell microenvironment in the multicellular organism, which is typical for the 3D-cultures. All this makes the merged gel technique highly competitive and an efficient alternative to the present-day methods of cell screening.
Acknowledgments
The work was supported by the Molecular and Cell Biology Program of the Presidium of the Russian Academy of Sciences and by the Russian Foundation for Basic Research (project No. 16-34-00594).
REFERENCES
1.Koch, R. (1881) Zur Untersuchung von pathogenen
Organismen, Mitth. Kais. Gesundheitsamte, 1, 1-48.
2.Shlegel, G. G. (2002) History of
Microbiology [in Russian], Editorial URSS, Moscow.
3.Petri, R. J. (1887) Eine kleine Modification des
Kochschen Plattenverfahrens, Central. Bacteriol. Parasiten.,
1, 279-280.
4.Thomas, B. T., Effedua, H. I., Musa, O. S.,
Adeyemi, M. T., Adesoga, K. O., Ogundero, O., and Oluwadun, A. (2012)
Enumeration of microorganism in dried cassava powder (Garri); a
comparative study of four methods, New York Sci. J., 5,
63-66.
5.Breed, R. S., and Dotterrer, W. D. (1916) The
number of colonies allowable on satisfactory agar plates, J.
Bacteriol., 1, 321-331.
6.Tomsiewicz, D. M., Hotchkiss, D. K., Reinbold, G.
W., Read, R. B. J., and Hartman, P. A. (1980) The most suitable number
of colonies on plates for counting, J. Food Prot., 43,
282-286.
7.Vieites, J. M., Guazzaroni, M.-E., Beloqui, A.,
Golyshin, P. N., and Ferrer, M. (2010) Molecular methods to study
complex microbial communities, Methods Mol. Biol., 668,
1-37.
8.Ferrer, M., Beloqui, A., Vieites, J. M.,
Guazzaroni, M. E., Berger, I., and Aharoni, A. (2009) Interplay of
metagenomics and in vitro compartmentalization, Microb.
Biotechnol., 2, 31-39.
9.Lee, D.-G., Jeon, J. H., Jang, M. K., Kim, N. Y.,
Lee, J. H., Lee, J.-H., Kim, S.-J., Kim, G.-D., and Lee, S.-H. (2007)
Screening and characterization of a novel fibrinolytic metalloprotease
from a metagenomic library, Biotechnol. Lett., 29,
465-472.
10.Courtois, S., Cappellano, C. M., Ball, M.,
Francou, F.-X., Normand, P., Helynck, G., Martinez, A., Kolvek, S. J.,
Hopke, J., Osburne, M. S., August, P. R., Nalin, R., Guerineau, M.,
Jeannin, P., Simonet, P., and Pernodet, J.-L. (2003) Recombinant
environmental libraries provide access to microbial diversity for drug
discovery from natural products, Appl. Environ. Microbiol.,
69, 49-55.
11.Van Loo, B., Spelberg, J. H. L., Kingma, J.,
Sonke, T., Wubbolts, M. G., and Janssen, D. B. (2004) Directed
evolution of epoxide hydrolase from A. radiobacter toward higher
enantioselectivity by error-prone PCR and DNA shuffling, Chem.
Biol., 11, 981-990.
12.Heim, R., Prasher, D. C., and Tsien, R. Y. (1994)
Wavelength mutations and post-translational autoxidation of green
fluorescent protein, Proc. Natl. Acad. Sci. USA, 91,
12501-12504.
13.Conway, T., Sewell, G. W., Osman, Y. A., and
Ingram, L. O. (1987) Cloning and sequencing of the alcohol
dehydrogenase II gene from Zymomonas mobilis, J.
Bacteriol., 169, 2591-2597.
14.Maullu, C., Lampis, G., Deidda, D., Petruzzelli,
S., and Pompei, R. (1998) A rapid method for screening large numbers of
environmental microorganisms for antiviral activity, Appl. Environ.
Microbiol., 64, 1161-1162.
15.Shcherbo, D., Merzlyak, E. M., Chepurnykh, T. V.,
Fradkov, A. F., Ermakova, G. V., Solovieva, E. A., Lukyanov, K. A.,
Bogdanova, E. A., Zaraisky, A. G., Lukyanov, S., and Chudakov, D. M.
(2007) Bright far-red fluorescent protein for whole-body imaging,
Nat. Methods, 4, 741-746.
16.Wiehler, J., Von Hummel, J., and Steipe, B.
(2001) Mutants of Discosoma red fluorescent protein with a
GFP-like chromophore, FEBS Lett., 487, 384-389.
17.Knietsch, A., Waschkowitz, T., Bowien, S., Henne,
A., and Daniel, R. (2003) Construction and screening of metagenomic
libraries derived from enrichment cultures: generation of a gene bank
for genes conferring alcohol oxidoreductase activity on Escherichia
coli, Appl. Environ. Microbiol., 69, 1408-1416.
18.Knietsch, A., Waschkowitz, T., Bowien, S., Henne,
A., and Daniel, R. (2003) Metagenomes of complex microbial consortia
derived from different soils as sources for novel genes conferring
formation of carbonyls from short-chain polyols on Escherichia
coli, J. Mol. Microbiol. Biotechnol., 5, 46-56.
19.Streit, W. R., and Schmitz, R. A. (2004)
Metagenomics – the key to the uncultured microbes, Curr. Opin.
Microbiol., 7, 492-498.
20.Wang, W. X. (2012) Colony image acquisition and
genetic segmentation algorithm and colony analyses, in Color Imaging
XVII: Displaying, Processing, Hardcopy, and Applications, doi:
10.1117/12.913588.
21.Brugger, S. D., Baumberger, C., Jost, M., Jenni,
W., Brugger, U., and Muhlemann, K. (2012) Automated counting of
bacterial colony forming units on agar plates, PLoS One,
7, e33695.
22.Clarke, M. L., Burton, R. L., Hill, A. N.,
Litorja, M., Nahm, M. H., and Hwang, J. (2010) Low-cost,
high-throughput, automated counting of bacterial colonies,
Cytometry, 77, 790-797.
23.Chen, W.-B., and Zhang, C. (2009) An automated
bacterial colony counting and classification system, Inf. Syst.
Front., 11, 349-368.
24.Joo, H., Arisawa, A., Lin, Z., and Arnold, F. H.
(1999) A high-throughput digital imaging screen for the discovery and
directed evolution of oxygenases, Chem. Biol., 6,
699-706.
25.Terskikh, A., Fradkov, A., Ermakova, G.,
Zaraisky, A., Tan, P., Kajava, A. V., Zhao, X., Lukyanov, S., Matz, M.,
Kim, S., Weissman, I., and Siebert, P. (2000) “Fluorescent
timer”: protein that changes color with time, Science,
290, 1585-1588.
26.Alexeeva, M., Enright, A., Dawson, M. J.,
Mahmoudian, M., and Turner, N. J. (2002) Deracemization of
alpha-methylbenzylamine using an enzyme obtained by in vitro
evolution, Angew. Chem. Int. Ed. Engl., 41,
3177-3180.
27.Handelsman, J. (2005) Sorting out metagenomes,
Nat. Biotechnol., 23, 38-39.
28.Henne, A., Schmitz, R. A., Bomeke, M.,
Gottschalk, G., and Daniel, R. (2000) Screening of environmental DNA
libraries for the presence of genes conferring lipolytic activity on
Escherichia coli, Appl. Environ. Microbiol., 66,
3113-3116.
29.Henne, A., Daniel, R., Schmitz, R. A., and
Gottschalk, G. (1999) Construction of environmental DNA libraries in
Escherichia coli and screening for the presence of genes
conferring utilization of 4-hydroxybutyrate, Appl. Environ.
Microbiol., 65, 3901-3907.
30.Van Sint Fiet, S., Van Beilen, J. B., and
Witholt, B. (2006) Selection of biocatalysts for chemical synthesis,
Proc. Natl. Acad. Sci. USA, 103, 1693-1698.
31.Mirete, S., De Figueras, C. G., and
Gonzalez-Pastor, J. E. (2007) Novel nickel resistance genes from the
rhizosphere metagenome of plants adapted to acid mine drainage,
Appl. Environ. Microbiol., 73, 6001-6011.
32.Lin, H., Tao, H., and Cornish, V. W. (2004)
Directed evolution of a glycosynthase via chemical complementation,
J. Am. Chem. Soc., 126, 15051-15059.
33.Taylor, S. V., Walter, K. U., Kast, P., and
Hilvert, D. (2001) Searching sequence space for protein catalysts,
Proc. Natl. Acad. Sci. USA, 98, 10596-10601.
34.Majernik, A., Gottschalk, G., and Daniel, R.
(2001) Screening of environmental DNA libraries for the presence of
genes conferring Na(+)(Li(+))/H(+) antiporter activity on
Escherichia coli: characterization of the recovered genes and
the corresponding gene products, J. Bacteriol., 183,
6645-6653.
35.Parachin, N. S., and Gorwa-Grauslund, M. F.
(2011) Isolation of xylose isomerases by sequence- and function-based
screening from a soil metagenomic library, Biotechnol. Biofuels,
4, 9.
36.Piel, J., Hui, D., Wen, G., Butzke, D., Platzer,
M., Fusetani, N., and Matsunaga, S. (2004) Antitumor polyketide
biosynthesis by an uncultivated bacterial symbiont of the marine sponge
Theonella swinhoei, Proc. Natl. Acad. Sci. USA,
101, 16222-16227.
37.Piel, J. (2002) A polyketide synthase-peptide
synthetase gene cluster from an uncultured bacterial symbiont of
Paederus beetles, Proc. Natl. Acad. Sci. USA, 99,
14002-14007.
38.Hrvatin, S., and Piel, J. (2007) Rapid isolation
of rare clones from highly complex DNA libraries by PCR analysis of
liquid gel pools, J. Microbiol. Methods, 68, 434-436.
39.Frost, W. D. (1915) Rapid method of counting
bacteria in milk, Science, 42, 255-256.
40.Frost, W. D. (1916) A rapid method of counting
living bacteria in milk and other richly seeded materials, J. Am.
Med. Assoc., 66, 889-890.
41.Frost, W. D. (1921) Improved technique for the
micro or little plate method of counting bacteria in milk, J.
Infect. Dis., 28, 176-184.
42.Tanner, F. W. (1932) The Microbiology of
Foods, The Twin City Printing Co.
43.Frost, W. D. (1916) Comparison of a rapid method
of counting bacteria in milk with the standard plate method, J.
Infect. Dis., 19, 273-287.
44.Frost, W. D. (1917) Counting the living bacteria
in milk — a practical test, J. Bacteriol., 2,
567-583.
45.Simmons, J. E. (1919) A comparison, with the
standard plate method, of some rapid methods for bacteriologic analysis
of milk, J. Bacteriol., 24, 322-336.
46.Nickerson, J. T. R. (1943) A modified little
plate method for bacterial counts in vegetable freezing plants, J.
Food Sci., 8, 163-168.
47.Hatfield, H. M., and Park, W. H. (1922) A study
of the practical value of the frost little plate method in the routine
colony count of milk samples, Am. J. Public Health, 12,
478-487.
48.Bryan, C. S., Scheid, M. V., Neuhauser, M. D.,
Gilbert, B. L., and Turney, G. J. A. (1942) Comparative study of the
frost little plate and standard plate methods for the bacteriological
examination of milk, cream, and ice cream, J. Dairy Sci.,
25, 827-835.
49.Fakhruddin, A. N. M., and Quilty, B. (2007)
Measurement of the growth of a floc forming bacterium Pseudomonas
putida CP1, Biodegradation, 18, 189-197.
50.Jannasch, H. W. (1958) Studies on planktonic
bacteria by means of a direct membrane filter method, J. Gen.
Microbiol., 18, 609-620.
51.Nelson, B. E. (1917) Direct microscopical
counting of bacteria in water, J. Amer. Chem. Soc., 39,
515-523.
52.Besnard, V., Federighi, M., and Cappelier, J. M.
(2000) Development of a direct viable count procedure for the
investigation of VBNC state in Listeria monocytogenes, Lett.
Appl. Microbiol., 31, 77-81.
53.Caruso, G., Mancuso, M., and Crisafi, E. (2003)
Combined fluorescent antibody assay and viability staining for the
assessment of the physiological states of Escherichia coli in
sea waters, J. Appl. Microbiol., 95, 225-233.
54.Daims, H., and Wagner, M. (2007) Quantification
of uncultured microorganisms by fluorescence microscopy and digital
image analysis, Appl. Microbiol. Biotechnol., 75,
237-248.
55.Oliver, J. D. (2005) The viable but nonculturable
state in bacteria, J. Microbiol., 43, 93-100.
56.Pyle, B. H., Broadaway, S. C., and McFeters, G.
A. (1999) Sensitive detection of Escherichia coli O157:H7 in
food and water by immunomagnetic separation and solid-phase laser
cytometry, Appl. Environ. Microbiol., 65, 1966-1972.
57.Besnard, V., Federighi, M., and Cappelier, J.
(2000) Evidence of viable but non-culturable state in Listeria
monocytogenes by direct viable count and CTC-DAPI double staining,
Food Microbiol., 17, 697-704.
58.Jannasch, H. W., and Jones, G. E. (1959)
Bacterial populations in sea water as determined by different methods
of enumeration, Limnol. Ocean., 4, 128-139.
59.Kogure, K., Simidu, U., and Taga, N. (1979) A
tentative direct microscopic method for counting living marine
bacteria, Can. J. Microbiol., 25, 415-420.
60.Meynell, G. G., and Meynell, E. (1970) Theory
and Practice in Experimental Bacteriology, 2nd Edn., CUP Archive,
Cambridge.
61.Gerhardt, Ph. (1983) Manual of Methods for
General Bacteriology [Russian translation], Mir, Moscow.
62.Pijper, A. (1947) Methylcellulose and bacterial
motility, J. Bacteriol., 53, 257-269.
63.Bulloch, W. (1960) The History of
Bacteriology, Oxford University Press, London.
64.Dharma Vijaya, M. N., Umashankar, K. M., Sudha,
Nagure, A. G., and Kavitha, G. (2013) Prevalence of the Trichomonas
vaginalis infection in a tertiary care hospital in rural Bangalore,
Southern India, J. Clin. Diagn. Res., 7, 1401-1403.
65.Wegayehu, T., Adamu, H., and Petros, B. (2013)
Prevalence of Giardia duodenalis and Cryptosporidium
species infections among children and cattle in North Shewa Zone,
Ethiopia, BMC Infect. Dis., 13, 419.
66.Teklemariam, Z., Abate, D., Mitiku, H., and
Dessie, Y. (2013) Prevalence of intestinal parasitic infection among
HIV-positive persons who are naive and on antiretroviral treatment in
Hiwot Fana Specialized University Hospital, Eastern Ethiopia, ISRN
AIDS, 324329.
67.Lee, W. C., Russell, B., Lau, Y. L., Fong, M.-Y.,
Chu, C., Sriprawat, K., Suwanarusk, R., Nosten, F., and Renia, L.
(2013) Giemsa-stained wet mount based method for reticulocyte
quantification: a viable alternative in resource limited or malaria
endemic settings, PLoS One, 8, e60303.
68.Hathaway, W. E., Newby, L. A., and Githens, J. H.
(1964) The acridine orange viability test applied to bone marrow cells.
I. Correlation with trypan blue and eosin dye exclusion and tissue
culture transformation, Blood, 23, 517-525.
69.Freer, S. M. (1984) A permanent wet-mount for
fluorescent microscopy of surface stained lymphoid cells, J.
Immunol. Methods, 66, 187-188.
70.Smith, D. L., and Rommel, F. (1977) A rapid
micromethod for the simultaneous determination of
phagocytic-microbiocidal activity of human peripheral blood leukocytes
in vitro, J. Immunol. Methods, 17, 241-247.
71.Petrovsky, B. V. (1979) in Great Medical
Encyclopedia [in Russian], Vol. 10, Sovetskaya Entsiklopediya,
Moscow.
72.Adams, R. L. P. (1990) Cell Culture for
Biochemists, 2nd Edn., Elsevier, Amsterdam.
73.Semashko, N. A. (1930) in Great Medical
Encyclopedia [in Russian], Vol. 12, Sovetskaya Entsiklopediya,
Moscow, pp. 125-134.
74.Callison, J. G. (1912) A diluting fluid for
standardization of vaccines with the hemocytometer, J. Med.
Res., 27, 225-227.
75.Makler, A. (1978) A new chamber for rapid sperm
count and motility estimation, Fertil. Steril., 30,
313-318.
76.Makler, A. (1980) The improved ten-micrometer
chamber for rapid sperm count and motility evaluation, Fertil.
Steril., 33, 337-338.
77.Makler, A., Fisher, M., and Lissak, A. (1984) A
new method for rapid determination of sperm concentration in bull and
ram semen, Theriogenology, 21, 543-554.
78.Christensen, P., Stryhn, H., and Hansen, C.
(2005) Discrepancies in the determination of sperm concentration using
Buerker–Tuerk, Thoma and Makler counting chambers,
Theriogenology, 63, 992-1003.
79.Lenz, R. W., Kjelland, M. E., Vonderhaar, K.,
Swannack, T. M., and Moreno, J. F. (2011) A comparison of bovine
seminal quality assessments using different viewing chambers with a
computer-assisted semen analyzer, J. Anim. Sci., 89,
383-388.
80.Hoogewijs, M. K., De Vliegher, S. P., Govaere, J.
L., De Schauwer, C., De Kruif, A., and Van Soom, A. (2012) Influence of
counting chamber type on CASA outcomes of equine semen analysis,
Equine Vet. J., 44, 542-549.
81.Coetzee, K., and Menkveld, R. (2001) Validation
of a new disposable counting chamber, Arch. Androl., 47,
153-156.
82.Benitez, L. B., Caumo, K., Brandelli, A., and
Rott, M. B. (2011) Bacteriocin-like substance from Bacillus
amyloliquefaciens shows remarkable inhibition of Acanthamoeba
polyphaga, Parasitol. Res., 108, 687-691.
83.De Queiroz, J. C., Ferreira, A. C., and Da Costa,
A. C. A. (2012) The growth of Monoraphidium sp. and
Scenedesmus sp. cells in the presence of thorium, Sci. World
J., 592721.
84.Xiang, D., Cong, Y., Wang, C., Yue, J., Ma, X.,
Lu, Y., Liu, P., and Ma, J. (2012) Development of microscopic review
criteria by comparison urine flow cytometer, strip and manual
microscopic examination, Clin. Lab., 58, 979-985.
85.Yamanishi, H., Imai, N., Suehisa, E., Kanakura,
Y., and Iwatani, Y. (2007) Determination of leukocyte counts in
cerebrospinal fluid with a disposable plastic hemocytometer, J.
Clin. Lab. Anal., 21, 282-285.
86.Zimmermann, M., Ruprecht, K., Kainzinger, F.,
Heppner, F. L., and Weimann, A. (2011) Automated vs. manual
cerebrospinal fluid cell counts: a work and cost analysis comparing the
Sysmex XE-5000 and the Fuchs–Rosenthal manual counting chamber,
Int. J. Lab. Hematol., 33, 629-637.
87.Blinkova, L. P., Pakhomov, Y. D., and Dmitrieva,
O. V. (2013) Detection of non-cultivated forms of bacteria in
lyophilized preparations of probiotics, J. Microbiol. Epidemiol.
Immunobiol., 3, 83-88.
88.Svistunova, E. V., and Dnisov, L. A. (1988)
Determination of anti-proliferative activity of recombinant human
interferon (reaferon) on human diploid cells, Antibiot.
Khimioter., 33, 513-515.
89.Alekseeva, E. M., Volkova, I. V., Losev, I. R.,
Lemenkov, V. A., and Perevozchikov, S. M. (1996) A unit for automatic
blood cell counting, Med. Tekh., 2, 32-33.
90.Yaqub, S., Anderson, J. G., MacGregor, S. J., and
Rowan, N. J. (2004) Use of a fluorescent viability stain to assess
lethal and sublethal injury in food-borne bacteria exposed to
high-intensity pulsed electric fields, Lett. Appl. Microbiol.,
39, 246-251.
91.Gunasekera, T. S., Sorensen, A., Attfield, P. V.,
Sorensen, S. J., and Veal, D. A. (2002) Inducible gene expression by
nonculturable bacteria in milk after pasteurization, Appl. Environ.
Microbiol., 68, 1988-1993.
92.Hilson, G. R. (1964) A disposable counting
chamber for urinary cytology, J. Clin. Pathol., 17,
571-572.
93.Madu, A. J., Ibegbulam, O. G., Ocheni, S., Madu,
K. A., and Aguwa, E. N. (2011) Absolute neutrophil values in malignant
patients on cytotoxic chemotherapy, Niger. J. Med., 20,
120-123.
94.Sukcharoen, N., Ngeamjirawat, J., Chanprasit, Y.,
and Aribarg, A. (1994) A comparison of Makler counting chamber and
improved Neubauer hemocytometer in sperm concentration measurement,
J. Med. Assoc. Thai., 77, 471-476.
95.Metzler-Zebeli, B. U., Schmitz-Esser, S.,
Klevenhusen, F., Podstatzky-Lichtenstein, L., Wagner, M., and Zebeli,
Q. (2013) Grain-rich diets differently alter ruminal and colonic
abundance of microbial populations and lipopolysaccharide in goats,
Anaerobe, 20, 65-73.
96.Hundt, W., Steinbach, S.,
O’Connell-Rodwell, C. E., Bednarski, M. D., and Guccione, S.
(2009) The effect of high intensity focused ultrasound on luciferase
activity on two tumor cell lines in vitro, under the control of
a CMV promoter, Ultrasonics, 49, 312-318.
97.Makdoumi, K., Backman, A., Mortensen, J.,
Magnuson, A., and Crafoord, S. (2013) Comparison of UVA- and
UVA/riboflavin-induced growth inhibition of Acanthamoeba
castellanii, Graefes Arch. Clin. Exp. Ophthalmol.,
251, 509-514.
98.Collins, C. E., Young, N. A., Flaherty, D. K.,
Airey, D. C., and Kaas, J. H. (2010) A rapid and reliable method of
counting neurons and other cells in brain tissue: a comparison of flow
cytometry and manual counting methods, Front. Neuroanat.,
4, 5.
99.Strober, W. (2001) Monitoring cell growth,
Curr. Protoc. Immunol., Appendix 3A.
100.Norris, K., and Powell, E. O. (1961)
Improvements in determining total counts of bacteria, J. R. Microsc.
Soc., 80, 107-119.
101.Beck, M., Brockhuis, S., Van der Velde, N.,
Breukers, C., Greve, J., and Terstappen, L. W. (2012) On-chip sample
preparation by controlled release of antibodies for simple CD4
counting, Lab Chip, 12, 167-173.
102.Razumov, A. S. (1932) A direct method of
bacteria counting in water. Its comparison with the method of Koch,
Mikrobiologiya, 1, 131-146.
103.Richards, O. W., and Krabek, W. B. (1954)
Visibilizing microorganisms on membrane filter surface, J.
Bacteriol., 67, 613.
104.Ecker, R. E., and Lockhart, W. R. (1959) A
rapid membrane filter method for direct counts of microorganisms from
small samples, J. Bacteriol., 77, 173-176.
105.Ehrlich, R. (1960) Application of membrane
filters, Adv. Appl. Microbiol., 2, 95-112.
106.Ehrlich, R. (1955) Technique for microscopic
count of microorganisms directly on membrane filters, J.
Bacteriol., 70, 265-268.
107.Bogosian, G., Aardema, N. D., Bourneuf, E. V.,
Morris, P. J., and O’Neil, J. P. (2000) Recovery of hydrogen
peroxide-sensitive culturable cells of Vibrio vulnificus gives
the appearance of resuscitation from a viable but nonculturable state,
J. Bacteriol., 182, 5070-5075.
108.Hobbie, J. E., Daley, R. J., and Jasper, S.
(1977) Use of Nuclepore filters for counting bacteria by fluorescence
microscopy, Appl. Environ. Microbiol., 33, 1225-1228.
109.Sekar, R., Fuchs, B. M., Amann, R., and
Pernthaler, J. (2004) Flow sorting of marine bacterioplankton after
fluorescence in situ hybridization, Appl. Environ. Microbiol.,
70, 6210-6219.
110.Banning, N., Toze, S., and Mee, B. J. (2003)
Persistence of biofilm-associated Escherichia coli and
Pseudomonas aeruginosa in groundwater and treated effluent in a
laboratory model system, Microbiology, 149, 47-55.
111.Durtschi, J. D., Erali, M., Bromley, L. K.,
Herrmann, M. G., Petti, C. A., Smith, R. E., and Voelkerding, K. V.
(2005) Increased sensitivity of bacterial detection in cerebrospinal
fluid by fluorescent staining on low-fluorescence membrane filters,
J. Med. Microbiol., 54, 843-850.
112.Ogawa, M., Tani, K., Ochiai, A., Yamaguchi, N.,
and Nasu, M. (2005) Multicolour digital image analysis system for
identification of bacteria and concurrent assessment of their
respiratory activity, J. Appl. Microbiol., 98,
1101-1106.
113.Haller, C., Rolleke, S., Vybiral, D., Witte,
A., and Velimirov, B. (2000) Investigation of 0.2 µm filterable
bacteria from the Western Mediterranean Sea using a molecular approach:
dominance of potential starvation forms, FEMS Microbiol. Ecol.,
31, 153-161.
114.Klieneberger-Nobel, E. (1951) Filterable forms
of bacteria, Bacteriol. Rev., 15, 77-103.
115.Levin, P. A. (2002) Light microscopy techniques
for bacterial cell biology, Methods Microbiol., 31,
115-132.
116.Miyashiro, T., and Goulian, M. (2007)
Single-cell analysis of gene expression by fluorescence microscopy,
Methods Enzymol., 423, 458-475.
117.Skinner, S. O., Sepulveda, L. A., Xu, H., and
Golding, I. (2013) Measuring mRNA copy number in individual
Escherichia coli cells using single-molecule fluorescent in situ
hybridization, Nat. Protoc., 8, 1100-1113.
118.Young, J. W., Locke, J. C. W., Altinok, A.,
Rosenfeld, N., Bacarian, T., Swain, P. S., Mjolsness, E., and Elowitz,
M. B. (2012) Measuring single-cell gene expression dynamics in bacteria
using fluorescence time-lapse microscopy, Nat. Protoc.,
7, 80-88.
119.Elowitz, M. B., Levine, A. J., Siggia, E. D.,
and Swain, P. S. (2002) Stochastic gene expression in a single cell,
Science, 297, 1183-1186.
120.Stewart, E. J., Madden, R., Paul, G., and
Taddei, F. (2005) Aging and death in an organism that reproduces by
morphologically symmetric division, PLoS Biol., 3,
e45.
121.Suel, G. M., Garcia-Ojalvo, J., Liberman, L.
M., and Elowitz, M. B. (2006) An excitable gene regulatory circuit
induces transient cellular differentiation, Nature, 440,
545-550.
122.Paul, J. (1960) Cell and Tissue Culture,
Livingstone Ltd., Edinburgh.
123.Zicha, D., and Dunn, G. A. (1995) An image
processing system for cell behavior studies in subconfluent cultures,
J. Microsc., 179, 11-21.
124.Mashanov, G. I., and Molloy, J. E. (2007)
Automatic detection of single fluorophores in live cells, Biophys.
J., 92, 2199-2211.
125.Gu, Y., Di, W. L., Kelsell, D. P., and Zicha,
D. (2004) Quantitative fluorescence resonance energy transfer (FRET)
measurement with acceptor photobleaching and spectral unmixing, J.
Microsc., 215, 162-173.
126.Zicha, D., Dobbie, I. M., Holt, M. R.,
Monypenny, J., Soong, D. Y. H., Gray, C., and Dunn, G. A. (2003) Rapid
actin transport during cell protrusion, Science, 300,
142-145.
127.Dunn, G. A., Dobbie, I. M., Monypenny, J.,
Holt, M. R., and Zicha, D. (2002) Fluorescence localization after
photobleaching (FLAP): a new method for studying protein dynamics in
living cells, J. Microsc., 205, 109-112.
128.Maroudas, N. G. (1977) Sulfonated polystyrene
as an optimal substratum for the adhesion and spreading of mesenchymal
cells in monovalent and divalent saline solutions, J. Cell.
Physiol., 90, 511-519.
129.Amstein, C. F., and Hartman, P. A. (1975)
Adaptation of plastic surfaces for tissue culture by glow discharge,
J. Clin. Microbiol., 2, 46-54.
130.Curtis, A. S., Forrester, J. V., McInnes, C.,
and Lawrie, F. (1983) Adhesion of cells to polystyrene surfaces, J.
Cell Biol., 97, 1500-1506.
131.Yamaguchi, S., Matsunuma, E., and Nagamune, T.
(2011) Immobilized culture and transfection microarray of non-adherent
cells, Methods Mol. Biol., 706, 151-157.
132.Kato, K., Umezawa, K., Funeriu, D. P., Miyake,
M., Miyake, J., and Nagamune, T. (2003) Immobilized culture of
non-adherent cells on an oleyl poly(ethylene glycol) ether-modified
surface, Biotechniques, 35, 1014-1021.
133.Mangoni, M. L., Papo, N., Barra, D., Simmaco,
M., Bozzi, A., Di Giulio, A., and Rinaldi, A. C. (2004) Effects of the
antimicrobial peptide temporin L on cell morphology, membrane
permeability and viability of Escherichia coli, Biochem.
J., 380, 859-865.
134.Alberts, B., Bray, D., Lewis, J., Raff, M.,
Roberts, K., and Watson, J. D. (1994) Molecular Biology of the
Cell, 3rd Edn., Garland Publishing, New York-London.
135.Swift, L. L., Farkas, M. H., Major, A. S.,
Valyi-Nagy, K., Linton, M. F., and Fazio, S. (2001) A recycling pathway
for resecretion of internalized apolipoprotein E in liver cells, J.
Biol. Chem., 276, 22965-229670.
136.Ivankovic-Dikic, I., Gronroos, E., Blaukat, A.,
Barth, B. U., and Dikic, I. (2000) Pyk2 and FAK regulate neurite
outgrowth induced by growth factors and integrins, Nat. Cell
Biol., 2, 574-581.
137.Miller, K. A., Eklund, E. A., Peddinghaus, M.
L., Cao, Z., Fernandes, N., Turk, P. W., Thimmapaya, B., and Weitzman,
S. A. (2001) Kruppel-like factor 4 regulates laminin alpha 3A
expression in mammary epithelial cells, J. Biol. Chem.,
276, 42863-42868.
138.Wan, L. Q., Ronaldson, K., Park, M., Taylor,
G., Zhang, Y., Gimble, J. M., and Vunjak-Novakovic, G. (2011)
Micropatterned mammalian cells exhibit phenotype-specific left-right
asymmetry, Proc. Natl. Acad. Sci. USA, 108,
12295-12300.
139.Lavoie, J. N., Champagne, C., Gingras, M. C.,
and Robert, A. (2000) Adenovirus E4 open reading frame 4-induced
apoptosis involves dysregulation of Src family kinases, J. Cell
Biol., 150, 1037-1056.
140.Nakano, J., Yasui, H., Lloyd, K. O., and Muto,
M. (1999) Biologic roles of gangliosides G(M3) and G(D3) in the
attachment of human melanoma cells to extracellular matrix proteins,
J. Investig. Dermatol. Symp. Proc., 4, 173-176.
141.Read, M. A., Whitley, M. Z., Gupta, S., Pierce,
J. W., Best, J., Davis, R. J., and Collins, T. (1997) Tumor necrosis
factor alpha-induced E-selectin expression is activated by the nuclear
factor-kappaB and c-JUN N-terminal kinase/p38 mitogen-activated protein
kinase pathways, J. Biol. Chem., 272, 2753-2761.
142.Laurance, M. E., Kwok, R. P., Huang, M. S.,
Richards, J. P., Lundblad, J. R., and Goodman, R. H. (1997)
Differential activation of viral and cellular promoters by human T-cell
lymphotropic virus-1 tax and cAMP-responsive element modulator
isoforms, J. Biol. Chem., 272, 2646-2651.
143.Kuhn, T. B., Brown, M. D., and Bamburg, J. R.
(1998) Rac1-dependent actin filament organization in growth cones is
necessary for beta1-integrin-mediated advance but not for growth on
poly-D-lysine, J. Neurobiol., 37, 524-540.
144.Sugawara, T., Tsurubuchi, Y., Agarwala, K. L.,
Ito, M., Fukuma, G., Mazaki-Miyazaki, E., Nagafuji, H., Noda, M.,
Imoto, K., Wada, K., Mitsudome, A., Kaneko, S., Montal, M., Nagata, K.,
Hirose, S., and Yamakawa, K. (2001) A missense mutation of the
Na+ channel alpha II subunit gene Na(v)1.2 in a patient with
febrile and afebrile seizures causes channel dysfunction, Proc.
Natl. Acad. Sci. USA, 98, 6384-6389.
145.Santambrogio, L., Belyanskaya, S. L., Fischer,
F. R., Cipriani, B., Brosnan, C. F., Ricciardi-Castagnoli, P., Stern,
L. J., Strominger, J. L., and Riese, R. (2001) Developmental plasticity
of CNS microglia, Proc. Natl. Acad. Sci. USA, 98,
6295-6300.
146.Tanner, S. L., Franzen, R., Jaffe, H., and
Quarles, R. H. (2000) Evidence for expression of some
microtubule-associated protein 1B in neurons as a plasma membrane
glycoprotein, J. Neurochem., 75, 553-562.
147.Bissell, M. J., Rizki, A., and Mian, I. S.
(2003) Tissue architecture: the ultimate regulator of breast epithelial
function, Curr. Opin. Cell Biol., 15, 753-762.
148.Tibbitt, M. W., and Anseth, K. S. (2009)
Hydrogels as extracellular matrix mimics for 3D cell culture,
Biotechnol. Bioeng., 103, 655-663.
149.Zhang, S. (2004) Beyond the Petri dish, Nat.
Biotechnol., 22, 151-152.
150.Griffith, L. G., and Swartz, M. A. (2006)
Capturing complex 3D tissue physiology in vitro, Nat. Rev.
Mol. Cell Biol., 7, 211-224.
151.Elsdale, T., and Bard, J. (1972) Collagen
substrata for studies on cell behavior, J. Cell Biol.,
54, 626-637.
152.Pampaloni, F., Reynaud, E. G., and Stelzer, E.
H. K. (2007) The third dimension bridges the gap between cell culture
and live tissue, Nat. Rev. Mol. Cell Biol., 8,
839-845.
153.Weaver, V. M., Petersen, O. W., Wang, F.,
Larabell, C. A., Briand, P., Damsky, C., and Bissell, M. J. (1997)
Reversion of the malignant phenotype of human breast cells in
three-dimensional culture and in vivo by integrin blocking
antibodies, J. Cell Biol., 137, 231-245.
154.Roskelley, C. D., Desprez, P. Y., and Bissell,
M. J. (1994) Extracellular matrix-dependent tissue-specific gene
expression in mammary epithelial cells requires both physical and
biochemical signal transduction, Proc. Natl. Acad. Sci. USA,
91, 12378-12382.
155.Yamada, K. M., and Cukierman, E. (2007)
Modeling tissue morphogenesis and cancer in 3D, Cell,
130, 601-610.
156.Bissell, M. J., Radisky, D. C., Rizki, A.,
Weaver, V. M., and Petersen, O. W. (2002) The organizing principle:
microenvironmental influences in the normal and malignant breast,
Differentiation, 70, 537-546.
157.Engler, A. J., Sen, S., Sweeney, H. L., and
Discher, D. E. (2006) Matrix elasticity directs stem cell lineage
specification, Cell, 126, 677-689.
158.Sabeh, F., Shimizu-Hirota, R., and Weiss, S. J.
(2009) Protease-dependent versus-independent cancer cell invasion
programs: three-dimensional amoeboid movement revisited, J. Cell
Biol., 185, 11-19.
159.Buxboim, A., Ivanovska, I. L., and Discher, D.
E. (2010) Matrix elasticity, cytoskeletal forces and physics of the
nucleus: how deeply do cells “feel” outside and in? J.
Cell Sci., 123, 297-308.
160.Zegers, M. M. P., O’Brien, L. E., Yu, W.,
Datta, A., and Mostov, K. E. (2003) Epithelial polarity and
tubulogenesis in vitro, Trends Cell Biol., 13,
169-176.
161.Pampaloni, F., and Stelzer, E. (2010)
Three-dimensional cell cultures in toxicology, Biotechnol. Genet.
Eng. Rev., 26, 117-138.
162.Pampaloni, F., Stelzer, E. H. K., and Masotti,
A. (2009) Three-dimensional tissue models for drug discovery and
toxicology, Recent Pat. Biotechnol., 3, 103-117.
163.Lee, G. Y., Kenny, P. A., Lee, E. H., and
Bissell, M. J. (2007) Three-dimensional culture models of normal and
malignant breast epithelial cells, Nat. Methods, 4,
359-365.
164.Wang, Y. L., and Pelham, R. J. (1998)
Preparation of a flexible, porous polyacrylamide substrate for
mechanical studies of cultured cells, Methods Enzymol.,
298, 489-496.
165.Moldavan, A. (1934) Photoelectric technique for
the counting of microscopical cells, Science, 80,
188-189.
166.Givan, A. L. (2011) Flow cytometry: an
introduction, Methods Mol. Biol., 699, 1-29.
167.Cornwall, J. B., and Davison, R. M. (1960)
Rapid counter for small particles in suspension, J. Sci.
Instrum., 37, 414-417.
168.Gucker, F. T., and O’Konski, C. T. (1947)
A photoelectronic counter for colloidal particles, J. Am. Chem.
Soc., 69, 2422-2431.
169.Beirne, T., and Hutcheon, J. M. (1957) A
photoelectric particle counter for use in the sieve range, J. Sci.
Instrum., 34, 196-200.
170.Coulter, W. H. (1953) Means for counting
particles suspended in a fluid, Patent US2656508 (A).
171.Bakke, A. C. (2001) The principles of flow
cytometry, Lab. Med., 32, 207-211.
172.Guo, J., Pui, T. S., Ban, Y.-L., Rahman, A.,
and Kang, Y. (2013) Electrokinetic analysis of cell translocation in
low-cost microfluidic cytometry for tumor cell detection and
enumeration, IEEE Trans. Biomed. Eng., 60, 3269-3275.
173.Yang, W., Huang, H., Wang, Y., Yu, X., and
Yang, Z. (2013) High red blood cell distribution width is closely
associated with nonalcoholic fatty liver disease, Eur. J.
Gastroenterol. Hepatol., 26, 174-178.
174.Zhang, W., McLamore, E. S., Garland, N. T.,
Leon, J. V. C., and Banks, M. K. (2013) A simple method for quantifying
biomass cell and polymer distribution in biofilms, J. Microbiol.
Methods, 94, 367-374.
175.Kamentsky, L. A., Melamed, M. R., and Derman,
H. (1965) Spectrophotometer: new instrument for ultrarapid cell
analysis, Science, 150, 630-631.
176.Dittrich, W., and Gohde, W. (1969) Impulse
fluorometry of single cells in suspension, Z. Naturforsch. B,
24b, 221-228.
177.VanDilla, M. A., Trujillo, T. T., Mullaney, P.
F., and Coulter, J. R. (1969) Cell microfluorometry: a method for rapid
fluorescence measurement, Science, 163, 1213-1214.
178.Crosland-Taylor, P. J. (1953) A device for
counting small particles suspended in a fluid through a tube,
Nature, 171, 37-38.
179.Piyasena, M. E., and Graves, S. W. (2014) The
intersection of flow cytometry with microfluidics and microfabrication,
Lab Chip, 14, 1044-1059.
180.Radcliff, G., and Jaroszeski, M. J. (1998)
Basics of flow cytometry, Methods Mol. Biol., 91,
1-24.
181.Nebevon Caron, G., and Badley, R. A. (1996)
Bacterial characterization by flow cytometry, in Flow Cytometry
Applications in Cell Culture (Al-Rubeai, M., and Emery, N., eds.)
Marcel Dekker, Inc., New York-Hong Kong, pp. 257-290.
182.Givan, L. A. (2001) Flow Cytometry: First
Principles, 2nd Edn., Wiley-Liss, Inc., N. Y.
183.Ibrahim, S. F., and Van den Engh, G. (2007)
Flow cytometry and cell sorting, Adv. Biochem. Eng. Biotechnol.,
106, 19-39.
184.Davey, H. M., and Kell, D. B. (1996) Flow
cytometry and cell sorting of heterogeneous microbial populations: the
importance of single-cell analyses, Microbiol. Rev., 60,
641-696.
185.Davey, H. M., and Winson, M. K. (2003) Using
flow cytometry to quantify microbial heterogeneity, Curr. Issues
Mol. Biol., 5, 9-15.
186.Chen, G., Hayhurst, A., Thomas, J. G., Harvey,
B. R., Iverson, B. L., and Georgiou, G. (2001) Isolation of
high-affinity ligand-binding proteins by periplasmic expression with
cytometric screening (PECS), Nat. Biotechnol., 19,
537-542.
187.Kalyuzhnaya, M. G., Zabinsky, R., Bowerman, S.,
Baker, D. R., Lidstrom, M. E., and Chistoserdova, L. (2006)
Fluorescence in situ hybridization-flow cytometry-cell sorting-based
method for separation and enrichment of type I and type II methanotroph
populations, Appl. Environ. Microbiol., 72,
4293-4301.
188.Ward, M., Turner, P., DeJohn, M., and Kaduchak,
G. (2009) Fundamentals of acoustic cytometry, Curr. Protoc.
Cytom., 49, 1.22.1-1.22.12.
189.Kundt, A., and Lehmann, O. (1874) Ueber
longitudinale Schwingungen und Klangfiguren in cylindrischen
Flüssigkeitssäulen, Ann. Phys. Chemie, 229,
1-12.
190.Curtis, H., and Stephans, E. (1982) Ultrasonic
continuous flow plasmapheresis separator, IBM Tech. Disc. Bull.,
25, 192-193.
191.Coakley, W. T., Bardsley, D. W., Grundy, M. A.,
Zamani, F., and Clarke, D. J. (1989) Cell manipulation in ultrasonic
standing wave fields, J. Chem. Technol. Biotechnol., 1,
43-62.
192.Coakley, W. T., Hawkes, J. J., Sobanski, M. A.,
Cousins, C. M., and Spengler, J. (2000) Analytical scale ultrasonic
standing wave manipulation of cells and microparticles,
Ultrasonics, 38, 638-641.
193.Yasuda, K., Haupt, S. S., Umemura, S., Yagi,
T., Nishida, M., and Shibata, Y. (1997) Using acoustic radiation force
as a concentration method for erythrocytes, J. Acoust. Soc. Am.,
102, 642-645.
194.Goddard, G., and Kaduchak, G. (2005) Ultrasonic
particle concentration in a line-driven cylindrical tube, J. Acoust.
Soc. Am., 117, 3440-3447.
195.Goddard, G., Martin, J. C., Graves, S. W., and
Kaduchak, G. (2006) Ultrasonic particle-concentration for sheathless
focusing of particles for analysis in a flow cytometer, Cytometry
A, 69, 66-74.
196.Goddard, G. R., Sanders, C. K., Martin, J. C.,
Kaduchak, G., and Graves, S. W. (2007) Analytical performance of an
ultrasonic particle focusing flow cytometer, Anal. Chem.,
79, 8740-8746.
197.Austin Suthanthiraraj, P. P., and Graves, S. W.
(2013) Fluidics, Curr. Protoc. Cytom., 65,
1.2.1-1.2.22.
198.Piyasena, M. E., Austin Suthanthiraraj, P. P.,
Applegate, R. W., Jr., Goumas, A. M., Woods, T. A., Lopez, G. P., and
Graves, S. W. (2012) Multinode acoustic focusing for parallel flow
cytometry, Anal. Chem., 84, 1831-1839.
199.Goix, P. J. (2004) Method and apparatus for
detecting microparticles in fluid samples, Patent US 6710871 B1.
200.Huh, D., Gu, W., Kamotani, Y., Grotberg, J. B.,
and Takayama, S. (2005) Microfluidics for flow cytometric analysis of
cells and particles, Physiol. Meas., 26, R73-R98.
201.Wen, N., Zhao, Z., Fan, B., Chen, D., Men, D.,
Wang, J., and Chen, J. (2016) Development of droplet microfluidics
enabling high-throughput single-cell analysis, Molecules,
21, 1-13.
202.Chen, J., Xue, C., Zhao, Y., Chen, D., Wu, M.
H., and Wang, J. (2015) Microfluidic impedance flow cytometry enabling
high-throughput single-cell electrical property characterization,
Int. J. Mol. Sci., 16, 9804-9830.
203.Reece, A., Xia, B., Jiang, Z., Noren, B.,
McBride, R., and Oakey, J. (2016) Microfluidic techniques for high
throughput single cell analysis, Curr. Opin. Biotechnol.,
40, 90-96.
204.Folch, A. (2013) Introduction to
BioMEMS, CRC Press, Taylor and Francis Group, Boca Raton.
205.Fan, B., Li, X., Chen, D., Peng, H., Wang, J.,
and Chen, J. (2016) Development of microfluidic systems enabling
high-throughput single-cell protein characterization, Sensors
(Basel), 16, 1-12.
206.Evstrapov, A. A. (2011) Microfluidic chips for
biological and medical investigations, J. Mendeleev Ros. Khim.
Obshch., 55, 99-110.
207.Evstrapov, A. A., Lukashenko, T. A.,
Rudnitskaya, G. E., Bulyanitsa, A. L., Kurochkin, V. E., Gusev, V. S.,
Ivanov, O. G., Berkutova, I. F., and Savitskaya, A. A. (2012)
Microfluidic chips from glass materials, Nauch. Pribor.,
22, 27-43.
208.Frankowski, M., Theisen, J., Kummrow, A.,
Simon, P., Ragusch, H., Bock, N., Schmidt, M., and Neukammer, J. (2013)
Microflow cytometers with integrated hydrodynamic focusing,
Sensors (Basel), 13, 4674-4693.
209.Sobek, D. (1997) Microfabricated Merged
Silica Flow Chambers for Flow Cytometry, Thesis Ph. D. Cambridge,
Massachusetts Institute of Technology.
210.Daniele, M. A., Boyd, D. A., Mott, D. R., and
Ligler, F. S. (2015) 3D hydrodynamic focusing microfluidics for
emerging sensing technologies, Biosens. Bioelectron., 67,
25-34.
211.Lee, G., Chang, C., Huang, S., and Yang, R.
(2006) The hydrodynamic focusing effect inside rectangular
microchannels, J. Micromech. Microeng., 16,
1024-1032.
212.Simonnet, C., and Groisman, A. (2005)
Two-dimensional hydrodynamic focusing in a simple microfluidic device,
Appl. Phys. Lett., 87, doi: 10.1063/1.2046729.
213.Simonnet, C., and Groisman, A. (2006)
High-throughput and high resolution flow cytometry in molded
microfluidic devices, Anal. Chem., 78, 5653-5663.
214.Villarruel, C. A., Lou, J. W., and Schermer, R.
(2012) Tubular Array for Fluidic Focusing with Integrated Optical
Access Region, Patent US 8651138 B2.
215.Kummrow, A., Theisen, J., Frankowski, M.,
Tuchscheerer, A., Yildirim, H., Brattke, K., Schmidt, M., and
Neukammer, J. (2009) Microfluidic structures for flow cytometric
analysis of hydrodynamically focused blood cells fabricated by
ultraprecision micromachining, Lab Chip, 9,
972-981.
216.Frankowski, M., Bock, N., Kummrow, A.,
Schadel-Ebner, S., Schmidt, M., Tuchscheerer, A., and Neukammer, J.
(2011) A microflow cytometer exploited for the immunological
differentiation of leukocytes, Cytometry A, 79,
613-624.
217.Oakey, J., Applegate, R. W., Jr.,
Arellano, E., Di Carlo, D., Graves, S. W., and Toner, M. (2010)
Particle focusing in staged inertial microfluidic devices for flow
cytometry, Anal. Chem., 82, 3862-3867.
218.Hur, S. C., Tse, H. T. K., and Di Carlo, D.
(2010) Sheathless inertial cell ordering for extreme throughput flow
cytometry, Lab Chip, 10, 274-280.
219.Lenshof, A., Magnusson, C., and Laurell, T.
(2012) Acoustofluidics 8: applications of acoustophoresis in continuous
flow microsystems, Lab Chip, 12, 1210.
220.Yang, A. H. J., and Soh, H. T. (2012)
Acoustophoretic sorting of viable mammalian cells in a microfluidic
device, Anal. Chem., 84, 10756-10762.
221.He, M., Edgar, J. S., Jeffries, G. D., Lorenz,
R. M., Shelby, J. P., and Chiu, D. T. (2005) Selective encapsulation of
single cells and subcellular organelles into picoliter- and
femtoliter-volume droplets, Anal. Chem., 77,
1539-1544.
222.Tan, Y. C., Hettiarachchi, K., Siu, M., Pan, Y.
R., and Lee, A. P. (2006) Controlled microfluidic encapsulation of
cells, proteins, and microbeads in lipid vesicles, J. Am. Chem.
Soc., 128, 5656-5658.
223.Luo, D., Pullela, S. R., Marquez, M., and
Cheng, Z. (2007) Cell encapsules with tunable transport and mechanical
properties, Biomicrofluidics, 1, 34102.
224.Edd, J. F., Di Carlo, D., Humphry, K. J.,
Koster, S., Irimia, D., Weitz, D. A., and Toner, M. (2008) Controlled
encapsulation of single-cells into monodisperse picolitre drops, Lab
Chip, 8, 1262-1264.
225.Lindstrom, S., and Andersson-Svahn, H. (2010)
Overview of single-cell analyses: microdevices and applications, Lab
Chip, 10, 3363-3372.
226.Mahieu, S., Vertessen, F., and Van der Planken,
M. (2004) Evaluation of ADVIA 120 CSF assay (Bayer) vs. chamber
counting of cerebrospinal fluid specimens, Clin. Lab. Haematol.,
26, 195-199.
227.Wlodkowic, D., and Cooper, J. M. (2010)
Microfluidic cell arrays in tumor analysis: new prospects for
integrated cytomics, Expert Rev. Mol. Diagn., 10,
521-530.
228.Caroprese, M., Marzano, A., Schena, L., and
Sevi, A. (2008) Technical note: immunomagnetic procedure for positive
selection of macrophages in ovine milk, J. Dairy Sci.,
91, 1908-1912.
229.Chetverin, A. B., Chetverina, H. V., and
Samatov, T. R. (2007) Non-invasive Molecular Colony Methods, Kits
and Apparatus, Patent EP1999268.
230.Gordeev, A. A., Samatov, T. R., Chetverina, H.
V., and Chetverin, A. B. (2011) 2D-format for screening bacterial cells
at the throughput of flow cytometry, Biotechnol. Bioeng.,
108, 2682-2690.
231.Gordeev, A. A., Chetverina, H. V., and
Chetverin, A. B. (2012) Planar arrangement of eukaryotic cells in
merged hydrogels combines the advantages of 3-D and 2-D cultures,
Biotechniques, 52, 325-331.
232.Eden, E., Geva-Zatorsky, N., Issaeva, I.,
Cohen, A., Dekel, E., Danon, T., Cohen, L., Mayo, A., and Alon, U.
(2011) Proteome half-life dynamics in living human cells,
Science, 331, 764-768.
233.Gaggioli, C., Hooper, S., Hidalgo-Carcedo, C.,
Grosse, R., Marshall, J. F., Harrington, K., and Sahai, E. (2007)
Fibroblast-led collective invasion of carcinoma cells with differing
roles for Rho GTPases in leading and following cells, Nat. Cell
Biol., 9, 1392-1400.
234.Kraehenbuehl, T. P., Langer, R., and Ferreira,
L. S. (2011) Three-dimensional biomaterials for the study of human
pluripotent stem cells, Nat. Methods, 8, 731-736.
235.Shapira-Schweitzer, K., Habib, M., Gepstein,
L., and Seliktar, D. (2009) A photopolymerizable hydrogel for 3-D
culture of human embryonic stem cell-derived cardiomyocytes and rat
neonatal cardiac cells, J. Mol. Cell. Cardiol., 46,
213-224.
236.Cukierman, E., Pankov, R., Stevens, D. R., and
Yamada, K. M. (2001) Taking cell-matrix adhesions to the third
dimension, Science, 294, 1708-1712.
237.Katz, E., Dubois-Marshall, S., Sims, A. H.,
Gautier, P., Caldwell, H., Meehan, R. R., and Harrison, D. J. (2011) An
in vitro model that recapitulates the epithelial to mesenchymal
transition (EMT) in human breast cancer, PLoS One, 6,
e17083.
238.Katz, E., Dubois-Marshall, S., Sims, A. H.,
Faratian, D., Li, J., Smith, E. S., Quinn, J. A., Edward, M., Meehan,
R. R., Evans, E. E., Langdon, S. P., and Harrison, D. J. (2010) A gene
on the HER2 amplicon, C35, is an oncogene in breast cancer whose
actions are prevented by inhibition of Syk, Br. J. Cancer,
103, 401-410.
239.Amjad, S. B., Carachi, R., and Edward, M.
(2007) Keratinocyte regulation of TGF-beta and connective tissue growth
factor expression: a role in suppression of scar tissue formation,
Wound Rep. Regen., 15, 748-755.
240.Serebriiskii, I., Castello-Cros, R., Lamb, A.,
Golemis, E. A., and Cukierman, E. (2008) Fibroblast-derived 3D matrix
differentially regulates the growth and drug-responsiveness of human
cancer cells, Matrix Biol., 27, 573-585.
241.Ulrich, T. A., Jain, A., Tanner, K., MacKay, J.
L., and Kumar, S. (2010) Probing cellular mechanobiology in
three-dimensional culture with collagen-agarose matrices,
Biomaterials, 31, 1875-1884.
242.Ozaki, Y., Uda, S., Saito, T. H., Chung, J.,
Kubota, H., and Kuroda, S. (2010) A quantitative image cytometry
technique for time series or population analyses of signaling networks,
PLoS One, 5, e9955.
243.Henriksen, M., Miller, B., Newmark, J.,
Al-Kofahi, Y., and Holden, E. (2011) Laser scanning cytometry and its
applications: a pioneering technology in the field of quantitative
imaging cytometry, Methods Cell Biol., 102, 161-205.
244.Conrad, C., Wunsche, A., Tan, T. H.,
Bulkescher, J., Sieckmann, F., Verissimo, F., Edelstein, A., Walter,
T., Liebel, U., Pepperkok, R., and Ellenberg, J. (2011) Micropilot:
automation of fluorescence microscopy-based imaging for systems
biology, Nat. Methods, 8, 246-249.
245.Webster, G. A., Bowles, M. J., Karim, M. S.,
Wood, R. F., and Pockley, A. G. (1995) Flow cytometric analysis of
peripheral blood lymphocyte subset light scatter characteristics as a
means of monitoring the development of rat small bowel allograft
rejection, Clin. Exp. Immunol., 100, 536-542.