Comparison of State Transitions of the Photosynthetic Antennae in Arabidopsis and Barley Plants upon Illumination with Light of Various Intensity
D. V. Vetoshkina1, M. A. Kozuleva1, V. V. Terentyev1, E. M. Zhurikova1, M. M. Borisova-Mubarakshina1, and B. N. Ivanov1,a*
1Institute of Basic Biological Problems, Pushchino Scientific Center for Biological Research, Russian Academy of Sciences, 142290 Pushchino, Moscow Region, Russia* To whom correspondence should be addressed.
Received April 23, 2019; Revised May 23, 2019; Accepted May 23, 2019
Changes in the light energy distribution between the photosystems 1 and 2 (PS1 and PS2, respectively) due to the reversible migration of a part of the light-harvesting complex (LHC2) between the photosystems (state transitions, ST) have been studied in leaves of barley (Hordeum vulgare) and Arabidopsis thaliana plants upon short-term illumination with light of various intensity that excited predominantly PS2. Changes in the ratio of fluorescence maxima at 745 and 685 nm in the low-temperature (77 K) fluorescence spectrum of chlorophyll a (Chl a) characterizing energy absorption by the PS1 and PS2, respectively, were insufficient for revealing the differences in the STs in barley and Arabidopsis plants at various light intensities, because they were not associated with STs at high-intensity illumination. Light-induced accumulation of the LHC2 phosphorylated proteins Lhcb1 and Lhcb2 involved in the relocation of a part of the LHC2 from PS2 to PS1 in the leaves of both plants decreased with the increase in the light intensity and was more pronounced in barley than in Arabidopsis at the same light intensity. Relaxation of the non-photochemical quenching (NPQ) of Chl a fluorescence after illumination corresponding to the return of the part of LHC2 from PS1 to PS2 was observed in barley leaves in a wider range of increasing light intensities than in Arabidopsis leaves. The differences in the accumulation of phosphorylated Lhcb1 and Lhcb2, as well as in the parameters of NPQ relaxation after illumination, revealed that STs in barley leaves could occur not only at low-but also at high-intensity light, when it is absent in Arabidopsis leaves.
KEY WORDS: Arabidopsis, barley, photosynthesis, phosphorylation of antenna proteins, chlorophyll a fluorescenceDOI: 10.1134/S0006297919090098
Abbreviations: At-WT and At-stn7, wild-type and STN7 kinase knockout Arabidopsis plants, respectively; Chl, chlorophyll; Hv-NaF/Hv-H2O, barley leaves incubated in NaF solution or water, respectively; LHC, light-harvesting complex; NPQ, non-photochemical fluorescence quenching; PETC, photosynthetic electron transport chain; PS1(2), photosystem 1(2); S1(2), state 1(2); ST, state transition.
One of the mechanisms for the adaptation of plant photosynthetic
apparatus to environmental conditions is redistribution of the absorbed
energy of light quanta between photosystems via reversible migration of
the outer part of the light-harvesting complex (LHC2) between the
photosystem 2 (PS2) and photosystem 1 (PS1). STN7 kinase that
phosphorylates the LHC2 outer proteins is activated upon illumination
with light exciting predominately PS2, which results in the
dissociation of these proteins from PS2, their association with PS1,
and formation of the so-called state 2 (S2) [1, 2]. Shading or further illumination with light
exciting PS1 result in the activation of the PPH1/TAP38 phosphatase, an
enzyme that dephosphorylates LHC2 proteins, thereby allowing them to
return to PS2 with the formation of state 1 (S1) [3, 4]. These processes are known
as classic state transitions (STs).
A direct approach for ST evaluation involves examination of changes after illumination in the fluorescence spectrum of chlorophyll a (Chl a) at the temperature of liquid nitrogen (77 K), at which Chl a molecules associated with PS2 or PS1 emit fluorescence with the maxima characterizing light energy absorption by the photosystems [5]. Another approach involves measuring light-induced accumulation of phosphorylated Lhcb1 and Lhcb2 proteins that form the outer antenna of LHC2 [6]. This approach, however, allows identification of prerequisites for the energy redistribution between the photosystems, but not the realization of this redistribution. Measuring Chl a fluorescence of PS2 at room temperature with insignificant contribution of PS1 can be used for detecting STs by analysis of the changes in the non-photochemical fluorescence quenching (NPQ) of Chl a, i.e., changes in the use of energy absorbed by PS2. One of the challenges associated with this approach is that in addition to the light energy redistribution between the photosystems, quenching can be caused by a number of other processes [7-9].
The effect of light intensity on STs in higher plants has been investigated in detail in Arabidopsis [10]. STs have been also studied examined in corn [11], soybean [12], barley [13], spinach, and pumpkin [14] plants. However, these studies conducted in different laboratories failed to reveal the features of STs in the leaves from different plant species. In order to elucidate possible differences in STs in barley (Hordeum vulgare) and Arabidopsis thaliana, we investigated the effect of light intensity on the S1→S2 and S2→S1 transitions in these plants under identical illumination conditions. We initiated the classic ST process by illuminating the plants with light that predominately excited PS2 and then examined STs using all three approaches described above.
MATERIALS AND METHODS
Plant cultivation and illumination conditions. Wild-type A. thaliana plants, ecotype Columbia (At-WT) and mutant A. thaliana plants deficient by the At1g68830 gene (At-stn7) were grown in a climate chamber (20°C) under illumination with white light with the intensity of 60 µmol quanta·m−2·s−1 at the 8h/16h light/dark photoperiod for 5-6 weeks. Barley plants (H. vulgare) were grown under the same conditions for 12-14 days. In the experiments, the leaves were illuminated for 20 min. We have shown earlier that illumination at 50 µmol quanta·m−2·s−1 for this time period was sufficient for complete transfer to S2, which is in agreement with the published data [15, 16].
Recording of Chl a fluorescence spectra at 77 K. Separated leaves were dark-adapted for 90 min and then either frozen immediately or illuminated prior to freezing with a light diode with the maximum emission at 640 ± 10 nm. Light intensity was varied by changing the light diode current. Low-temperature fluorescence spectra of Chl a emitted in response to excitation with low-intensity light at 435 nm were recorded with a model 850 spectrofluorimeter (Hitachi, Japan). Fluorescence maxima at 745 and 685 nm corresponded to the energy absorption by PS1 and PS2, respectively [5].
Isolation of thylakoid membranes and Western blot assay. Leaves were dark-adapted for 90 min and either used immediately for thylakoid isolation or illuminated for 20 min with light with the maximum emission at 640 nm and intensity of 50, 300, 600, or 1200 µmol quanta·m−2·s−1 prior to thylakoid isolation. The leaves were homogenized in a medium containing 15 mM NaF, 25 mM HEPES-KOH (pH 7.6), 400 mM sucrose, 20 mM NaCl, 5 mM MgCl2, and thylakoid membranes were isolated by a series of centrifugations as described in [17]. The membrane preparations were mixed with the sample buffer (200 mM Tris-HCl, pH 6.8, containing 8% SDS, 32% glycerol, 0.4% bromophenol blue, and 400 mM dithiothreitol), heated at 95°C for 5 min, and centrifuged at 4500g for 15 min. The samples were adjusted according to Chl concentration (1.5 and 2.0 µg of Chl per sample for Arabidopsis and barley preparations, respectively) and loaded on a gel. Proteins were separated by denaturing electrophoresis in 16% polyacrylamide gel in a Mini-PROTEAN Cell (Bio-Rad, USA); 5 µl of PageRuler Prestained Protein Ladder (Thermo Scientific, USA) was used as molecular mass markers. After electrophoresis, the proteins were transferred onto a nitrocellulose membrane (0.45 µm NC; Amersham, Protran, USA) using a Mini Trans-Blot Cell (Bio-Rad). The membranes were incubated with primary antibodies against Lhcb1 and Lhcb2 proteins and their phosphorylated forms Lhcb1P and Lhcb2P (AS13 2704, AS13 2705, and AS01 004, AS01 003 antibodies, respectively; Agrisera, USA) overnight at 4°C. The applicability of these antibodies with barley Lhcb proteins was confirmed in preliminary experiments, in which varying amounts of barley thylakoid membranes were loaded on the gel. Horseradish peroxidase-conjugated antibodies (GE Healthcare, USA) were used as secondary antibodies at 1 : 5000 dilution. The antibody–antigen complexes were detected with a Pierce ECL Plus (Thermo Scientific) Western blot kit and a ChemiDoc gel documentation system (Bio-Rad). The optical density of the bands was quantified with the Image J software.
Measurements of the PS2 effective quantum yield upon illumination and relaxation of the Chl a NPQ after illumination. Plants were dark-adapted for 90 min. In the experiments with NaF, separated leaves were perforated from the down side and incubated in the dark in water or NaF solution for 60 min. NaF concentration (10 mM for barley and 15 mM for Arabidopsis) and incubation duration were selected in preliminary experiments to avoid possible side effects of NaF on the processes in chloroplasts besides inhibition of phosphatases.
Chl a fluorescence was recorded with a Mini-PAM fluorimeter (WALZ, Germany); a light diode with the emission maximum at 640 nm was used for illumination. Saturating light pulses (0.6 s, 6000 µmol quanta·m−2·s−1, white light) were applied in the dark, prior to switching off the acting light, 1 min after switching off the light, and then every 3 min in the dark to record the NPQ relaxation. The PS2 effective quantum yield was calculated using the following equation (F'm – Fs)/F'm, where Fs is the steady-state level of fluorescence in the actinic light, and F'm is fluorescence in response to saturating light pulse before switching off the light. NPQ after illumination was calculated with the equation (Fm – Fdm)/Fdm, where Fm is fluorescence in the dark-adapted leaves in response to the saturating light pulse, and Fdm is fluorescence in response to the saturating light pulse in the dark following illumination. The NPQ values in Fig. 3 and in Tables 1 and 2 were calculated based on the Fdm value at the indicated time after switching off the light.
Table 1. Effect of light intensity
(λmax, 640 nm) on the relaxation of NPQ of Chl
a fluorescence in At-WT and AT-stn7 leaves after 20-min
illumination

Note: NPQ (15′) and NPQ (42′) are NPQ values 15 and 42 min
after switching off light. Data are presented as mean ± standard
error of mean (for three replicate measurements in a typical of the
five growings of plants).
Table 2. Effect of light intensity
(λmax, 640 nm) on the relaxation of NPQ of Chl
a fluorescence after 20-min illumination in barley leaves
incubated in either water (Hv-H2O) or 10 mM NaF (Hv-NaF)
before illumination
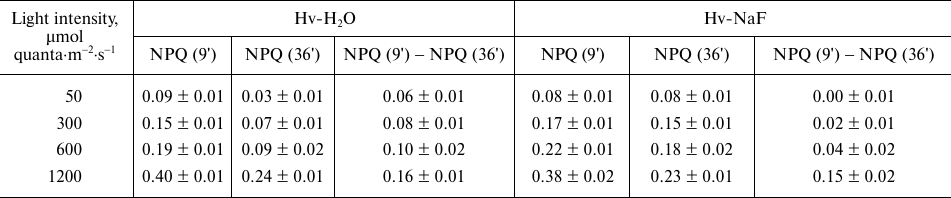
Note: NPQ (9') and NPQ (36') are NPQ values 9 and 36 min after switching
off light. Data are presented as mean ± standard error of mean
(for three replicate measurements in a typical of the five growings of
plants).
RESULTS
Low-temperature fluorescence spectra of Chl a in the leaves of wild type Arabidopsis (At-WT), mutant Arabidopsis plants deficient by the STN7 kinase (At-stn7), and barley plants after illumination with light of various intensity. Typical fluorescence spectra of Chl a in Arabidopsis leaves at 77 K before and after illumination with the light exciting predominantly PS2 are presented in Fig. 1a. Due to the transfer of a part of LHC2 from PS2 to PS1, the S1→S2 transition is manifested in these spectra as the decrease in the fluorescence maximum at 685 nm characterizing energy absorption by PS2 and increase in the fluorescence maximum at 745 nm characterizing light energy absorption by PS1 (Fig. 1a). The changes in the ratio between these maxima after illumination were used to evaluate the effect of light intensity on the S1→S2 transition (Fig. 1b). The PS1/PS2 fluorescence peak ratio increased significantly after illumination with light with the intensity of 50 µmol quanta·m−2·s−1 in comparison with this ratio in the dark both in the At-WT and barley plants. This increase was indeed associated with the S1→S2 transition, as it was absent in the At-stn7 mutants lacking the STN7 kinase. The PS1/PS2 fluorescence peak ratio in At-WT leaves decreased with the increase in the light intensity to 600 µmol quanta·m−2·s−1, which was in agreement with the data reported by Mekala et al. [18] and Trotta et al. [19] who observed the maximal manifestation of STs at lower illumination. However, it increased sharply upon illumination at 1200 µmol quanta·m−2·s−1 (Fig. 1b). In barley leaves, the PS1/PS2 fluorescence peak ratio differed only slightly in plants illuminated at 50, 300, and 600 µmol quanta·m−2·s−1 but increased significantly upon illumination at 1200 µmol quanta·m−2·s−1 (similarly to At-WT plants).
Fig. 1. a) Low-temperature (77 K) spectra of Chl a fluorescence in Arabidopsis leaves: 1) after 90-min dark adaptation; 2) after 90-min dark adaptation following illumination with light (λmax, 640 nm) at 50 µmol quanta·m−2·s−1 for 20 min. Fluorescence was excited at 435 nm. The spectra were normalized at λ = 685 nm. b) Ratio of fluorescence yields at 745 and 685 nm in barley (1), At-WT (2), and At-stn7 (3) plants. The leaves were frozen either after dark adaptation (D) or after 20-min illumination with light (λmax, 640 nm) of the indicated intensity. The data are presented as mean ± standard error of mean (three measurements in three growings of plants).
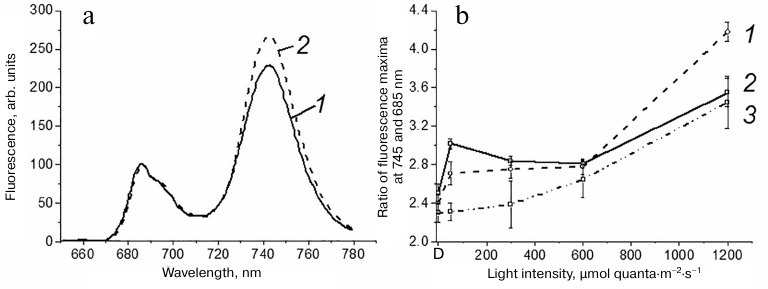
Similar measurements in the At-stn7 mutant allowed us to establish whether the PS1/PS2 fluorescence peak ratio characterizes S1→S2 transition in At-WT plants at light intensities exceeding 50 µmol quanta·m−2·s−1. For the mutant plants, this ratio was slightly higher at 300 µmol quanta·m−2·s−1 and noticeably higher at 600 µmol quanta·m−2·s−1 than in the dark. At that, at 300 µmol quanta·m−2·s−1, it was lower than in At-WT plants but displayed no significant differences with the ratio observed for At-WT leaves at 600 and 1200 µmol quanta·m−2·s−1 (Fig. 1b). Hence, the increase in the PS1/PS2 fluorescence peak ratio in At-WT plants at light intensities over 600 µmol quanta·m−2·s−1 was not likely associated with the S1→S2 transition.
Phosphorylation of Lhcb1 and Lhcb2 proteins in Arabidopsis and barley leaves after illumination with light of various intensity. The amounts of phosphorylated Lhcb1 and Lhcb2 proteins (Lhcb1P and Lhcb2P, respectively) after dark adaptation (see “Materials and Methods”) were different in Arabidopsis and barley leaves: no Lhcb1P and Lhcb2P were detected in barley leaves after 90 min of dark adaptation, while the amounts of these proteins in Arabidopsis leaves reached 30% of their maximal levels. Moreover, Lhcb1P and Lhcb2P were detected in Arabidopsis even after 2-h dark adaptation. The levels of Lhcb1P and Lhcb2P in the At-WT and barley leaves increased upon illumination with the light exciting predominantly PS2 (Fig. 2). The most pronounced accumulation was found at the light intensity of 50 µmol quanta·m−2·s−1. Accumulation of Lhcb1P and Lhcb2P in At-WT plants was less at the light intensity of 300 µmol quanta·m−2·s−1 and even less at 600 µmol quanta·m−2·s−1 in comparison with accumulation observed at 50 µmol quanta·m−2·s−1 (Fig. 2b). These results are in agreement with the data on the inhibition of STN7 kinase under high illumination [18, 19]. The observed decrease in the light-induced accumulation of Lhcb1P and Lhcb2P at higher light intensities was not caused by the protein degradation, as confirmed by Western blot assay of the total amount of Lhcb1 and Lhcb2 proteins (data not shown).
Fig. 2. a) Typical immunoblots of phosphorylated Lhcb1P and Lhcb2P proteins in the leaves of At-WT (1, 2) and barley (3, 4) plants. Thylakoids were isolated either after 90-min dark adaptation (D) or 20-min illumination with light of indicated intensity (λmax = 640 nm); b, c) relative optical density of bands corresponding to Lhcb1P (1, 3) and Lhcb2P (2, 4) in leaves of At-WT (1, 2) and barley (3, 4) plants. The optical density of the bands was normalized to the maximal value observed after illumination at 50 µmol quanta·m−2·s−1; the optical density observed after dark adaptation was subtracted from the optical density observed after illumination. The data are presented as mean ± standard error of mean (three measurements in four growings of plants).
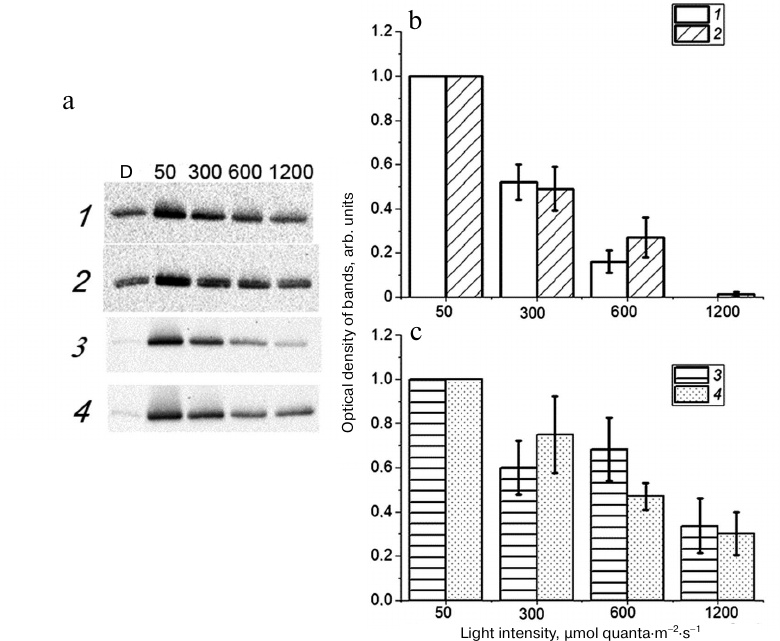
Taking into consideration that the PS1/PS2 fluorescence peak ratio upon illumination at 300 µmol quanta·m−2·s−1 in At-WT plants was higher than in At-stn7 plants, we can conclude that accumulation of Lhcb1P and Lhcb2P at this light intensity ensured S1→S2 transition in At-WT plants. However, insignificant accumulation of these proteins in At-WT plants upon illumination at 600 µmol quanta·m−2·s−1 (Fig. 2b) was not sufficient for the S1→S2 transition. The fact that the PS1/PS2 fluorescence peak ratio in At-WT plants illuminated at 600 µmol quanta·m−2·s−1 was close to the ratio observed in the mutant At-stn7 plants (Fig. 1b) indicates the absence of S1→S2 transition. Accumulation of Lhcb1P and Lhcb2P in the At-WT plants illuminated at 1200 µmol quanta·m−2·s−1 was insignificant. Hence, it can be stated that the increase in the PS1/PS2 fluorescence peak ratio upon illumination at 600 and 1200 µmol quanta·m−2·s−1 (Fig. 1b) is not likely associated with the S1→S2 transition.
Significant light-induced accumulation of Lhcb1P and Lhcb2P proteins in barley leaves was observed upon illumination not only at 50 µmol quanta·m−2·s−1, but also at 300 and 600 µmol quanta·m−2·s−1 (Fig. 2c). The higher levels of phosphorylated proteins (vs. At-WT plants) were likely sufficient to ensure the S1→S2 transition in barley leaves upon illumination at 300 and 600 µmol quanta·m−2·s−1, because, unlike At-WT plants, no drop in the PS1/PS2 fluorescence peak ratio was observed in barley leaves at these light intensities (Fig. 1b). The lack of such decrease even upon illumination at 600 µmol quanta·m−2·s−1 was likely a result of the combination of the increase (in comparison with the dark level) in the PS1/PS2 fluorescence ratio due to the S1→S2 transition and increase in this ratio due to the light intensity increase, which is unrelated to the S1→S2 transition (as observed in At-stn7 plants) (Fig. 1b).
These results imply that evaluation of the S1→S2 transition induced by illumination with light exciting predominantly PS2 based on the changes in the PS1/PS2 fluorescence peak ratio at 77 K did not provide reliable identification of differences between Arabidopsis and barley plants in the ST dependence on the light intensity, because the increase in this ratio occurred with the increase in the light intensity and was not associated with STs. On the other hand, the level of phosphorylated Lhcb1P and Lhcb2P also could not be used for direct evaluation of STs, since the amount of Lhcb1P and Lhcb2P did not directly correlate with the degree of the S1→S2 transition, because some already phosphorylated proteins could remain bound to the PS2 [20-23].
Relaxation of NPQ of Chl a fluorescence in Arabidopsis and barley leaves after illumination with light of various intensity. Figure 3 shows typical NPQ relaxation curves after 20-min illumination with the light of 50 µmol quanta·m−2·s−1 exciting predominantly PS2, i.e., under conditions ensuring maximal S1→S2 transition in At-WT and Hv-H2O leaves (see Figs. 1 and 2). In order to reveal NPQ associated with the S2→S1 transition, NPQ relaxation was compared in the leaves of At-WT plant (Fig. 3a, curve 2), At-stn7 mutant plants, in which the pigment apparatus remained in the S1 upon illumination (Fig. 3a, curve 3), and barley leaves incubated either in water (Hv-H2O) (Fig. 3b, curve 2) or in the presence of phosphatase inhibitor NaF (Hv-NaF) (Fig. 3b, curve 1). In the latter case, the pigment apparatus remained in the S2 after illumination. The NPQ value in At-stn7 plants during the first minutes after switching off the light was lower than in the At-WT plants, which indicates the absence of contribution of the S1→S2 transition to NPQ. At the same time, initial dark values of NPQ both in Hv-NaF and in At-WT-NaF leaves were close to those observed for Hv-H2O and At-WT leaves because of the S1→S2 transition occurring in these leaves. Stationary NPQ values in the leaves incubated in the NaF solution, i.e., with disrupted S2→S1 transition, were higher than in the leaves with “normal” transition process, because a part of LHC2 transferred to PS1 remained bound to this photosystem, and less energy was absorbed by PS2. This resulted in the lower level of fluorescence than before illumination, which was reflected as a higher NPQ value.
Fig. 3. NPQ relaxation after 20-min illumination at 50 µmol of quanta·m−2·s−1 (λmax, 640 nm) in the plants dark-adapted for 90 min prior to illumination. Panel (a): 1) At-WT leaves incubated in 15 mM NaF; 2) At-WT leaves; 3) At-stn7 leaves; b) barley leaves incubated in 10 mM NaF (1) and water (2). Typical curves were produced by averaging three measurements in one of the five growings of plants.
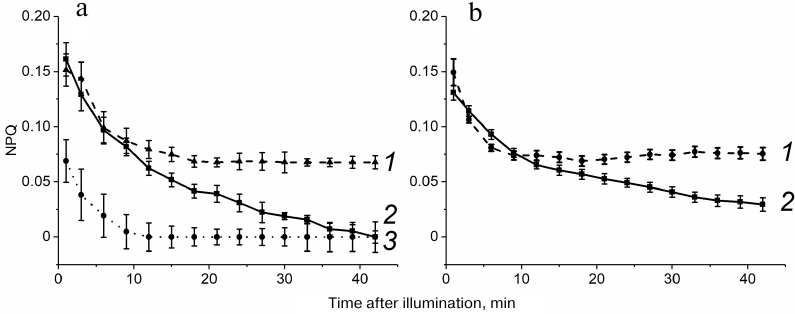
NPQ reached the plateau over the period of 12-15 min in At-stn7 (Fig. 3a, curve 3) and At-WT-NaF (Fig. 3a, curve 1) leaves but continued to decrease in At-WT leaves (Fig. 3a, curve 2). Hence, complete relaxation of the NPQ-causing processes with the exception of STs occurred in Arabidopsis leaves within 12-15 min. It is essential that this time did not depend on whether ST was disrupted by the lack of STN7 kinase or NaF treatment. In the first case, the S2→S1 transition after illumination did not occur due to the absence of the S1→S2 transition upon illumination, and in the second case – due to the inhibition of phosphatases. NPQ relaxation in the Hv-NaF leaves in the presence of NaF reached plateau after 6-9 min (Fig. 3b, curve 1), while in the barley leaves incubated in water, NPQ continued to decrease after this time point (Fig. 3b, curve 2).
In the dark, NPQ in the At-WT and At-stn7 leaves reached zero level, i.e., complete NPQ relaxation took place. The NPQ values reached the stationary levels of 0.03 and 0.02 in the barley leaves perforated prior to the incubation in water (Hv-H2O) (Fig. 3b and Table 2) and At-WT-H2O leaves (data not shown), respectively, which was likely caused by the leaf perforation. The similarity of NPQ relaxation in At-stn7 and At-WT-NaF leaves indicated, however, that perforation did not affect the kinetics of S2→S1 transition. Close values of the effective PS2 quantum yield in the Hv-H2O and Hv-NaF leaves (0.69 and 0.68, respectively) demonstrated that treating barley leaves with 10 mM NaF did not produce side effect on the electron transfer in PS2, and treating Arabidopsis leaves with 15 mM NaF also did not affect this parameter (see “Materials and Methods”).
The S2→S1 transition starts after illumination is switched off, but the NPQ relaxation associated with the S2→S1 transition can be evaluated only as the difference in the NPQ relaxation levels in At-WT and At-stn7 plants in the case of Arabidopsis and in Hv-H2O and Hv-NaF leaves in the case of barley plants. In order to reveal the S2→S1 transition, NPQ relaxation after 15-min and 9-min dark adaptation was used in At-WT and Hv-H2O leaves, respectively. Considering that after illumination at 50 µmol quanta·m−2·s−1, NPQ was completely relaxed (reached minimum value) in At-WT and Hv-H2O leaves, respectively, in 42 and 36 min after the light was turned off, the differences [NPQ (15′) − NPQ (42′)] and [NPQ (9') − NPQ (36')] were used for the estimation of NPQ associated with the S2→S1 transition in Arabidopsis and barley plants, respectively.
At the light intensities exceeding 50 μmol quanta·m−2·s−1, relaxation of the other processes causing NPQ did not cease within the period of observation (see below). However, we used the same timeframe for relative evaluation of STs at other light intensities in order to compare NPQ relaxation associated with STs (which is likely faster at higher light intensities, based on the data presented in Figs. 1 and 2), because the key point for evaluation of the S2→S1 contribution to the NPQ relaxation was comparison of the NPQ relaxation in the leaves where this transition took place and where it was absent.
The [NPQ (15′) − NPQ (42′)] value in At-WT plants was higher than in At-stn7 plants only at illumination intensity of 50 µmol quanta·m−2·s−1 and then remained virtually the same in WT and mutant plants at 300, 600, and 1200 µmol quanta·m−2·s−1 (Table 1). This implies that either the S2→S1 transition was absent upon illumination at 300, 600, and 1200 µmol quanta·m−2·s−1 or was so insignificant that it could not be registered over the time period from minute 15 to minute 42 of dark incubation; hence the S1→S2 transition was absent upon illumination. Considering that the NPQ values were not equal to zero by the minute 42 of dark incubation after illumination at light intensities exceeding 50 µmol quanta·m−2·s−1 both in At-WT and At-stn7 leaves, it was suggested that the relaxation of other processes causing NPQ was not completed by this time point.
In barley, the [NPQ (9') − NPQ (36')] difference was higher in Hv-H2O than in Hv-NaF leaves after illumination at 50, 300, and 600 µmol quanta·m−2·s−1 and became close only after illumination at 1200 µmol quanta·m−2·s−1 (Table 2). Hence, unlike Arabidopsis, the S2→S1 transition in barley plants took place not only upon illumination at 50 µmol quanta·m−2·s−1, but also at 300 and 600 µmol quanta·m−2·s−1. High NPQ values observed for both Hv-NaF and Hv-H2O leaves 36 min after illumination at 300, 600, and 1200 µmol quanta·m−2·s−1 indicate the emergence of slowly relaxing quenching state, e.g., photoinhibition.
DISCUSSION
Although recording of low-temperature fluorescence spectra of Chl a is considered as a standard approach for evaluating STs, we were unable to reliably reveal the difference between STs in Arabidopsis and barley plants using this approach. High values of the PS1/PS2 fluorescence peak ratio after illumination at 600 and 1200 µmol quanta·m−2·s−1 in At-WT leaves (Fig. 1b) did not correlate with accumulation of Lhcb1P and Lhcb2P proteins (Fig. 2b), as the amount of these proteins after illumination at 600 µmol quanta·m−2·s−1 comprised only 15-25% of the amount observed upon illumination at 50 µmol quanta·m−2·s−1 (when the ST process was at its maximum). The light-induced accumulation of Lhcb1P and Lhcb2P was virtually absent in these plants upon illumination at 1200 µmol quanta·m−2·s−1 light. The high PS1/PS2 fluorescence peak ratio observed upon illumination of barley leaves at 1200 µmol quanta·m−2·s−1 (Fig. 1b) was accompanied by low accumulation of Lhcb1P and Lhcb2P that reached only 30% of the maximum level (Fig. 2c).
The data on the accumulation of phosphorylated Lhcb1 and Lhcb2 proteins upon illumination confirm the conclusion that the sharp increase in the PS1/PS2 peak ratio after illumination at 1200 µmol quanta·m−2·s−1 in At-WT and At-stn7 leaves was not associated with redistribution of the light-harvesting complexes between the photosystems, and, in other words, cannot by attributed to the S1→S2 transition. At the moment, there is no explanation for the sharp increase in the PS1/PS2 fluorescence peak ratio after illumination at 1200 µmol quanta·m−2·s−1 light in the leaves of both plants (Fig. 1b). At the same time, a significant level of NPQ was maintained in At-WT and At-stn7 plants and especially in barley plants following illumination at 1200 µmol quanta·m−2·s−1 light, even after extended dark period (Tables 1 and 2), which could indicate the emergence of photoinhibition. Mekala et al. [18] reported that illumination of whole plants even for 2 h with white light that excited both photosystems at 1000 µmol quanta·m−2·s−1 did not result in such increase in the PS1/PS2 fluorescence peak ratio as shown in Fig. 1b. The reason for this discrepancy is likely in the fact that in our experiments, the leaves were illuminated with light absorbed predominantly by PS2, which resulted in high levels of reduction of the carriers in the photosynthetic electron-transport chain (PETC) and created condition for PS2 photoinhibition [24]. Therefore, it is likely that photoinhibition itself facilitated sharp increase in the PS1/PS2 fluorescence peak ratio upon illumination at 1200 µmol quanta·m−2·s−1. Certain increase in this ratio due to the photoinhibition was observed already upon illumination at 600 µmol quanta·m−2·s−1 (Fig. 1b). It can be concluded that in the case when the used light excites predominantly PS2, one must take into consideration that the increase in the PS1/PS2 fluorescence peak ratio upon illumination with high-intensity light is not associated with STs and, thus, cannot be used for the investigation of this process.
The differences in the STs in Arabidopsis and barley plants were revealed by investigating phosphorylation of the Lhcb1 and Lhcb2 proteins upon illumination. In barley leaves illuminated at 300, 600, and 1200 µmol quanta·m−2·s−1, the relative levels of phosphorylated Lhcb1 and Lhcb2 (in comparison with those under dark conditions) were significantly higher than in At-WT plants (Fig. 2, b and c). As mentioned above, the extent of S1→S2 transition cannot be directly related to the amount of Lhcb1P and Lhcb2P proteins, although the presence of these proteins is a prerequisite for STs. Hence, the observed difference between Arabidopsis and barley plants in the phosphorylation of LHC2 proteins upon illumination at the same light intensity reflects possible differences in the kinase activity in these plants. The differences in the amount of phosphorylated proteins in Arabidopsis and barley leaves after incubation in the dark suggest the differences in the activity of phosphatase.
We also observed the differences in the STs relaxation in Arabidopsis and barley leaves after illumination. According to the data by Leoni et al. [16], phosphorylation of proteins starts within the first seconds of illumination with light exciting predominantly PS2; furthermore, Lhcb2 is phosphorylated faster than Lhcb1. However, the maximal accumulation of both phosphorylated proteins was achieved after 20-min illumination. The reverse S2→S1 transition was even slower; after the maximal S1→S2 transition was reached, the following illumination with light exciting predominantly PS1 (i.e., facilitating to the greatest extent the S2→S1 transition) caused 90% restoration of the thylakoid granal structure only after 30 min [15]. In Arabidopsis leaves illuminated at 300 and 600 µmol quanta·m−2·s−1, the S2→S1 transition could not be detected already after 15 min of dark incubation (Table 1). This indicates that the S1→S2 transition in At-WT leaves illuminated at these intensities was insignificant or completely absent. However, as mentioned in the “Results” section, both accumulation of the noticeable amounts of phosphorylated proteins at this illumination intensity and higher PS1/PS2 fluorescence peak ratio in comparison with At-stn7 plants could speak in favor of the presence of the S1→S2 transition in At-WT plants illuminated at 300 µmol quanta·m−2·s−1. Manifestation of the S1→S2 transition at 77 K and the absence of manifestation of the S2→S1 transition during NPQ relaxation after illumination at 300 µmol quanta·m−2·s−1 are the results of immediate freezing of the leaves after illumination in the first case and recording of the S2→S1 transition only after 15-min dark incubation. If the S1→S2 transition was insignificant upon illumination at this light intensity, then the S2→S1 transition could end after 15 min of dark incubation. Contrary to Arabidopsis, the S2→S1 transition in barley leaves is clearly pronounced upon illumination at both 300 and 600 µmol quanta·m−2·s−1 (Table 2). This distinction between barley and Arabidopsis plants is in good agreement with the accumulation of Lhcb1P and Lhcb2P proteins in their leaves. The difference in STs in barley and Arabidopsis could be due to the age difference of plants: 2 weeks for barley and 5-6 weeks for Arabidopsis. However, the leaves of 2-week-old barley plants and the third leaf of Arabidopsis had almost the same thickness. No significant differences in the Chl content of per unit of leaf surface and values of the PS2 quantum yield between these leaves were found. The effect of the plant (leaf) age on STs remain poorly understood and requires special investigation.
Hence, only combined application of two approaches, such as evaluation of the NPQ relaxation and estimation of the Lhcb1P and Lhcb2P levels, allows to reveal the differences in STs in barley and Arabidopsis plants. In barley, STs were observed upon illumination at 50, 300, and 600 µmol quanta·m−2·s−1 and was absent only upon illumination at 1200 µmol quanta·m−2·s−1. In Arabidopsis plants, STs were suppressed already at light intensities close to 300 µmol quanta·m−2·s−1. Accumulation of Lhcb1P and Lhcb2P likely determines the extent of STs and depends on activities of both kinases and phosphatases. Considering that these enzymes are located in the thylakoid membrane, their activity is determined by the functioning of the electron transfer pathways of the PETC. The functioning of PETC in Arabidopsis and barley plants under the same light intensity could, for example, differ in the rate of reactive oxygen species (ROS) generation (e.g., ROS generation in oat thylakoids was found to be significantly higher than in pea thylakoids [25]). It is possible that it is the differences in the PETC functioning that underlies the differences in the effect of light intensity on STs in Arabidopsis and barley plants.
STs are essential in plants as they allow to quickly regulate energy distribution between the photosystems, thus providing adaptation to rapid changes in the illumination conditions. The results produced in this work demonstrated that at the same light intensities, STs in barley and Arabidopsis plants occur differently. These differences could reflect genetically mediated adaptations of plant species to different habitat conditions.
Funding. This work was supported by the Russian Science Foundation (projects 17-14-01371 and 17-76-10058).
Acknowledgements. The authors are grateful to Prof. Dario Leister (Ludwig-Maximilians-Universität, München) for providing seeds of Arabidopsis mutant plants lacking STN7 kinase.
Conflict of interest. The authors declare no conflict of interest in financial or any other sphere.
Ethical approval. This article does not contain any studies with human participants or animals performed by any of the authors.
REFERENCES
1.Rochaix, J.-D., Lemeille, S., Shapiguzov, A.,
Samol, I., Fucile, G., Willig, A., and Goldschmidt-Clermont, M. (2012)
Protein kinases and phosphatases involved in the acclimation of the
photosynthetic apparatus to a changing light environment, Philos.
Trans. R Soc. Lond. B Biol. Sci., 367, 3466-3474; doi:
10.1098/rstb.2012.0064.
2.Allen, J. F. (2003) Botany. State transitions
– a question of balance, Science, 299, 1530-1532;
doi: 10.1126/science.1082833.
3.Pribil, M., Pesaresi, P., Hertle, A., Barbato, R.,
and Leister, D. (2010) Role of plastid protein phosphatase TAP38 in
LHC2 dephosphorylation and thylakoid electron flow, PLoS Biol.,
8, e1000288; doi: 10.1371/journal.pbio.1000288.
4.Shapiguzov, A., Ingelsson, B., Samol, I., Andres,
C., Kessler, F., Rochaix, J.-D., Vener, A. V., and
Goldschmidt-Clermont, M. (2010) The PPH1 phosphatase is specifically
involved in LHCII dephosphorylation and state transitions in
Arabidopsis, Proc. Natl. Acad. Sci. USA, 107,
4782-4787; doi: 10.1073/pnas.0913810107.
5.McCormac, D. J., Bruce, D., and Greenberg, B. M.
(1994) State transitions, light-harvesting antenna phosphorylation and
light-harvesting antenna migration in vivo in the higher plant
Spirodela oligorrhiza, Biochim. Biophys. Acta Bioenerg.,
1187, 301-312; doi: 10.1016/0005-2728(94)90004-3.
6.Bennett, J. (1979) Chloroplast phosphoproteins. The
protein kinase of thylakoid membranes is light‐dependent,
FEBS Lett., 103, 342-344; doi:
10.1016/0014-5793(79)81358-7.
7.Niyogi, K. K., Grossman, A. R., and Bjorkman, O.
(1998) Arabidopsis mutants define a central role for the
xanthophyll cycle in the regulation of photosynthetic energy
conversion, Plant Cell, 10, 1121-1134; doi:
10.1105/tpc.10.7.1121.
8.Cazzaniga, S., Dall’Osto, L., Kong, S. G.,
Wada, M., and Bassi, R. (2013) Interaction between avoidance of photon
absorption, excess energy dissipation and zeaxanthin synthesis against
photooxidative stress in Arabidopsis, Plant J.,
76, 568-579; doi: 10.1111/tpj.12314.
9.Nilkens, M., Kress, E., Lambrev, P., Miloslavina,
Y., Muller, M., Holzwarth, A. R., and Jahns, P. (2010) Identification
of a slowly inducible zeaxanthin-dependent component of
non-photochemical quenching of chlorophyll fluorescence generated under
steady-state conditions in Arabidopsis, Biochim. Biophys.
Acta Bioenerg., 1797, 466-475; doi:
10.1016/j.bbabio.2010.01.001.
10.Tikkanen, M., Piippo, M., Suorsa, M., Sirpio, S.,
Mulo, P., Vainonen, J., Vener, A., Allahverdiyeva, Ya., and Aro, E. M.
(2006) State transitions revisited – a buffering system for
dynamic low light acclimation of Arabidopsis, Plant Mol.
Biol., 62, 779-793; doi: 10.1007/s11103-006-9088-9.
11.Fernyhough, P., Horton, P., and Foyer, C. (1984)
in Advances in Photosynthesis Research, Springer, Dordrecht, pp.
299-302; doi: 10.1007/978-94-017-4973-2_68.
12.Demmig, B., Cleland, R. E., and Bjorkman, O.
(1987) Photoinhibition, 77 K chlorophyll fluorescence quenching and
phosphorylation of the light-harvesting chlorophyll–protein
complex of photosystem II in soybean leaves, Planta, 172,
378-385; doi: 10.1007/BF00398667.
13.Horton, P., and Hague, A. (1988) Studies on the
induction of chlorophyll fluorescence in isolated barley protoplasts.
IV. Resolution of non-photochemical quenching, Biochim. Biophys.
Acta Bioenerg., 932, 107-115; doi:
10.1016/0005-2728(88)90144-2.
14.Rintamaki, E., Salonen, M., Suoranta, U. M.,
Carlberg, I., Andersson, B., and Aro, E. M. (1997) Phosphorylation of
light-harvesting complex II and photosystem II core proteins shows
different irradiance-dependent regulation in vivo. Application
of phosphothreonine antibodies to analysis of thylakoid
phosphoproteins, J. Biol. Chem., 272, 30476-30482; doi:
10.1074/jbc.272.48.30476.
15.Chuartzman, S. G., Nevo, R., Shimoni, E.,
Charuvi, D., Kiss, V., Ohad, I., Brumfeld, V., and Reich, Z. (2008)
Thylakoid membrane remodeling during state transitions in
Arabidopsis, Plant Cell, 20, 1029-1039; doi:
10.1105/tpc.107.055830.
16.Leoni, C., Pietrzykowska, M., Kiss, A. Z.,
Suorsa, M., Ceci, L. R., Aro, E. M., and Jansson, S. (2013) Very rapid
phosphorylation kinetics suggest a unique role for Lhcb2 during state
transitions in Arabidopsis, Plant J., 76, 236-246;
doi: 10.1111/tpj.12297.
17.Ignatova, L. K., Rudenko, N. N., Mudrik, V. A.,
and Ivanov, B. N. (2011) Carbonic anhydrase activity in Arabidopsis
thaliana thylakoid membrane and fragments enriched with PSI or
PSII, Photosynth. Res., 110, 89-98; doi:
10.1007/s11120-011-9699-0.
18.Mekala, N. R., Suorsa, M., Rantala, M., Aro, E.
M., and Tikkanen, M. (2015) Plants actively avoid state transitions
upon changes in light intensity: role of light-harvesting complex II
protein dephosphorylation in high light, Plant Physiol.,
168, 721-734; doi: 10.1104/pp.15.00488.
19.Trotta, A., Suorsa, M., Rantala, M., Lundin, B.,
and Aro, E. M. (2016) Serine and threonine residues of plant STN7
kinase are differentially phosphorylated upon changing light conditions
and specifically influence the activity and stability of the kinase,
Plant J., 87, 484-494; doi: 10.1111/tpj.13213.
20.Damkjaer, J. T., Kereiche, S., Johnson, M. P.,
Kovacs, L., Kiss, A. Z., Boekema, E. J., Ruban, A. V., Horton, P., and
Jansson, S. (2009) The photosystem II light-harvesting protein Lhcb3
affects the macrostructure of photosystem II and the rate of state
transitions in Arabidopsis, Plant Cell, 21,
3245-3256; doi: 10.1105/tpc.108.064006.
21.Tikkanen, M., Grieco, M., Kangasjärvi, S.,
and Aro, E. M. (2010) Thylakoid protein phosphorylation in higher plant
chloroplasts optimizes electron transfer under fluctuating light,
Plant Physiol., 152, 723-735; doi:
10.1104/pp.109.150250.
22.Wientjes, E., van Amerongen, H., and Croce, R.
(2013) LHCII is an antenna of both photosystems after long-term
acclimation, Biochim. Biophys. Acta Bioenerg., 1827,
420-426; doi: 10.1016/j.bbabio.2012.12.009.
23.Zhang, S., and Scheller, H. V. (2004)
Light-harvesting complex II binds to several small subunits of
photosystem I, J. Biol. Chem., 279, 3180-3187; doi:
10.1074/jbc.M311640200.
24.Osmond, C. B. (1981) Photorespiration and
photoinhibition: some implications for the energetics of
photosynthesis, Biochim. Biophys. Acta Bioenerg., 639,
77-98; doi: 10.1016/0304-4173(81)90006-9.
25.Shmeleva, V. L., Ivanov, B. N., Pigulevskaya, T.
K., and Chernavina, I. A. (1984) Electron transport and phosphorylation
in chloroplasts from oat grown under excess of zinc in the growth
medium, Fiziol. Biokhim. Kult. Rast., 16, 31-37.