Lucigenin as a Substrate of Microsomal NAD(P)H-Oxidoreductases
I. A. Schepetkin
Institute of Oncology, Tomsk Research Center, Siberian Branch of the Russian Academy of Medical Sciences, Kooperativnyi Pereulok 5, Tomsk, 634001 Russia; fax: (3822) 224097; E-mail: kirp@flora.tsu.tomsk.su
Received June 25, 1998; Revision received September 20, 1998
NADPH oxidation and cytochrome c reduction with and without lucigenin as well as NAD(P)H/lucigenin-dependent chemiluminescence of rat liver microsomes were studied. An increased rate of NADPH oxidation and cytochrome c reduction in the presence of lucigenin was related to one-electron lucigenin reduction by microsomal NADPH reductases. The apparent Michaelis constant values for lucigenin (Km appLuc) were 3.6 and 5.0 µM in normoxygenic (pO2 = 150 ± 5 mm Hg) and 8.7 and 8.3 µM in hypoxygenic (pO2 = 45 ± 4 mm Hg) media in the reactions of lucigenin-dependent NADPH oxidation and cytochrome c reduction, respectively. The maximal level of NADPH/lucigenin-dependent chemiluminescence was registered at lucigenin concentration close to the mean Km appLuc in the lucigenin-reductase reaction. Increasing the lucigenin concentration from 5 to 100 µM was associated with a decrease in the chemiluminescence intensity; this could be due to the inactivation of cytochrome P450. In the presence of superoxide dismutase (SOD), the rate of lucigenin-dependent cytochrome c reduction and NADPH/lucigenin-dependent chemiluminescence were decreased by 10 and 30%, respectively. The addition of lucigenin to microsomes which contain the reduced hemoprotein--CO complex was followed by the disappearance of the differential absorption spectrum specific for the carboxy complex and by increase in chemiluminescence intensity versus the control (without carboxy complex). Thus, lucigenin-dependent chemiluminescence of microsomes may be due to some enzymes including lucigenin reductase (NADPH-cytochrome P450 reductase, NADH-cytochrome b5 reductase), generation of O2-. in the redox cycle of lucigenin radicals, dioxetane formation by (di)oxygenases, and catalytic action of the cytochrome P450 heme on dioxetane decomposition followed by light quantum emission. Thus, lucigenin cannot be used to measure the basal O2-. formation in tissue homogenates with high levels of NAD(P)H-oxidoreductases.
KEY WORDS: chemiluminescence, lucigenin, cytochrome P450 reductase, cytochrome b5 reductase, cytochrome P450
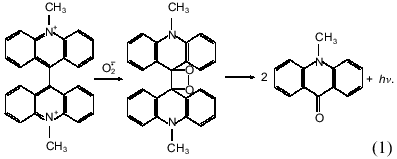
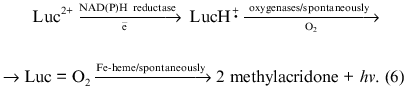
Luminophore-dependent (luminol, lucigenin, analogs of luciferin, etc.) chemiluminescence is widely used to monitor the formation of reactive oxygen species in biological and other systems. Recently the method was adapted for monitoring reactive oxygen species produced by subcellular fractions [1-9], whole cells of non-leukocyte origin (cardiomyocytes, hepatocytes) [7, 10], and surface fragments of tissues and organs (pulmonary artery, heart lobes) [9, 11] or even whole perfused organs (lung, liver) [12, 13]. In these studies the lucigenin-dependent chemiluminescence was considered adequate to determine O2-· in the tested biological systems--in microsomes in particular. The method is based on the classical reaction scheme of lucigenin interaction with O2-· resulting in the formation of unstable dioxetane which decomposes forming two molecules of methylacridone and emitting light quanta [14]:
MATERIALS AND METHODS
Superoxide dismutase, bovine milk xanthine oxidase, horse heart cytochrome c, and salts for the buffer solution were from Sigma (USA); bovine heart cytochrome oxidase, catalase, luminol (5-amino-2,3-dihydro-1,4-phthalazinedione), lucigenin (2-N-methylacridinium nitrate), NADPH, xanthine, dimethylsulfoxide, and glycerol were from Serva (Germany); sodium azide (NaN3) and sodium phenobarbital were from Merck (Germany); NADH was from Reanal (Hungary). Sodium phosphate buffer (0.1 M, pH 7.4) was prepared using double-distilled water. All solutions were prepared using this buffer. Stock solutions of luminol (250 mM) and lucigenin (650 mM) contained dimethylsulfoxide (2.3 vol. %). Carbon monoxide (CO) was prepared by reaction of formic acid with concentrated sulfuric acid at 100°C; ultrapure helium was a product of the Institute of Nuclear Physics (Tomsk Polytechnical Institute).
Male Wistar rats (180-230 g) were used. The animals were intraperitoneally injected with 10% aqueous solution of sodium phenobarbital (80 mg/kg body weight; 3 injections at 24 h intervals) to induce cytochrome P450 activity in hepatic microsomes; 24 h after the last injection the animals were decapitated. Microsomes were isolated from the perfused liver homogenate by differential centrifugation; the homogenate was centrifuged for 30 min at 9,000g, and the supernatant was recentrifuged on a Beckman L8-70M centrifuge (USA) at 105,000g for 1 h at 4°C. The pellet was resuspended in the phosphate buffer containing 20% glycerol, divided into aliquots, and stored at -50°C until use (not exceeding 2 months). Prior to experiments the microsomes were diluted with the buffer to make the protein concentration 4.4 mg/ml and stored at 4°C during the assays (not exceeding 3 h).
The rates of oxidation of NADPH and NADH and cytochrome c reductase activity of the microsomes were assayed by spectrophotometry (molar extinction coefficients for NADPH epsilon340 = 6.22·103 M-1·cm-1 and for reduced cytochrome c epsilon550 = 1.85·104 M-1·cm-1) using a Specord M-40 apparatus (Carl Zeiss, Germany) at 25°C. The values of Km and Vmax of the reactions were calculated using the Hofstee plots (dependence of v on v/[S]) at lucigenin concentrations from 1.5 to 200 µM.
Microsomal protein was assayed by the biuret method.
Chemiluminescence was determined using a model 1251 luminometer (LKB, Sweden) in its automated regimen [15]. In standard assays 750 µl of the buffer, 50 µl of microsome suspension (to make final protein concentration 220 µg/ml), 100 µl of lucigenin solution, and 100 µl of luminol solution were added to the luminometer cell. After the cyclic program of measurements and sample flow into the cell were started, 100 µl of NADPH or NADH solution were added by a microsyringe through the tubing. Monitoring was performed at 25°C under constant mixing (light gathering time was 2-5 sec in a single cycle). The integral and peak values of chemiluminescence were used for calculations.
Partial oxygen pressure (pO2) in the buffer was determined using a microanalyzer from Radelkis (Hungary). The medium was hypoxygenated by bubbling the buffer solution with pure helium until the pO2 value in the buffer was 45 ± 4 mm Hg (6.0 ± 0.7 kPa).
Each effect was tested in at least three independent experiments. Results were statistically evaluated by the Wilcoxon--Mann--Whitney non-parametric test.
To evaluate the ratio of intensities of lucigenin- and luminol-dependent chemiluminescence in other systems generating reactive oxygen species, neutrophils and monocytes of whole blood were used (1:25 dilution of heparinized blood by Hanks solution) as well as enriched suspension of the cells as described in [16, 17].
RESULTS AND DISCUSSION
One-electron reduction of lucigenin by microsomal NADPH reductases. Addition of lucigenin to medium containing microsomes and NADPH significantly enhanced the rate of NADPH oxidation (Fig. 1). NADPH was not oxidized in medium containing only lucigenin. The rate of lucigenin-dependent NADPH oxidation can be calculated as the difference between the initial rates of NADPH oxidation with and without lucigenin. The kinetic characteristics of the lucigenin-dependent oxidation of NADPH are listed in Table 1.
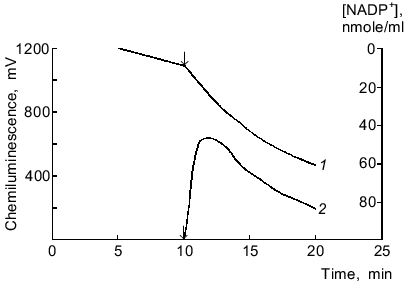
Table 1. Kinetic characteristics of NADPH-lucigenin reductase activity of rat liver microsomesFig. 1. Oxidation of NADPH by microsomes in the presence of lucigenin (1) and NADPH/lucigenin-dependent chemiluminescence of microsomes (2). The arrows correspond to addition of lucigenin (40 µM) to the medium containing microsomes (220 µg protein per ml) and NADPH (115 µM).
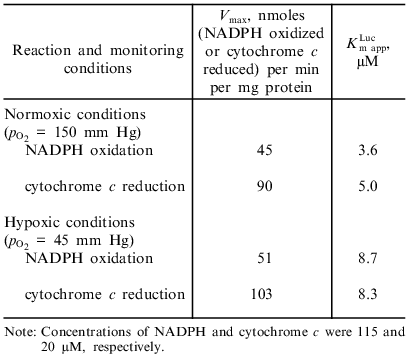
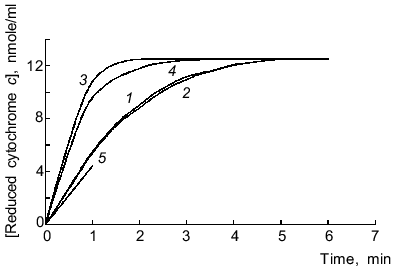
Reduction of cytochrome c by microsomal NADPH reductases in the absence of lucigenin was not inhibited by SOD (15 units/ml), thus indicating that electrons are not directly transferred to cytochrome c (without generation of O2-·). Lucigenin increased the rate of cytochrome c reduction, and SOD (15 units/ml) lowered this activation by 10% (Fig. 2). The rate of cytochrome c reduction was significantly increased (p < 0.05) at high (>40 µM) and low (1.5 µM) concentrations of lucigenin. When the spectra of incubation medium (containing lucigenin, microsomes, and NADPH without cytochrome c) were recorded every 5 min, the absorption at 500-600 nm did not change (data not shown). Thus, enhanced rate of cytochrome c reduction in the presence of lucigenin apparently corresponds to the first stage of one-electron reduction of the luminophore by microsomal NADPH reductases. The rate of this reaction corresponds to the difference between the rates of cytochrome c reduction with and without lucigenin (Fig. 2, curve 5). The ratio of Vmax of lucigenin-dependent cytochrome c reduction and Vmax of lucigenin-dependent NADPH oxidation equals 2 (Table 1), i.e., it corresponds to the stoichiometry of one-electron reduction of lucigenin (Luc2+) catalyzed by NADPH reductases:
Generated radicals of lucigenin cation (LucH+.) can immediately reduce cytochrome c:Fig. 2. Cytochrome c and lucigenin reductase activities of microsomes. 1) Rate of NADPH-dependent reduction of cytochrome c by microsomes; 2-4) same as (1) but in the presence of SOD (15 units/ml) (2), lucigenin (3), and SOD (15 units/ml) + lucigenin (4); 5) rate of lucigenin reductase activity of microsomes calculated as difference between the initial rates of reductase activity of samples (3) and (1). Concentrations of lucigenin, NADPH, and microsomal protein correspond to the values indicated in the legend of Fig. 1.
Lucigenin reductase activity of xanthine oxidase and electron-transfer properties of lucigenin were demonstrated in another enzyme system, xanthine--xanthine oxidase [22]. Cytochrome c reduction by this system was completely blocked by SOD. Addition of lucigenin to the reaction medium restored the reduction of cytochrome c. Thus, reduced cytochrome c was oxidized by cytochrome oxidase (Fig. 3).
The data indicate that addition of lucigenin to microsomes even at low concentrations (1.5 µM) results in generation of O2-·. Other authors have shown that 1-5 µM lucigenin does not stimulate oxygen consumption and additional formation of O2-· in the following systems: xanthine--xanthine oxidase, NADH--lipoamide dehydrogenase, isolated mitochondria, mitochondria in intact cells, and NADPH oxidase of phagocytes [23].Fig. 3. Lucigenin reductase activity of xanthine oxidase. Arrows correspond to the addition of lucigenin (1) to make the final concentration 65 µM in the reaction medium containing xanthine oxidase (0.2 IU/ml), xanthine (95 µM), SOD (20 units/ml), and cytochrome c (20 µM) and to addition of cytochrome oxidase (2) (4 IU/ml).
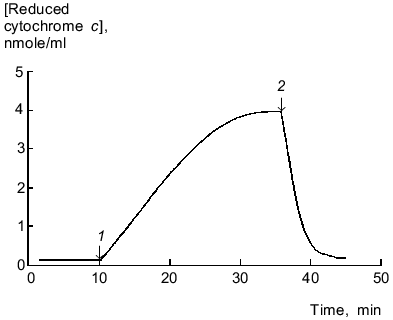
NADPH/lucigenin-dependent chemiluminescence of microsomes. Chemiluminescence was detected only in the presence of three components including microsomes, NADPH, and lucigenin; it was maximal 3 ± 1 min after the onset of the reaction (Fig. 1, curve 2). Increasing the concentration of NADPH from 60 to 1000 µM dose-dependently enhanced the chemiluminescence but had no effect on the peak of the curve. At constant concentrations of NADPH (200 µM) and microsomal protein (220 µg/ml), maximal intensity of chemiluminescence was observed at 4.3 µM lucigenin, in agreement with the data of Klinger et al. [4]. Addition of catalase (1000 units/ml), NaN3 (10 mM), and SOD (20 units/ml) inhibited the chemiluminescence by 7, 20, and 30%, respectively.
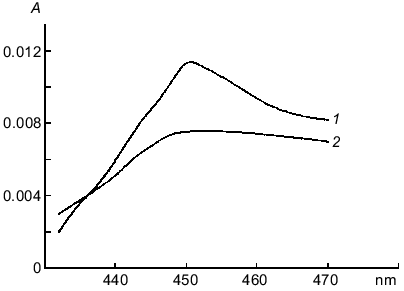
Preincubation of microsomes with NADPH (150 µM) for 2 min and subsequent bubbling of the suspension with CO for 1 min resulted in the appearance of the differential absorption spectrum specific for the complex of CO--reduced cytochrome P450. Subsequent addition of lucigenin induced decomposition of the carboxy complex (Fig. 4). When chemiluminescence was determined under the same conditions, addition of lucigenin to microsomes containing the carboxy complex enhanced the chemiluminescence by 20-80% (depending on the time of CO bubbling of the microsome suspension which varied from 20 to 60 sec). The chemiluminescence intensity increased by more than twofold in the presence of the carboxy complex when the reaction was performed in hypoxygenic medium in the control and samples (pO2 = 45 ± 4 mm Hg).
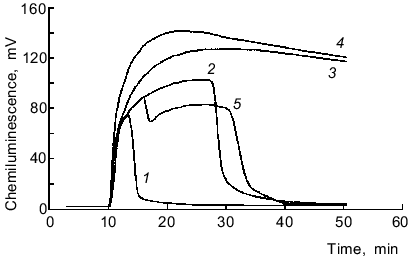
NADH/lucigenin-dependent chemiluminescence of microsomes. Chemiluminescence was maximal after 20 ± 5 min, and this level was constant for variable time intervals until all NADH in the medium was oxidized (over 1 h at 220 µg/ml of microsomal protein, 65 µM lucigenin, and >200 µM NADH) (Fig. 5). Increasing the concentration of microsomal protein from 330 to 880 µg/ml enhanced the maximal chemiluminescence and rapid oxidation of NADH; however, the integral values were similar (from addition of NADH to the beginning of chemiluminescence decrease in samples with minimal protein content). Similar data were obtained when the lucigenin concentration was increased from 80 to 320 µM (at constant concentration of microsomal protein). A second addition of NADH induced chemiluminescence with somewhat lower maximal values. Catalase (1000 units/ml) did not inhibit chemiluminescence, and NaN3 (10 mM) lowered the integral values by 12%. SOD (20 units/ml) lowered the integral chemiluminescence by 20% (from addition of the enzyme to beginning of chemiluminescence lowering in samples with SOD). However, in the presence of SOD chemiluminescence lasted for a longer time, and the integral chemiluminescence was decreased by only 6% if calculated from addition of the enzyme to oxidation of all the NADH in samples without SOD (Fig. 5, curves 2 and 5). Thus, the rate of NADH oxidation in the presence of SOD is apparently lowered. Bubbling of the samples with CO 2 min after preincubation with NADH (500 µM) and subsequent addition of lucigenin did not significantly influence the chemiluminescence parameters versus the control (without CO).Fig. 4. Differential spectra of the complex CO--reduced hemoprotein before (1) and after the addition of 65 µM lucigenin (2). Microsomal hemoprotein was reduced with NADPH (150 µM, 2 min) and the suspension was bubbled with CO for 1 min. The concentration of microsomes was 300 µg protein per ml.
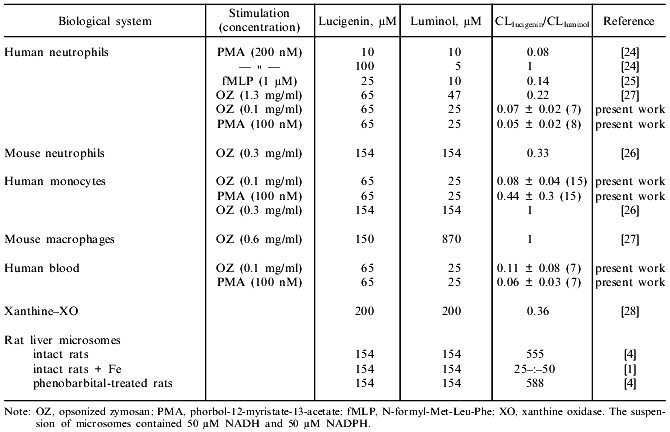
The sensitivity of the 1251 luminometer was not sufficient to register the luminol-dependent chemiluminescence of microsomes in the presence of either NADPH or NADH. The results of Klinger et al. [4] indicate that the luminol-dependent chemiluminescence of rat liver microsomes is 100-1000-fold lower (depending on the concentrations of the reagents) than lucigenin-dependent chemiluminescence when recalculated per mg protein. In the present work, luminol-dependent chemiluminescence was not measured because the study was performed using the 1251 luminometer whose sensitivity is significantly lower than the sensitivity of the scintillation counter used in most of the cited studies. Comparison of ratios of intensities of lucigenin- versus luminol-dependent chemiluminescence in various systems during generation of reactive oxygen species [1, 4, 24-28] indicates that the values are unexpectedly high in microsomes (Table 2). In systems containing luminol and phagocytes, degranulation of the cells is important for the development of chemiluminescence; this is associated with the appearance of peroxidases which catalyze oxidation of luminol in the presence of H2O2. In the case of lucigenin, this pathway is not important. For example, in patients with myeloperoxidase deficiency (chronic granulomatosis), luminol-dependent chemiluminescence of neutrophils is virtually absent, whereas lucigenin-dependent chemiluminescence of these cells is similar to that of healthy controls [24]. Studies on the effect of SOD on lucigenin-dependent chemiluminescence of microsomes indicate that luminescence cannot be explained only by generation of O2-· and its subsequent interaction with the luminophore (reaction (1)). Klinger et al. demonstrated weak inhibition of SOD and catalase in liver microsomes and suggested that the process is due to interaction of hydroxyl radicals (OH·) generated with lucigenin [4]. However, generation of OH· in the microsomal fraction implies that at first, O2-· and H2O2 should appear in the medium. Also, luminol better permeates through biomembranes than lucigenin [24]. On the other hand, luminol-dependent chemiluminescence of liver microsomes is almost completely blocked by SOD [4, 29]. Thus, weak inhibition of NAD(P)H/lucigenin-dependent chemiluminescence of liver microsomes by SOD and catalase cannot be determined only by the inability of the enzymes to penetrate to the regions of microsomes where O2-· interacts with the luminophores. Apparently, luminol-dependent chemiluminescence better corresponds to the baseline production of reactive oxygen species in microsomes, whereas lucigenin-dependent chemiluminescence is due to enzymatic reduction of lucigenin and generation of O2-· during the redox cycle of lucigenin radicals and subsequent enzymatic and/or spontaneous (via peroxy radicals) formation and decomposition of dioxetane (Luc = O2) emitting light quanta. This pathway can take place independently of generation of free O2-·:Fig. 5. NADH/lucigenin-dependent chemiluminescence of microsomes. NADH was added at the 10th min of incubation to make the final concentration 15 (1), 60 (2), 250 (3), or 500 µM (4); 5) same as (2) but at the 16th min SOD was added (20 units/ml). Concentrations of lucigenin and microsomes correspond to the values indicated in the legend to Fig. 1.
The time characteristics of the process are evident from the comparison of the plots of chemiluminescence and rates of oxidation of NADPH and NADH; the rate of NADPH consumption in a microsome suspension with lucigenin was maximal during the first minute of the reaction, whereas the peak of chemiluminescence was observed in 3 ± 1 min (Fig. 1); the rate of NADH consumption was almost linear during the whole period of observation (about 30 min), whereas chemiluminescence was maximal only in 20 ± 5 min (Fig. 5).
Fourfold increase in NADH-dependent oxygen consumption after the addition of lucigenin (250 µM) to smooth muscle microsomes from calf pulmonary artery [9] suggests that lucigenin is a substrate of NAD(P)H oxidoreductases. Also, lucigenin is reduced by endothelial NO-synthase [19]; the C-terminal domain of this enzyme is homologous to NADPH reductase and has cytochrome c reductase and ferricyanide reductase activities [30]. The values of NADH/lucigenin-dependent chemiluminescence and NADH-cytochrome c reductase activity are tightly associated in the smooth muscle fraction from pulmonary artery [8].
Decrease in chemiluminescence intensity at increased concentrations of lucigenin (5-100 µM) at constant concentrations of microsomal protein and NADPH may be due to inactivation of cytochrome P450 by an increased fraction of uncoupled redox cycles on the components of cytochrome P450 and generation of high amounts of the radicals and H2O2 [31]. Peak-shaped curves of NADPH-dependent chemiluminescence at increased concentration of NADPH may be due to high lucigenin reductase activity of NADPH-cytochrome P450 reductase and participation of reduced heme of cytochrome P450 in decomposition of dioxetane even if oxygenase activity of the enzyme is suppressed. On the other hand, a prolonged plateau on the plot of NADH/lucigenin-dependent chemiluminescence and weak enhancement of the peak chemiluminescence values at high concentrations of NADH suggest that microsomal NADH reductases are less important for generation of dioxetane and/or its decomposition. Under aerobic conditions, NADH cannot reduce cytochrome P450 due to the high rate of its autoxidation [32].
Enhanced chemiluminescence intensity after bubbling of a microsome suspension with CO can be explained by preservation of the reduced form of P450 which is released from the CO--P450 complex after addition of lucigenin and participates in enzymatic generation of dioxetane and by decomposition of unstable dioxetane catalyzed by the carboxy complex. At low CO concentrations, CO is competitively expelled from the CO--P450 complex by the substrate [33]. This apparently results in formation of new intermediate states of cytochrome P450 with modified reactivity including the triple complexes lucigenin--P450--CO and dioxetane--P450--CO.
The rate of electron transfer in the microsomal oxygenase system is significantly determined by the lipid phase [32]. Addition of lipids to the purified fractions of cytochrome P450 reductase and cytochrome P450 mixed at equimolar ratios did not enhance lucigenin-dependent chemiluminescence [4]. However, these data may confirm the suggestion that microsomal (di)oxygenases do not participate in the reaction of oxygen with lucigenin, because the experiment was performed at high concentrations of lucigenin (154 µM) which can inactivate the hemoprotein.
Incorporation of molecular oxygen into lucigenin on cytochrome P450 can be similar to other substrates of P450 [32]. Light quanta are generated during decomposition of unstable dioxetane directly on cytochrome P450 or after dissociation of the dioxetane. Evidently, in the latter case the quantum yield of chemiluminescence would be significantly higher because of lowered probability of non-radiative energy transfer on the heme of cytochrome P450.
Spontaneous (i.e., without exogenous luminophores) NAD(P)H-dependent luminescence of eukaryotic microsomes is determined by NADH-cytochrome b5 reductase and NADPH-cytochrome P450 reductase as well as cytochrome P450 [34-36]. Also, soluble multicomponent bacterial cytochromes P450 are important for bacterial chemiluminescence [36]. The reaction of cytochrome P450 with a hydrophobic substrate is exothermic and its total free energy is enough for emission excitation and emission of light quanta [36]. According to EPR studies, generation of reactive oxygen species in a suspension of liver microsomes predominantly occurs on the initial component of cytochrome P450, NADPH-cytochrome P450 reductase [37]. However, formation of O2-·, H2O2, and OH· in a suspension of microsomes is not very important for spontaneous chemiluminescence; the main role is played by endogenous aliphatic aldehydes and ketones that are oxidized directly by cytochrome P450 [34, 35]. Addition of an exogenous substrate, lucigenin, to a suspension of microsomes dramatically enhances luminescence intensity; emission of light quanta still occurs as the result of redox-dependent generation of an excited substrate on the components of cytochrome P450. Metabolism of lucigenin on the enzyme complex NAD(P)H-cytochrome P450 reductase--cytochrome P450 is apparently similar to the well-described bioluminescence reactions resulting from lucigenin conversion by the bacterial complex NAD(P)H--FMN oxidoreductase--luciferase. The possible activation of luminophores including analogs of luciferin and laser dyes [38] by the components of cytochrome P450 and oxidoreductases with wide substrate specificity should be considered during the development of new probes for registration of lipid peroxidation and production of reactive oxygen species.
Thus, lucigenin-dependent chemiluminescence of microsomes may be due to several factors including enzymes with lucigenin reductase activity (NADPH-cytochrome P450 reductase, NADH-cytochrome b5 reductase), formation of O2-· during the redox cycle of lucigenin radicals, generation of dioxetane by (di)oxygenases, and catalysis of dioxetane decomposition by the heme of cytochrome P450 associated with emission of light quanta. The data of the present work suggest that lucigenin should not be used to measure reactive oxygen species by chemiluminescence in tissue homogenates with high content of NAD(P)H oxidoreductases and in particular, in suspensions of microsomes. Addition of lucigenin to microsomes increases the yield of O2-· by several orders of magnitude versus the baseline. This also suggests that calibration plots of intensity of lucigenin-dependent chemiluminescence versus O2-· concentration are not valid as well as plots of lucigenin-dependent chemiluminescence versus lucigenin concentration based on the data obtained in an experimental system (for example, xanthine--xanthine oxidase) and they cannot be used for assay of O2-· in another system; also, addition of SOD is not enough to justify the specificity of the method (considering evaluation of baseline production of O2-· by a biological system). Lowering of lucigenin concentration to 1-5 µM is recommended by certain studies [28]; this can result in registration of di(oxygenase) activity of microsomes by chemiluminescence. Addition of Fe ions significantly increases the formation of reactive oxygen species in the system [1] but does not eliminate lucigenin reductase activity of NAD(P)H oxidoreductases by the subcellular fraction. On the other hand, lucigenin can be used as an artificial substrate for chemiluminescence studies of activity of the enzyme complex NAD(P)H-cytochrome P450 reductase--cytochrome P450 in various model systems.
REFERENCES
1.Lashneva, N. V., Karge, E., Knells, J., Klinger,
W., Schplinter, F.-K., and Tutel'yan, V. A. (1996) Vopr. Med.
Khim., 42, 119-124.
2.Barth, A., Kaiser, N., Loffler, U., Sourgens, H.,
and Klinger, W. (1994) Exp. Toxicol. Pathol., 46,
483-489.
3.Kahl, R., Weimann, A., Weinke, S., and Hildebrandt,
A. G. (1987) Arch. Toxicol., 60, 158-162.
4.Klinger, W., Karge, E., Kretzschmar, M., Rost, M.,
Schulze, H.-P., Dargel, R., Reinemann, C., and Rein, H. (1996) Exp.
Toxicol. Pathol., 48, 447-460.
5.Madra, S., Mann, F., Francis, J. E., Manson, M. M.,
and Smith, A. G. (1996) Toxicol. Appl. Pharmacol., 136,
79-86.
6.Mohazzab, H. K. M., Kaminski, P. M., and Wolin, M.
S. (1994) Am. J. Physiol. (Heart Circ. Physiol.), 266,
H2568-H2572.
7.Mohazzab, H. K. M., Kaminski, P. M., and Wolin, M.
S. (1997) Circulation, 96, 614-620.
8.Mohazzab, H. K. M., and Wolin, M. S. (1994) Am.
J. Physiol. (Lung Cell. Mol. Physiol.), 267, L815-L822.
9.Mohazzab, H. K. M., and Wolin, M. S. (1994) Am.
J. Physiol. (Lung Cell. Mol. Physiol.), 267, L823-L831.
10.Caraceni, P., Ryu, H. S., van Thiel, D. H., and
Borle, A. B. (1995) Biochim. Biophys. Acta, 1268,
249-254.
11.Fulton, D., McGiff, J. C., Wolin, M. S.,
Kaminski, P., and Quilley, J. (1997) J. Pharm. Exp. Ther.,
280, 702-709.
12.Gasbarrini, A., Pasini, P., Nardo, B., De
Notariis, S., Simoncini, M., Cavallari, A., Roda, E., Bernardi, M., and
Roda, A. (1998) Free Rad. Biol. Med., 24, 211-216.
13.Paky, A., Michael, J. R., Burke-Wolin, T., Wolin,
M. S., and Gurtner, G. H. (1993) J. Appl. Physiol., 74,
2868-2874.
14.De Sole, P., Lippa, S., and Littaru, G. P. (1984)
Acta Med. Rom., 22, 178-195.
15.Borunov, E. V., Schepetkin, I. A., Cherdyntsev,
E. S., and Cherdyntseva, N. V. (1993) Klin. Lab. Diagn.,
4, 13-16.
16.Schepetkin, I. A., Volyntseva, I. B., Borunov, E.
V., Antipova, E. A., Naumov, S. A., and Udut, V. V. (1991) Byul.
Eksp. Biol. Med., 111, 175-177.
17.Schepetkin, I. A., Cherdyntseva, N. V., Borunov,
E. V., Skutina, I. L., and Naumov, S. A. (1991) J. Cancer Res. Clin.
Oncol., 117, 172-174.
18.Liochev, S. I., and Fridovich, I. (1997) Arch.
Biochem. Biophys., 337, 115-120.
19.Vasquez-Vivar, J., Hogg, N., Pritchard, K. A.,
Jr., Martasek, P., and Kalyanaraman, B. (1997) FEBS Lett.,
403, 127-130.
20.Livertoux, M. H., Lagrange, P., and Minn, A.
(1996) Brain Res., 725, 207-216.
21.Cobb, L. M., Hacker, T., and Nolan, J. (1990)
Br. J. Cancer, 61, 524-529.
22.Schepetkin, I. A. (1998) Biochemistry
(Moscow), 63, 1621-1629 (Russ.).
23.Li, Y., Zhu, H., Kuppusamy, P., Roubaud, V.,
Zweier, J. L., and Trush, M. A. (1998) J. Biol. Chem.,
273, 2015-2023.
24.Aniansson, H., Stendahl, O., and Dahlgren, C.
(1984) Acta Path. Microbiol. Immunol. Scand. (Sect. C),
92, 357-361.
25.Edwards, S. W. (1987) J. Clin. Lab.
Immunol., 22, 35-39.
26.Muller-Peddinghaus, R. (1984) Int. J.
Immunopharmacol., 6, 455-466.
27.Pauksens, K., Sjolin, J., and Venge, P. (1989)
Scand. J. Infect. Dis., 21, 277-284.
28.Vondracek, J., Lojek, A., Ciz, M., and Duskova,
M. (1996) Int. J. Immunopathol. Pharm., 9, 101-107.
29.Yang, M., Luo, Y., and Liu, Y. (1992) Biomed.
Environ. Sci., 5, 336-348.
30.Shumyantseva, V. V., Avdeenko, Yu. L.,
Moskvitova, T. L., and Archakov, A. I. (1997) Vopr. Med. Khim.,
43, 67-81.
31.Karuzina, I. I., and Archakov, A. I. (1985)
Biokhimiya, 50, 1805-1810.
32.Archakov, A. I., and Bachmanova, G. I. (1990)
Cytochrome P-450 and Active Oxygen (Taylor and Francis, eds.)
London, p. 105.
33.Davydov, R. M., Greshner, Z., Stepanov, S. V.,
and Ruckpaul, C. (1980) Mol. Biol. (Moscow), 14,
685-693.
34.Puntarulo, S., and Cederbaum, A. I. (1993)
Biochim. Biophys. Acta, 1157, 1-8.
35.Puntarulo, S., and Cederbaum, A. I. (1996)
Biochim. Biophys. Acta, 1289, 238-246.
36.Danilov, V. S. (1987) Dokl. AN SSSR,
294, 1477-1480.
37.Kagan, V. E., Serbinova, E. A., Minin, A. A.,
Savov, V. M., Novikov, K. N., Osipov, A. N., Zubarev, V. E., and
Azizova, O. A. (1985) Biokhimiya, 50, 986-991.
38.Koga, S., and Nakano, M. (1992) Biochem.
Biophys. Res. Commun., 186, 1087-1093.