Adaptation to Salt Stress in a Salt-Tolerant Strain of the Yeast Yarrowia lipolytica
E. N. Andreishcheva1, E. P. Isakova1, N. N. Sidorov2, N. B. Abramova3, N. A. Ushakova4, G. L. Shaposhnikov1, M. I. M. Soares5, and R. A. Zvyagilskaya1*
1Bach Institute of Biochemistry, Russian Academy of Sciences, Leninskii pr. 33, Moscow, 110071 Russia; fax: (7-095) 954-2732; E-mail: inbio@glas.apc.org2Russian Research Institute of Fishing Industry and Oceanography, Verkhnyaya Krasnosel'skaya ul. 17, Moscow, 104007 Russia; fax: (7-095) 264-9187
3Koltsov Institute of Developmental Biology, Russian Academy of Sciences, ul. Vavilova 26, Moscow, 117334 Russia; fax: (7-095) 135-8012; E-mail: neifakh@ibrran.msk.su
4Severtsov Institute of Ecology and Evolution, Russian Academy of Sciences, Leninskii pr. 33, Moscow, 117071 Russia; fax: (7-095) 954-5534; E-mail: sevin@glas.apc.org
5Environmental Microbiology Unit of the Blaunstein Institute for Desert Research, Ben Gurion University of the Negev, Sede Boqer 84993, Israel; fax: + 972-7-565; E-mail: soares@bgumail.bgu.ac.il
* To whom correspondence should be addressed.
Received January 20, 1999; Revision received April 20, 1999
We have studied the cellular mechanisms underlying adaptation to salt stress in a newly isolated osmo- and salt-tolerant strain of the yeast Yarrowia lipolytica. When cells are incubated in the presence of 9% NaCl, a rapid change in their size and shape is observed. Salt stress is accompanied by an increase in the intracellular level of glycerol, free amino acids (notably proline and aliphatic amino acids), and Na+, as well as by changes in lipid and fatty acid composition.
KEY WORDS: Yarrowia lipolytica, yeast, salt stress, adaptation
Natural ecosystems that are classified as extreme environments by human standards (e.g., excessively hot, acidic, alkaline, or hypersaline environments) are characterized by their lack of higher forms of life, but nonetheless they are inhabited by an abundance of microbial communities adapted to these ecological niches. Salinity as a major environmental parameter now deserves the attention of ecologists, microbial biochemists, physiologists, and biotechnologists because the protective mechanisms underlying salt-tolerance may well have profound commercial applications [1].
Various aspects of salt tolerance at cellular level have been studied for only a restricted group of yeasts, including Saccharomyces cerevisiae [2-6], Zygosaccharomyces rouxii [7-11], Debaryomyces hansenii [12, 13], and Pichia sorbitophilla [14, 15]. In spite of the great diversity in their degrees of salt-tolerance, these yeasts, when incubated or grown in the presence of high NaCl concentrations, display enhanced intracellular accumulation of osmolytes, in particular glycerol [6, 9, 14] and compatible ions [9]. Elevated osmotic pressure of the medium also activates the plasma membrane H+-ATPase [9, 16] and the Na+/H+ antiporter which use the proton electrochemical gradient on the plasma membrane as a driving force to eject excessive intracellular Na+ [10, 17]. In some yeasts adaptation to higher salinity is accompanied by an increased viscosity of the membranes due to an increased level of unsaturated fatty acids [7] or an increased length of fatty acyl residues [18].
The goal of this study was to identify the cellular processes underlying salt adaptation in an osmo- and salt-tolerant Yarrowia lipolytica strain, our own isolate from leaf surfaces of the salt-excreting arid plant Atriplex halimus. These yeast cells can grow over a wide range of pH in the presence of 12% NaCl, which makes them a convenient model system in salinity (salt adaptation) studies.
MATERIALS AND METHODS
Materials. Glucose, biotin, folic acid, thiamine, pyridoxine, p-aminobenzoate, niacin, pantothenate, EDTA, Tris, and methyl ethers of fatty acids were purchased from Sigma (USA). Yeast extract was from Difco (USA) and an enzyme combination kit for glycerol determination was from Boehringer Mannheim (Germany). Other reagents of analytical grade (of highest quality) were obtained from local suppliers.
Microorganism. The yeast strain used in this study was Yarrowia lipolytica (Wick.) van der Walt and Arx obtained as a pure isolate from epiphytic microflora of salt-excreting leaves of the Atriplex halimus plant (the Negev desert, Israel). The strain was identified by standard microbiological, physiological, and biochemical tests, as recommended for identification and classification of yeasts [19]. The identification was supported by the International Mycological Institute (Great Britain).
Growth conditions. Cells were routinely grown in 750-ml Erlenmeyer flasks in 100-ml batches of basal medium containing (g/liter): MgSO4·7H2O, 0.5; KH2PO4, 8.6; K2HPO4·3H2O, 0.1; (NH4)2SO4, 0.3; CaCl2, 0.15; yeast extract, 2; glycerol, 10. The medium (pH 5.5-5.6) also contained vitamins and traces elements in standard amounts. Flasks were agitated at 28°C on a rotary shaker (200 rpm). In some experiments, glycerol as the main carbon source was replaced by glucose or ethanol. NaCl concentrations were varied from 0.01 to 9%. Cell growth was monitored turbidimetrically by measuring the optical density at 540 nm or gravimetrically by drying biomass at 105°C for 48 h.
Cell size and shape. Cell size and shape were determined by computerized morphometry using a KS 300 automated analysis system (Kontion Elektronik, Germany) under an Axiolab light microscope (Zeiss, Germany) in the Center for Computerized Analysis of Images and Automated Morphometry at the Severtsov Institute of Ecology and Evolution, Russian Academy of Sciences, and the School of Biology of Moscow State University.
Scanning electron microscopy. Cells grown in basal medium containing 0.01 or 9% NaCl were collected in the late-exponential phase by filtration through bacterial filters, fixed with 2.5% glutaraldehyde in 0.1 M phosphate buffer (pH 7.1) for 2 h at 4°C, washed with phosphate buffer, dehydrated with increasing concentrations of ethanol, postfixed with 2% OsO4 in 0.1 M cacodylate buffer, pH 7.4, coated with gold, and analyzed with an EOL JEM-1210 field emission electron microscope. Upon treatment of salt-grown cells, all buffers were supplemented with 9% NaCl.
Intracellular glycerol content. Cells were grown in basal medium containing 0.01, 6, or 9% NaCl and 1% glucose instead of glycerol. They were harvested in the late-logarithmic phase by centrifugation at 6,000g for 1 min, suspended in double-distilled water (1 g of biomass in 5 ml), and heated on water bath at 95°C for 15 min. The extracts were centrifuged at 6,500g for 15 min, and the supernatant was used for glycerol assay with a commercial glycerol determination kit (Boehringer Mannheim GmbH).
Intracellular Na+ content. Samples (3 ml) of cells grown in basal medium containing 0.01, 1.5, 3, 4.5, 6, 7.5, or 9% NaCl were harvested in the exponential phase by filtration through Synpor No. 2 filters (Barvy and Laky, Czechia) and rapidly washed three times with 5 ml of 20 mM MgCl2 and then three times with 5 ml of iso-osmotic concentrations of sorbitol. The cells on filters were immersed in 10 ml of double-distilled water and boiled for 15 min. The extract was cooled and centrifuged at 3,000g for 10 min. The supernatant was used for Na+ assay by atomic absorption photometry. The Na+ content is expressed as a percentage of dried biomass.
Intracellular free amino acids. Cells were incubated for 0.5, 1, or 2 h in basal medium containing 0.01 or 9% NaCl. The biomass was rapidly harvested by filtration through bacterial filters and treated twice with 75% ethanol on a water bath at 95°C for 15 min. The combined extract was centrifuged at 4,000g for 1 min, incubated successively with chloroform and trichloroacetic acid to remove lipids and proteins, respectively, and then deionized by passage through the cation exchanger Dowex-50 (Sigma). The purified extract was evaporated to dryness on a water bath. The residue was dissolved in 1 ml of water and used for total amino acid analysis with an amino acid analyzer.
Lipid analysis. Cells grown in basal medium in the presence of 0.01, 6, or 9% NaCl were harvested at late-logarithmic phase and lyophilized. Extraction of lipids and their analysis were performed as recommended in the monograph of Kates [20].
Fatty acid analysis. Methyl ethers of fatty acids were obtained by direct transmethylation of lyophilized biomass with 2% sulfuric acid in absolute methanol, purified using a Shimadzu gas-liquid chromatograph (Japan) as described earlier [21], and identified by co-chromatography with authentic standards. Unsaturation index was calculated by the following formula: [(% monoenoic acids + 2(% dienoic acids) + 3(% trienoic acids)]/100 [22].
RESULTS
The isolated Y. lipolytica strain readily utilized diverse carbon sources including hexoses, organic acids, ethanol, glycerol, erythritol, and n-hexadecane. Figure 1 shows curves of cell growth on glycerol, glucose, and ethanol. The strain was remarkable for its ability to grow in the presence of high NaCl concentrations. Figure 2 shows that only at high NaCl concentrations did NaCl significantly affect the final biomass yield, extend the lag phase, and reduce growth rate.
Fig. 1. Growth of Y. lipolytica cells on 1% glycerol (a), 1% glucose (b), and 1% ethanol (c): 1) control; 2) 9% NaCl. The bottom panels show changes in A540 during the initial period of salt stress.
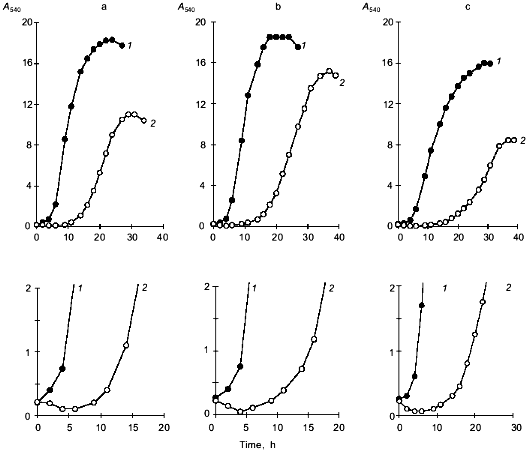
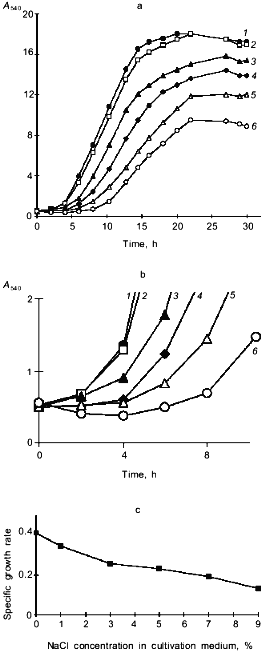
A decrease in A540 seen within the first 0.5-5 h following the salt challenge (Figs. 1 and 2b) suggests that the investigated strain copes with the imposed salt stress using the mechanism for the short-term adaptation already described for other salt-tolerant yeast species [8], i.e., a decline in cell size, which allows the cells to rapidly increase the intracellular concentrations of solutes to counterbalance the elevated external osmotic pressure. To further quantify the changes in the shape and size of Y. lipolytica cells grown under saline conditions, we used an approach utilizing computerized morphometry.Fig. 2. Growth of Y. lipolytica cells in 1% glycerol medium in the presence of varying NaCl concentrations (%): 1) 0.01; 2) 1; 3) 3; 4) 5; 5) 7; 6) 9. a) Growth curves; b) growth curves during the initial period; c) specific growth rates as a function of NaCl in growth medium.
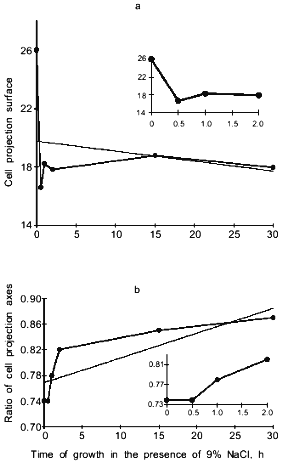
When cells were incubated in the presence of 9% NaCl, the surface of cell projections drastically decreased during the first 30 min after the increase in salt concentration, partially recovered during the next 30 min, and then remained almost constant (Fig. 3a). The ratio of cell projection axes gradually increased, approaching 1.0, indicating that the cells became progressively more round (Fig. 3b). Salt-induced changes in cell shape were also revealed by scanning electron microscopy (Fig. 4).
Fig. 3. Surface of cell projections (a) and ratio of cell projection axes (b) in Y. lipolytica grown in the presence of 9% NaCl. The inserts indicatechanges in cell projections during the first 2 h of salt adaptation.
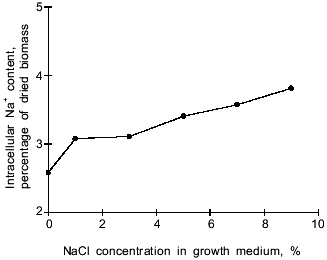
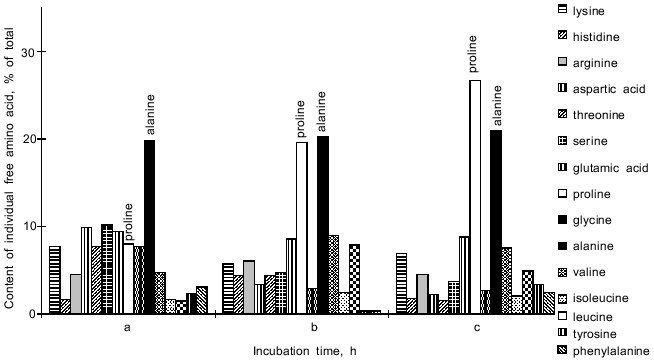
In the Y. lipolytica cells, higher salinity of the growth medium induced enhanced intracellular accumulation of glycerol (Fig. 5) and a small but reproducible increase in the intracellular Na+ content (Fig. 6). Likewise, salt stress was accompanied by a rapid accumulation of free amino acids (their content in the presence of 6 and 9% NaCl was threefold higher than in the control cells). Most spectacular was the considerable accumulation of proline (Fig. 7). It is worth noting the high level of alanine in Y. lipolytica cells grown both under normal and salt-stressed conditions (Fig. 7). When cells were incubated for 2 h in the presence of 9% NaCl, proline and alanine dominated in the total pool of free amino acids. The proportion of aliphatic amino acids was also augmented, possibly at the cost of glutamic and aspartic acids.Fig. 4. Scanning electron micrographs of Y. lipolytica cells: a) control; b) in the presence of 9% NaCl. 5000x magnification.
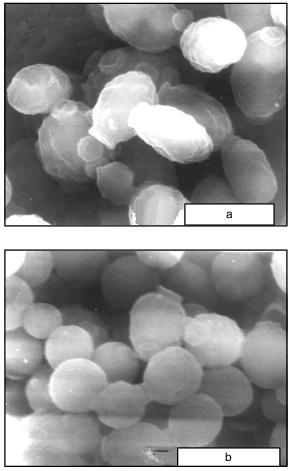
Fig. 5. Intracellular content of glycerol in Y. lipolytica cells grown under normal conditions (a) and in the presence of 6 (b) or 9% NaCl (c).
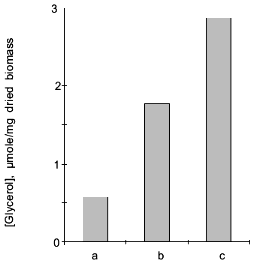
Fig. 6. Effect of NaCl in the medium on intracellular sodium ion content.
The total level of lipids in the Y. lipolytica salt-stressed cells remained fairly unchanged, although some alterations in the relative content of various lipids (as compared to the control) were observed (Fig. 8). Growth in the presence of 9% NaCl elicited an elevated level of phospholipids, the main constituents of cell membranes. The pool of free fatty acids also rose, most likely due to their less active utilization for the synthesis of triacylglycerols [23]. Indeed, the amounts of triacylglycerols and sterol ethers diminished under salt stress.Fig. 7. Relative content of free amino acids in Y. lipolytica cells incubated in the presence of 9% NaCl for 0 (a), 0.5 (b), and 1 h (c).
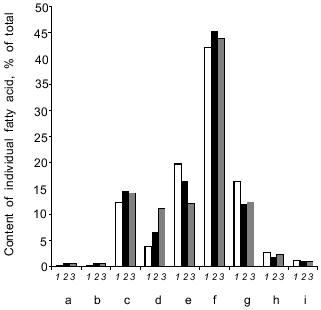
High NaCl concentrations (6 and 9%) in the growth medium triggered an increase in the proportion of C16:0, C16:1, and C18:1 fatty acids with a concomitant decrease in the proportion of C18:0 and C18:2 fatty acids. The relative content of minor (C14:0, C15:0) and long-chain (C20:0, C22:0) fatty acids remained almost constant (Fig. 9). As a result, salinity did not produce significant changes in the unsaturation index of fatty acids.Fig. 8. Lipid components upon growth of Y. lipolytica cells in the presence of 0.01 (a) and 9% NaCl (b). PL, phospholipids; MG, monoacylglycerols; DG + S, diacylglycerols + sterols; FFA, free fatty acids; TG, triacylglycerols; SE, sterol ethers; W, wax; HC, hydrocarbons.
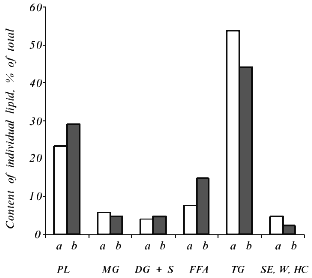
Fig. 9. Fatty acid composition in Y. lipolytica cells grownin the presence of 0.01 (1), 6 (2), and 9% NaCl (3): a) C14:0; b) C15:0; c) C16:0; d) C16:1; e) C18:0; f) C18:1; g) C18:2; h) C20:0; i) C22:0 fatty acids.
DISCUSSION
Cells of the isolated Y. lipolytica strain respond to salt stress using the same general principles of osmoregulation already found for most halotolerant yeasts [24]: decrease in cell size, enabling cells to concentrate the intracellular solution; enhanced production and accumulation of organic osmolytes, including glycerol and amino acids (primarily in the cytoplasm), as well as ions (possibly in vacuoles); increase in the relative content of monounsaturated fatty acids. Nevertheless, they have evolved some specific adaptive stress responses. Unlike Candida membranofaciens yeasts, which typically respond to NaCl stress by increased production of glutamic and aspartic amino acids [25], in Y. lipolytica salt-stressed cells the content of these amino acids drastically dropped in parallel with enhanced synthesis of free proline, which along with alanine became a dominant amino acid in the total pool of free amino acids (Fig. 7). In contrast to Z. rouxii [6], in Y. lipolytica cells changes in the relative content of fatty acids did not result in a marked change in the total unsaturation index (Fig. 9). The next step should be to study the mechanisms underlying salt adaption in Y. lipolytica at the level of individual compartments. We have already initiated these investigations, showing salt-induced adaptive changes at the level of the mitochondrial compartment [26].
This work was supported by the Russian Foundation for Basic Research (grant No. 97-04-49464).
REFERENCES
1.Galinski, E. A., and Trüper, H. G. (1994)
FEMS Microbiol. Rev., 15, 95-108.
2.Andre, L., Hemming, A., and Adler, L. (1991)
FEBS Lett., 286, 13-17.
3.Albertyn, J. (1994) Curr. Genet., 25,
12-18.
4.Albertyn, J., Hohmann, S., and Prior, B. A. (1994)
Mol. Cell. Biol., 14, 4135-4144.
5.Akhtar, N., Blomberg, A., and Adler, L. (1997)
FEBS Lett., 403, 173-180.
6.Andre, L., Nilsson, A., and Adler, L. (1988) J.
Gen. Microbiol., 134, 669-677.
7.Hosono, K. J. (1992) J. Gen. Microbiol.,
138, 91-96.
8.Nishi, T., and Yagi, T. (1992) FEMS Microbiol.
Lett., 99, 95-100.
9.Nishi, T., and Yagi, T. (1993) J. Gen. Appl.
Microbiol., 39, 493-505.
10.Nishi, T., and Yagi, T. (1995) J. Gen. Appl.
Microbiol., 41, 87-97.
11.Ohshiro, K., and Yagi, T. (1996) J. Gen. Appl.
Microbiol., 42, 201-212.
12.Lucas, C., Da Costa, M., and van Uden, N. (1990)
Yeast, 6, 187-191.
13.Larsson, C., and Gustafson, L. (1993) Canad.
J. Microbiol., 39, 603-609.
14.Lages, F., and Lucas, C. (1995) Yeast,
11, 111-119.
15.Oliveira, R. P., Lages, F., and Lucas, C. (1996)
FEMS Microbiol. Lett., 142, 147-153.
16.Watanabe, Y., Sanemitsu, Y., and Tamai, Y. (1993)
FEMS Microbiol. Lett., 114, 105-108.
17.Jia, Z.-P., McCullough, N., Martel, R.,
Hemmingsen, S., and Young, P. G. (1992) EMBO J., 11,
1631-1640.
18.Tunblad-Johanson, I., and Adler, L. (1987)
FEMS Microbiol. Lett., 43, 275-278.
19.Van der Walt, J. P., and Yarrow, D. (1994) in
Yeast Classification and Identification (Kreger-Van Rijk, N. J.
W., ed.) Elsevier, Amsterdam-N. Y.-Oxford, pp. 45-130.
20.Kates, M. (1986) in Techniques of Lipidology.
Isolation, Analysis and Identification of Lipids, 2nd ed.
(Burdon, R. H., and Van Knippenberg, P. H., eds.) Elsevier,
Amsterdam-N. Y.-Oxford, pp. 100-111.
21.Efremenko, A. A., Belov, A. P., Sultanovich, Yu.
A., and Gracheva, I. M. (1990) Prikl. Biokhim. Mikrobiol.,
26, 674-679.
22.Belov, A. P., Guselnikova, T. V., and Zinchenko,
G. A. (1996) Mikrobiologiya, 65, 348-351.
23.Watanabe, Y., and Takakuwa, M. (1984) Agric.
Biol. Chem., 48, 2415-2422.
24.Andreishcheva, E. N., and Zvyagilskaya, R. A.
(1999) Prikl. Biokhim. Mikrobiol., 35, 243-256.
25.Khaware, P. K., Jethwaney, D., and Prasad, R.
(1996) Biochem. Mol. Biol. Int., 39, 421-429.
26.Andreishcheva, E. N., Soares, M. I. M., and
Zvyagilskaya, R. A. (1998) Fiziol. Rast., 44,
657-664.