Comparative Analysis of Transcription Profiles of Helicobacter pylori Clinical Isolates
K. T. Momynaliev*, S. I. Rogov, O. V. Selezneva, V. V. Chelysheva, T. A. Akopian, and V. M. Govorun
Research Institute for Physico-Chemical Medicine, ul. Malaya Pirogovskaya 1a, 119992 Moscow, Russia; fax: (7-095) 245-4236; E-mail: d_horoshun@mail.ru* To whom correspondence should be addressed.
Received September 20, 2004; Revision received December 24, 2004
The transcription profiles of four Helicobacter pylori clinical isolates (two cag-negative and two cag-positive) were compared in stationary growth phase using a cDNA-macroarray. The correlation coefficient value between total transcription profiles of clinical isolates H. pylori varied from 0.70 to 0.83. For 44 groups of genes (total number 66) belonging to various functional classes of H. pylori, the correlation coefficient value between these isolates exceeded 0.7, and for 14 groups the value exceeded 0.9. These groups included genes encoding components involved in cell division, adaptations to atypical conditions, electron transport, salvage of nucleosides and nucleotides, glycolysis/gluconeogenesis, folding and stabilization of proteins, translation factors, anaerobic metabolism, and amino acids and amine metabolism. Expression of 52 genes significantly differed between H. pylori clinical isolates. Some of these genes determine microorganism virulence. They include: cytotoxin-associated gene (cagA), genes encoding neutrophil-activating protein (napA), major flagellar protein (flaA), and vacuolizing cytotoxin (vacA), some genes encoding outer membrane proteins (omp), urease alpha and beta subunits (ureA and ureB), and some regulatory proteins, and genes encoding stress-related proteins, such as the chaperone and heat shock protein genes (groEL and dnaK).
KEY WORDS: Helicobacter pylori, cDNA-macroarray, transcription profiles, correlation
Helicobacter pylori is a micro-aerophilic Gram-negative bacterium colonizing gastric mucosa of at least half of the World's population [1-3]. Chronic persistence of H. pylori in the stomach of most individuals occurs asymptomatically. Nevertheless, in some cases H. pylori causes acute or chronic gastritis and stomach or duodenal ulcers; certain evidence also exists that H. pylori infection is associated with the development of such malignant neoplasms as gastric adenocarcinoma and extranodal beta-cell MALT-lymphoma [4-7]. Development and progression of the disease depends on various environmental factors, conditions of the host, and strain-specific features of H. pylori. Like for other organisms, virulence of H. pylori is determined by the presence of the pathogenicity island (PAI) including more than 30 kb in genome and also by some other genes (vacA, iceA, babA, flaA, and flaB) [7-14]. However, the existence of certain interrelationship between the presence of these genes in H. pylori genome and incidence of gastric diseases in man has been demonstrated only in single cases [15]. Difficulties in elucidation of such interrelationship consist in significant macro- (gene mutation, chromosome rearrangements) and micro- (nucleotide polymorphism) heterogeneity of the genome of this microorganism.
Helicobacter pylori is the first bacterium with fully sequenced two genomes (full nucleotide sequences have been determined for genomes of two strains, 26695 and J99) [16-18]. Genomes of both strains contain the pathogenicity island. In genomes of J99 and 26695 strains 1495 and 1552 open reading frames (ORF) were identified. Eighty-nine (6%) of the ORF of J99 strain was not found in 26695 strain. Fifty-six of these J99-specific ORF did not exhibit any homology with genes annotated in public databases. Helicobacter pylori 26695 is characterized by 117 strain-specific ORF (7.5% of all ORF) and 91 of them are unique for this strain. Most of the strain-specific genes are localized in three regions: pathogenicity island HP0520-HP0548 and in two plasticity zones HP0423-HP0466 and HP0982-HP1028, respectively (in coordinates of H. pylori 26695). Use of DNA-micro- and macroarrays revealed that minimal functional core of H. pylori consists of 1270 genes [19, 20]. Genes constituting the functional core encode proteins involved in most metabolic processes, whereas the group of strain-specific genes (up to 20% of all ORF of the genome) includes unique genes of H. pylori, genes encoding enzymes of the restriction-modification system, transposases, and genes encoding cell surface proteins [19-21]. It is possible that combination of the strain-specific genes (variable part of genome) of H. pylori with generally known virulence factors determine the development of pathological processes in gastric mucosa.
DNA-micro- and macroarrays are widely used both for study of genome composition of H. pylori and for analysis of transcription profile [19-21]. Comparison of transcription profiles is usually employed for characterization of bacterial response to any external stimulus (heat shock, change of pH of cultivation medium, etc.). This approach may help to elucidate groups of (up- and down-regulated) genes, encoding proteins responsible for manifestation of microorganism adaptation.
The effects of various conditions on transcription profiles of individual strains of H. pylori have been studied in several laboratories [22-29]. However, no data are available on comparative analysis of transcriptional profiles of various H. pylori clinical isolates. Such information would be very useful for evaluation of universality of transcriptional profiles of H. pylori clinical isolates. In other words, it would be interesting to evaluate how heterogeneity of H. pylori genome influences functional activity of this microorganism.
So, in the present study we have investigated the interrelationship between genome heterogeneity of H. pylori and its transcription activity.
MATERIALS AND METHODS
Bacterial isolates and their cultivation. The following previously described clinical isolates of H. pylori [20] were used in this study (Table 1).
Table 1. Characteristics of clinical
isolates used in the study

Biopsy material was seeded onto dishes containing Pylori medium (Biomerieux, France) and incubated in anaerostats with gas generating packets for microaerophile cultivation (BBL, Campy Pak Plus, Becton Dickinson, USA) at 37°C for 48 h (stationary growth phase). Helicobacter pylori isolates were identified using urease, oxidase, and catalase tests. Bacterial cells were washed from the dishes with cold Tris-EDTA (TE) buffer, pH 7.4, and washed in this buffer several times.
Preparation of cDNA for hybridization. Total RNA was isolated from H. pylori clinical isolates using an RNAqueous-4PCR purification kit (Ambion, USA). RNA was isolated from two independent cultivations of each clinical isolate and subsequently used for independent cDNA synthesis and hybridization. Labeled cDNA was obtained using a cDNA Strip-EZ RT kit (Ambion) and specific oligonucleotides AR-OLHP-RT (Eurogentec, Belgium). The reaction mixture contained 1 µg total RNA and [alpha-33P]dATP (3000 Ci/mmol). Non-incorporated label was removed using ProbeQuant G-50 columns (Amersham, UK). Transcription profiles were analyzed using cDNA-macroarrays DNA Array Helicobacter Pylori (Eurogentec). These arrays are nylon membranes containing immobilized denatured 1565 PCR products; their nucleotide sequence corresponds to the sequence of full-sized ORF of H. pylori 26625. Membranes were used once.
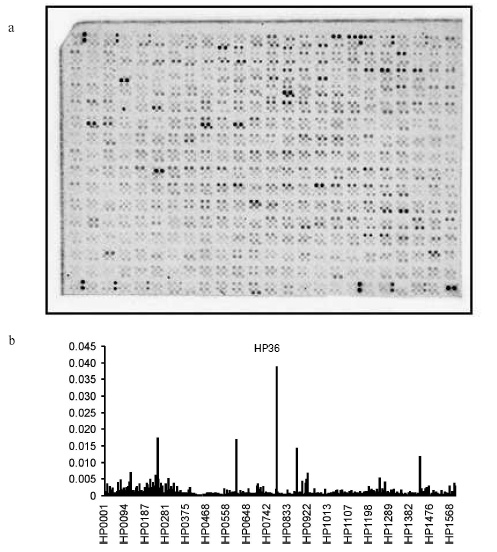
cDNA-macroarrays were prehybridized for 2 h at 65°C in 1× hybridization buffer (5× SSC, pH 7.5, 5× Denhardt's solution, 0.5% SDS) in a Hybridization Oven/Shaker (Amersham). Hybridization was carried out in 5 ml of 1× hybridization buffer containing 5.5*106 cpm/ml cDNA for 20 h at 65°C. After hybridization, the cDNA-macroarray was washed in 2× SSC with 0.1% SDS, then it was incubated in the same buffer for 20 min at 65°C, and finally it was incubated in 0.2× SSC with 0.1% SDS for 1 h at 65°C. Washed macroarrays were exposed to accumulating screen (Molecular Dynamics, USA) for 48 h and then they were scanned using Storm 820 (Molecular Dynamics) with resolution of 50 µm. Results of hybridization were analyzed using ImageQuant 5.1 software (Molecular Dynamics) (Fig. 1).
Data analysis. Transcription level for each gene was determined by two independent assays for each H. pylori clinical isolate. Basal mean was determined as median intensity signals around the spot region. Results of hybridization on cDNA-macroarray were normalized as follows: intensities of all cDNA-macroarray specific signals were summed and then the portion of intensity for each specific signal was determined as a portion of the total intensity of all signals. (Size of RNA transcripts was not taken into consideration.) Finally, mean values for transcription of each gene were calculated. Thus, each isolate was initially characterized by a 1565-sized transcription profile. Profiles of smaller sizes corresponding to functional gene groups were derived from the total transcription profile. Paired comparison of the transcription profiles was carried out using calculation of Pearson correlation coefficient. Results were statistically treated using Statistica software (StatSoft, USA).Fig. 1. a) Sample of H. pylori 26695 cDNA-macroarray after hybridization with labeled cDNA of H. pylori clinical isolate. b) Sample of distribution of hybridization intensity signals on cDNA-macroarray.
Real-time PCR. Real-time PCR was used for verification of data obtained by means of cDNA-macroarrays. The reaction of reverse transcription was carried out as follows. RNA (1 µg) was initially denatured at 94°C for 30 sec in 10 µl of a mixture containing (besides RNA) four types of dNTP (0.5 mM each) and 150 pmol of random hexamer primers. For primer annealing the mixture was incubated in ice for 30 min. After this incubation 20 U RNase inhibitor (Promega, USA), 200 U MMLV reverse transcriptase (Promega), and buffer for reverse transcription were added and the resultant mixture was incubated at 37°C for 30 min.
PCR was carried out in 50 µl of the reaction mixture containing 10 pmol of primers (Table 2), 0.003% SybrGreen, 25 mM Tris-HCl, pH 8.3, 2.5 mM MgCl2, 50 mM KCl, a mixture of four types of dNTP (0.2 mM each), and 2 U Taq-polymerase. Products were amplified and detected using an ABI PRISM 7000 Sequence Detection System (Applied Biosystems, USA) and MicroAmp Optical 96-well reaction plate/optical caps (Applied Biosystems) in the following mode: denaturation at 94°C for 2 min followed by 40 cycles: 93°C for 30 sec, 50°C for 30 sec, and 72°C for 30 sec. Amplification results were treated using Sequence Detection System software version 1.6 (Applied Biosystems).
Table 2. Primers used for real-time PCR

*According to TIGR annotation.
1Hypothetical genes.
RESULTS AND DISCUSSION
Studying transcription profiles of H. pylori clinical isolates, we found that number of genes characterized by hybridization signal intensity (HSI) on cDNA-macroarray not less than 0.1% of total intensity varied from 466 (isolate HP50) to 572 (isolate HP37). Number of genes with HSI exceeding mean values of HSI on cDNA-macroarray by more than 2 SD (standard deviation) values also varies in clinical isolates studied and includes 15 (HP36), 36 (HP37), 30 (HP46), and 31 genes (HP50) (Table 3).
Table 3. ORF of H. pylori clinical
isolates characterized by maximal HSI on cDNA-macroarray of H.
pylori 26695 (exceeding mean intensity value by more than 2 SD)

In this group of genes, eleven genes (marked in gray) were found in all H. pylori clinical isolates including genes HP0601 (flaA), HP1243 (omp28), and HP0875 (catA). This group also contained genes representing one operon (HP0236-HP0237-HP0238-HP0239-HP0240-HP0241-HP0242-HP0243) and two genes encoding small peptides HP0784 (44 amino acid residues) and HP1427 (60 amino acid residues). HSI of the former varied from 1.5 to 3.8% of total HSI on cDNA-macroarray in all clinical isolates.
For verification of these results, we employed SybrGreen for real-time PCR analysis as an alternative express method of evaluation of gene transcription activity. Genes differing by HSI on H. pylori cDNA-macroarray were selected for testing (Table 4).
Table 4. Comparison of hybridization results
of cDNA of corresponding genes of four H. pylori clinical
isolates on cDNA-macroarray of H. pylori 26695 (1) with
real-time PCR data (2)

Note: 1) Portion of gene hybridization intensity signal (%) on
cDNA-macroarray of total intensity signals of all genes; 2) threshold
cycle of gene amplification at which fluorescence intensity was at
least ten times higher than SD of fluorescence baseline
(Ct). Correlation was calculated by an absolute mean.
aGroup of genes with HSI more than 1% of total signal
intensity.
bGroup of genes with 1% > HSI > 0.1%.
cGroup of genes with 0.1% > HSI > 0.01%.
dGene with HSI < 0.001%.
The threshold cycle (Ct) was used as real-time PCR parameter; this was characterized by fluorescence intensity of bound dye, which was one order of magnitude higher than SD of fluorescence baseline. Data of Table 4 show that Ct mean at amplification of the HP0784 gene was minimal for all clinical isolates and in most cases it did not exceed 10. This suggests the highest expression level of this gene in all isolates. Results of real-time PCR also confirmed significant expression level of the HP0243 gene (neutrophil activating protein (napA), Ct < 15) in all H. pylori clinical isolates and of the HP0875 gene (encoding catalase (catA), Ct < 12) in HP36, HP37, and HP50. For a selected group of genes Pearson correlation coefficient between results obtained by means of cDNA-macroarrays and real-time PCR was not less than 0.7 for all clinical isolates. These results suggest that HSI on H. pylori cDNA-macroarray was strictly proportional to expression level of the corresponding gene.
We analyzed further correlation between total transcription profiles of H. pylori clinical isolates. The correlation coefficient between cag-negative isolates (HP36 and HP37) was 0.83, whereas in the case of cag-positive isolates (HP46 and HP50) it was slightly lower, 0.76. The correlation coefficient for transcription profiles of cag-negative and cag-positive isolates was 0.73. These data suggest that calculation of the correlation coefficient for total transcription profiles of H. pylori clinical isolates is poorly informative and it does not allow finding genotypic features of certain clinical isolate. So we have compared transcription profiles for groups of genes of certain functional classes. There are 16 classes and 66 groups of genes in H. pylori. We found 44 groups of genes characterized by the correlation coefficients for all H. pylori clinical isolates >0.7. For 14 groups of genes the correlation coefficient exceeded 0.9. These include groups of genes encoding proteins involved in cells division, adaptations to atypical conditions, electron transport, salvage of nucleosides and nucleotides, glycolysis/gluconeogenesis, protein folding and stabilization, translation factors, anaerobic conditions, and amino acids and amines. It is possible that number of highly correlated groups (44 of 66) may be explained by the fact that genes of these groups encode proteins involved in cell and metabolic processes, which are ultimately required for H. pylori (they represent a basis for microorganism viability) [16-18, 30]. There was high correlation not only for groups of genes belonging to certain functional class but also for the whole functional classes (e.g., protein synthesis, 4 groups, 94 genes). Many highly correlated groups were found in the class of amino acid biosynthesis (4 of 5), cellular processes (6 of 8), and transport and binding proteins (4 of 7). Total lack of correlation (0-0.1) between transcription profiles was found for such groups as pathogenesis, detoxification, and plasmid functions responsible for microorganism virulence.
For elucidation of groups of genes characterized by significant differences in expression levels in H. pylori clinical isolates, we employed the principal component analysis (Fig. 2). This method was used here as the method of data reduction. This method includes linear conversion at which directions of new coordinate axes correspond to directions of highest variations of the initial data. For these purposes, paired orthogonal directions with maximal variation of initial data are determined and after that data are projected onto the least square formed by the most variable components. Using this method, we found 52 genes characterized by significant differences in their expression between H. pylori clinical isolates. This group contains genes of various classes, but most of these genes are responsible for virulence of H. pylori. They include cytotoxin-associated gene (cagA), genes encoding neutrophil-activating protein (napA), major flagellar protein (flaA), and vacuolizing cytotoxin (vacA), some genes encoding outer membrane proteins (omp), some urease subunits (ureA and ureB), and some regulatory proteins, and also genes encoding such stress proteins as chaperones and heat shock proteins, groEL and dnaK.
Thus, each clinical isolates is characterized not only by a unique set of genes [19-21], including strain specific genes; clinical isolates are also characterized by significant differences in expression of genes playing a key role in microorganism virulence.Fig. 2. Diagram showing distribution of gene expression in H. pylori clinical isolates obtained by the method of principal components.
It should be noted that the correlation coefficient between total transcription profiles of H. pylori clinical isolates was significantly higher than the correlation coefficient between distribution of genes in genomes of the clinical isolates, 0.73-0.86 and 0.45-0.7, respectively. Thus, analysis of correlation coefficient suggests that macro-heterogeneity of H. pylori clinical isolates [16, 31-36] insignificantly influences behavior of transcription profiles. In this study, we have demonstrated that comparison of total transcription profiles gives only general consideration of transcription activity of various H. pylori isolates. Search for correlation between transcription profiles of groups of genes belonging to certain functional class appears to be more informative. Correlation analysis of transcription profiles of gene groups may be used for characterization and detection of new features of H. pylori clinical isolates.
REFERENCES
1.Sherbakov, P. L. (1999) in Helicobacter pylori:
Revolution in Gastroenterology (Ivashkin, V. T., Megro, F., and
Lapina, T. L., eds.) [in Russian], Triada-X, Moscow.
2.Poundeyr, R. E., and Ng, D. (1995) Aliment.
Pharmacol. Ther., 9, S33-S39.
3.Pretolani, S., Bonvicini, R., and Gasbarrini, G.
(1997) in Helicobacter pylori. An Atlas (Malrertheiner, P.,
Michetti, P., and Price, A., eds.) Science Press Limited, London, pp.
2.1-2.6.
4.Blaser, M. J., Perez-Perez, G. I., Kleanthous, H.,
Cover, T. L., et al. (1995) Cancer Res., 55,
2111-2115.
5.Nomura, A., Stemmermann, G. N., Chyou, P. H., Kato,
I., et al. (1991) New Engl. J. Med., 325, 1132-1136.
6.Parsonnet, J., Friedman, G. D., Vandersteen, D. P.,
Chang Y., et al. (1991) New Engl. J. Med., 325,
1127-1131.
7.Peterson, W. L. (1991) New Engl. J. Med.,
324, 1043-1048.
8.Gerhard, M., Rad, R., Prinz, C., and Naumann, M.
(2002) Helicobacter, 7, S17-S23.
9.Covacci, A., Telford, J. L., Del Giudice, G.,
Parsonnet, J., et al. (1999) Science, 284, 1328-1333.
10.Blaser, M. J. (1996) Aliment. Pharmacol.
Ther., 10, S73-S77.
11.Atherton, J. C., Cao, P., Peek, R. M. J.,
Tummuru, M. K., et al. (1995) J. Biol. Chem., 270,
17771-17777.
12.Peek, R., Thompson, S., Donahue, J., Tham, K., et
al. (1998) Proc. Assos. Am. Physicians, 110, 58-66.
13.Ilver, D., Arnquist, A., Ogren, J., Frick, I., et
al. (1998) Science, 279, 373-377.
14.Xiang, Z., Censini, S., Bayeli, P. F., Telford,
J. L., et al. (1995) Infect. Immun., 63, 94-98.
15.Gerhard, M., Lehn, N., Neumayer, N., Boren, T.,
et al. (1999) Proc. Natl. Acad. Sci. USA, 96,
12778-12783.
16.Alm, R. A., and Trust, T. J. (1999) Mol.
Med., 77, 834-846.
17.Tomb, J. F., White, O., Kerlavage, A. R., et al.
(1997) Nature, 388, 539-547.
18.Alm, R. A., Ling, L.-S. L., Moir, D. T., et al.
(1999) Nature, 397, 176-180.
19.Salama, N., Guillemin, K., McDaniel, T. K.,
Sherlock, G., et al. (2000) Proc. Natl. Acad. Sci. USA,
97, 14668-14673.
20.Momynaliev, K. T., Smirnova, O. V., Kudryavtseva,
L. V., and Govorun, V. M. (2003) Mol. Biol. (Moscow), 37,
625-633.
21.Chanto, G., Occhialini, A., Gras, N., Alm, R., et
al. (2002) Microbiology, 148, 3671-3680.
22.Ang, S., Lee, C. Z., Peck, K., Sindici, M.,
Matrubutham, U., Gleeson, M. A., and Wang, J. T. (2001) Infect.
Immun., 69, 1679-1686.
23.Wen, Y., Marcus, E. A., Matrubutham, U., Gleeson,
M. A., Scott, D. R., and Sachs, G. (2003) Infect. Immun.,
71, 5921-5939.
24.Allan, E., Clayton, C. L., McLaren, A., Wallace,
D. M., and Wren, B. W. (2001) Microbiology, 147,
2285-2292.
25.Niehus, E., Gressmann, H., Ye, F., Schlapbach,
R., Dehio, M., Dehio, C., Stack, A., Meyer, T. F., Suerbaum, S., and
Josenhans, C. (2004) Mol. Microbiol., 52, 947-961.
26.Contreras, M., Thiberge, J. M.,
Mandrand-Berthelot, M. A., and Labigne, A. (2003) Mol.
Microbiol., 49, 947-963.
27.Kim, N., Marcus, E. A., Wen, Y., Weeks, D. L.,
Scott, D. R., Jung, H. C., Song, I. S., and Sachs, G. (2004) Infect.
Immun., 72, 2358-2368.
28.Josenhans, C., Niehus, E., Amersbach, S.,
Horster, A., Betz, C., Drescher, B., Hughes, K. T., and Suerbaum, S.
(2002) Mol. Microbiol., 43, 307-322.
29.Thompson, L. J., Merrell, D. S., Neilan, A.,
Mitchell, H., Lee, A., and Falkow, S. (2003) Infect. Immun.,
71, 2643-2655.
30.Marais, A., Mendz, G. L., Hazell, S. L., and
Megraud, F. (1999) Microb. Mol. Biol. Rev., 63,
642-674.
31.Taylor, D. E., Eaton, M., Chang, N., and Salama,
S. M. (1992) J. Bacteriol., 174, 6800-6806.
32.Van Doorn, N. E., Namavar, F., Kusters, J. G.,
van Rees, E. P., et al. (1998) FEMS Microbiol. Lett.,
160, 145-150.
33.Marshall, D. G., Coleman, D. C., Sullivan, D. J.,
Xia, H., et al. (1996) J. Appl. Bacteriol., 81,
509-517.
34.Akopyants, N., Bukanov, N. O., Westblom, T. U.,
and Berg, D. E. (1992) Nucleic Acids Res., 20,
6221-6225.
35.Akopyants, N., Fradkov, A., Diatchenko, L., Hill,
J., et al. (1998) Proc. Natl. Acad. Sci. USA, 95,
13108-13113.
36.Marshall, D. G., Dundon, W. G., Beesley, S. M.,
and Smyth, C. J. (1998) Microbiology, 144, 2925-2939.