A Novel Approach for Fluorescent Visualization of Glycyrrhetic Acid on a Cell with a Quantum Dot
Jie Hou1,2*, Qian Shi2, Meirong Cao2, Pengwei Pan2, Guangbo Ge3*, Xuran Fan3, Gang Bai2, and Yi Xin1
1Department of Biochemistry and Molecular Biology, Dalian Medical University, Dalian 116044, China; fax: +86-411-8611-0350; E-mail: houjie@nankai.edu.cn2College of Pharmacy, Nankai University, Tianjin 300071, China; fax: +86-2223-508-371; E-mail: houjie@nankai.edu.cn
3Laboratory of Pharmaceutical Resource Discovery, Dalian Institute of Chemical Physics, Chinese Academy of Sciences, Dalian 116023, China; fax: +86-411-8467-6961; E-mail: geguangbo@dicp.ac.cn
* To whom correspondence should be addressed.
Received January 29, 2013; Revision received October 22, 2013
Glycyrrhetic acid (GA), a pentacyclic triterpenoid derivative obtained from hydrolysis of glycyrrhizic acid, was found to have synergistic anti-asthmatic effects with the β2-adrenergic receptor (β2AR) agonist via the β2AR-mediated pathway. This study visualized the location of GA on a human cell expressing β2AR via chemical biological approaches. A CdTe/ZnS quantum dot modified with an alkynyl group (QD-AL) was first synthesized, and an azide-terminal GA (ATGA) was also prepared. The QD-AL was used for fluorescence visualization of the distribution of GA on human embryonic kidney 293 cells expressing fusion β2AR (HEK293-β2AR) through the “click reaction” between QD-AL and ATGA. The average size of the QD-AL nanoparticle was about 10 nm, and its fluorescent emission wavelength was 620 nm. The location of GA on the HEK293-β2AR cell membrane can be visualized by the click reaction (between QD-AL and ATGA). The ability of QD-AL targeting to ATGA on the cell membrane of a HEK293-β2AR cell was further investigated using both confocal laser-scanning microscopy and a cellular uptake-inhibition assay. The results reveal that QD-AL can recognize ATGA on the cell membrane through the click reaction, which provides a new approach for visualizing the location of GA on the cell in an indirect way, and it can be applied to explore the synergistic anti-asthmatic mechanism of GA with β2AR agonist through the β2AR mediated pathway.
KEY WORDS: fluorescent visualization, glycyrrhetic acid, quantum dot, click reactionDOI: 10.1134/S0006297914010040
Glycyrrhizin, a natural triterpene saponin and the major pharmacologically active compound in the Chinese traditional herbal Gan Cao (radix glycyrrhizae), has various pharmacological effects such as anti-inflammatory [1], anti-viral [2, 3], and anti-carcinogenic activities [4]. It has been reported that glycyrrhizin can be hydrolyzed to glycyrrhetic acid (GA) by intestinal bacteria in humans prior to absorption through a specialized β-glucuronidase [5]. It has been reported that GA has higher bioavailability than glycyrrhizin [6]. Recent studies have shown that GA exerts synergistic anti-asthmatic effects via a β2-adrenergic receptor (β2AR)-mediated pathway in which GA can enhance β2AR signaling by increasing β2AR agonist-stimulated cAMP accumulation, decrease the phosphorylation of β2AR, inhibit the internalization of β2AR, and stabilize the number of β2AR on the cell membrane, and then protects the β2AR [7, 8]. However, the mechanism of action of GA has not been elucidated clearly, especially the interactions between GA and its potential targets on human cells. Fluorescence technology has always been recognized as an effective method for exploring the relationship between a tested compound and human cells. In our previous study, we found that azide-terminal GA (ATGA) can mimic the location of GA on HEK293-β2AR cells, and further visualize GA location by fluorescence labeling through a click reaction between ATGA and the fluorescent alkynyl compound 4-ethynyl-N-ethyl-1,8-naphthalimide (NA). The chemical biology-based approach can be applied to study the mechanism of synergistic anti-asthmatic effect of GA with β2AR agonist [9]. Although the method can fluorescently image GA clearly, organic fluorescent reagents had several disadvantages in stability, photobleaching, quenching, and short excitation wavelength, which increases the background noise, as well as requiring troublesome synthesis. Thus, to improve the effectiveness of fluorescence labeling, more stable and practical techniques for fluorescence labeling of GA are highly desirable.
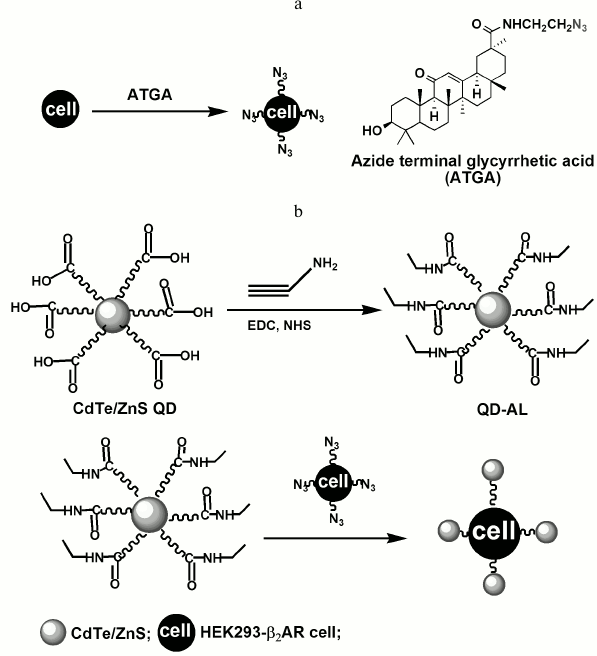
Recently, quantum dot (QD)-based probes have provided encouraging developments in cellular and in vivo molecular imaging [10-13]. QDs are colloidal probes consisting of core/shell semiconductor nanocrystals. QDs have several distinctive advantages compared to conventional organic labels, such as high luminance, resistance to photobleaching, a range of excitation wavelengths, and narrow emission bandwidths [14-20]. In this study, a new approach for visualization of GA on human cells is proposed using a quantum dot modified with an alkynyl group (Fig. 1). The CdTe/ZnS QD with carboxyl groups was first prepared using an aqueous synthetic method stabilized with 3-mercaptopropionic acid, and the propargylamine was then linked to the QDs in the presence of 1-ethyl-3-(3-dimethylaminopropyl)carbodiimide (EDC) and N-hydroxysuccinimide (NHS) to obtain the alkynyl QDs (QD-AL). Cells of the human embryonic kidney 293 (HEK293) cell line expressing exogenous β2ARs (HEK293-β2AR) were pretreated with ATGA and visualized by QD-AL through the click reaction with fluorescence. The location of fluorescence on the HEK293-β2AR cells showed that the QD-AL could efficiently recognize ATGA by the click reaction on the cell membrane, and thus demonstrate the distribution of GA on the cell membrane.
Fig. 1. Schematic representation of the preparation of the QD-AL and its application in fluorescence visualization of glycyrrhetic acid.
MATERIALS AND METHODS
Reagents. Cd(ClO4)2·6H2O, 3-mercaptopropionic acid, 2-propynylamine (propargylamine), N-hydroxysuccinimide (NHS), and 1-ethyl-3-(3-dimethylaminopropyl)carbodiimide (EDC) were purchased from Alfa Aesar Inc. (USA). Al2Te3 was purchased from CERAC Inc. (USA). Millipore water (Millipore, USA) was used throughout. Azide-terminal GA (ATGA) was synthesized by the author J. Hou and was well characterized as described previously [9]. The HEK293-β2AR cell line was also constructed by the authors as reported previously [8]. The cell culture medium and fetal calf serum were obtained from Gibco (Scotland). Other reagents, fine chemicals, and solvents with the highest grade commercially available were obtained from Sigma-Aldrich (USA).
Preparation of CdTe precursor. The CdTe precursor was prepared following the literature [21]. In brief, 838 mg (2 mmol) of Cd(ClO4)2·6H2O was dissolved in 100 ml of water, and 336 µl of 3-mercaptopropionic acid was added under stirring, followed by adjusting the pH to 11.2-11.8 by dropwise addition of 1 M solution of NaOH. The solution was de-aerated by N2 bubbling for ~30 min. The H2Te gas (generated by the reaction of Al2Te3 with 0.5 M H2SO4 under N2 atmosphere) was passed through the solution together with a slow nitrogen flow for 20 min. Finally, the solution turned yellow and the CdTe precursor was obtained.
Preparation of CdTe/ZnS QDs. The CdTe precursor solution was added dropwise into the mixture solution, which consisted of 3 ml Na2S (2.4 mM) and 3 ml ZnCl2 (3.0 mM), with stirring for 1 h at 40°C. Acetone was added into the reaction mixture to stop the reaction. After vigorous shaking, the resulting mixture was centrifuged at 19,580g for 15 min. The precipitation was collected, followed by re-dissolution with ultrapure water to obtain the CdTe/ZnS quantum dot solution.
Alkynylation of CdTe/ZnS QDs. NHS solution (0.05 mM, 0.5 ml) and EDC solution (0.05 mM, 0.5 ml) were added into 5 ml of CdTe/ZnS QD solution, and then the mixture was stirred for 2 h; this was followed by addition of 250 µl 2-propynylamine and overnight stirring. The mixture was dialyzed against ultrapure water for 12 h to remove unreacted substances and to obtain the alkynyl QDs (QD-AL).
Characterization of QD-AL. Transmission electron microscopy (TEM) image and FT-IR analysis. A drop of alkynyl QD nanoparticle solution placed onto a TEM copper grid covered with a carbon film and dried under vacuum for 2 h. TEM images were acquired using a CM 12 transmission electron microscope (Philips, The Netherlands) operating at 100 kV. The FT-IR spectra were obtained using a Varian 3100 FT-IR spectrometer (Perkin Elmer, USA) at sample concentration of 40 µM in water after subtracting the background water IR from the sample IR with 120 scans and resolution of 1 cm–1.
Dynamic light scattering measurement. The hydrodynamic diameter of the nanoparticles in solution was determined by dynamic light scattering using a Zetasizer 3000 HS (Malvern Instruments Ltd., UK) at 20°C. The QD-AL sample solution was diluted with PBS (pH 7.4) to 4 µM and filtered prior to analysis (syringe filter, 0.22 µm pore size, PVDF filter membrane; Whatman, USA).
Optical properties of QD-AL. The fluorescence properties were recorded using an RF 5301 spectrofluorimeter (Shimadzu, Japan), and absorption spectra were collected using a Lambda 20 UV-visible spectrophotometer (Perkin-Elmer, USA). In these experiments, a 1-cm quartz cuvette was used to measure the absorption or fluorescence spectra. Both the CdTe/ZnS QDs and QD-AL sample solution were diluted in PBS (pH 7.4) to final concentration of 4·10–2 µM. All optical measurements were carried out at room temperature.
Cell culture and fluorescence imaging. HEK293-β2AR cells were maintained in Dulbecco’s modified Eagle’s medium (DMEM) containing 10% fetal bovine serum (FBS), 100 U/ml of penicillin, and 0.1 mg/ml of streptomycin, and they were maintained at 37°C in 5% CO2. The cells were incubated with ATGA or GA (control) at different concentrations and cultured in a well-humidified incubator with 5% CO2 and 95% air at 37°C. After 1 h incubation, the HEK293-β2AR cells were subjected to the fluorescence labeling reaction (2 µl QD-AL solution, 0.1 mM Tris-triazole amine, 0.1 mM CuSO4, and 1 mM sodium ascorbate in PBS) at room temperature for 30 min. Then the cells were fixed with 4% paraformaldehyde, washed carefully with PBS, and visualized using a LEICA TCS SP5 laser-scanning confocal microscopy system (Leica Micorosystems, Germany). The fluorescence intensity of the images was quantified using Image Pro-Plus software.
RESULTS AND DISCUSSION
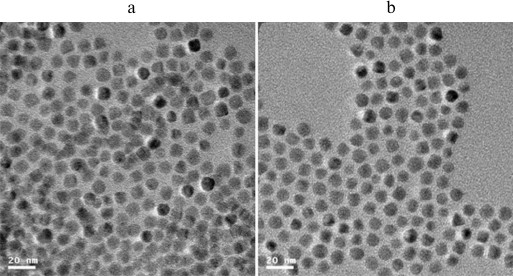
Transmission electron microscopy (TEM) image and FT-IR analysis. The QD-ALs were first synthesized according to the scheme depicted in Fig. 1. The QD-ALs were characterized by TEM to investigate the surface properties of the nanoparticles. TEM images showed that both the QD and QD-AL nanoparticles were spherical, well-separated, and had mean particle size of 10 nm (Fig. 2). These results indicate that the alkynylation of the CdTe/ZnS QDs did not change the surface properties of the CdTe/ZnS. One possible reason could be that the modified molecular 2-propynylamine with short carbon chain could not change to size of the QD.
Fig. 2. TEM image of CdTe QDs (a) and QD-AL (b).
FT-IR analysis was performed to further confirm the presence of alkynyl groups on the surface of the QDs. FT-IR spectra of QDs, propargylamine, and QD-ALs are shown in Fig. S1 (see Supplement to this paper at the site of the journal http://protein.bio.msu.ru/biokhimiya). In the FT-IR spectrum of the QDs (Fig. S1a), a broad and intense absorbance at 3400 cm–1 represents the –O–H stretching in carboxyl groups on the surface of the QDs. After treatment with propargylamine (Fig. S1b), a peak at 2175 cm–1 appeared in the QD-ALs, which represents –C≡C stretching, and significant absorbance at 1726 and 1493 cm–1 verified the amide formation between propargylamine and the QDs.
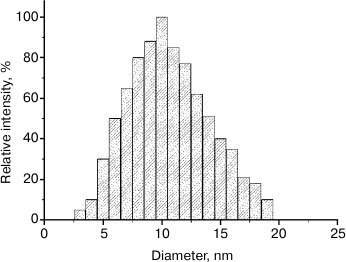
Dynamic light scattering measurement. The average volume size range of the QD-AL nanoparticles was about 10 nm (Fig. 3), which is in good agreement with the TEM results. These results revealed that the size of the QD-AL retained an even distribution, and there was no obvious aggregation caused by the alkynylation modification.
Fig. 3. Dynamic light scattering measurements of the QD-AL nanoparticles.
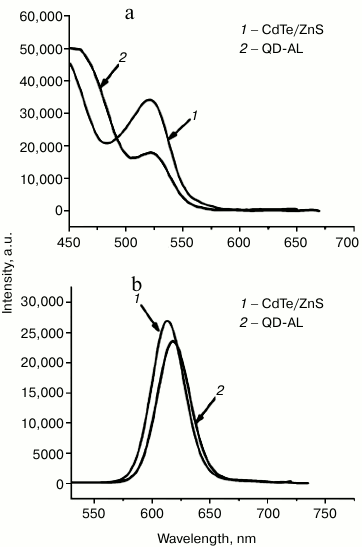
Optical properties of the QD-ALs. The optical properties including UV-visible absorption and fluorescent emission spectra were recorded using a Lambda 20 UV-visible spectrophotometer and a Shimadzu RF-500 spectrofluorimeter, respectively. The absorption λmax of the CdTe/ZnS and QD-ALs were both at 523 nm (Fig. 4a), while the emission λmax of CdTe/ZnS and QD-ALs were at 610 and 617 nm (Fig. 4b), respectively. The intensities of the QD-ALs in absorption and emission were lower than those the CdTe/ZnS, probably due to the alkynylation modification on the surface of the CdTe/ZnS. Although the exact reason for the red shift of emission and the lower intensity should be studied in depth, the QD-ALs retained a well-defined symmetrical luminescent band, indicating that the QD-AL conjugate retained the photoluminescence function of the QDs [22-24].
Fig. 4. Absorption (a) and emission (b) spectra of CdTe/ZnS and QD-ALs at λex = 480 nm.
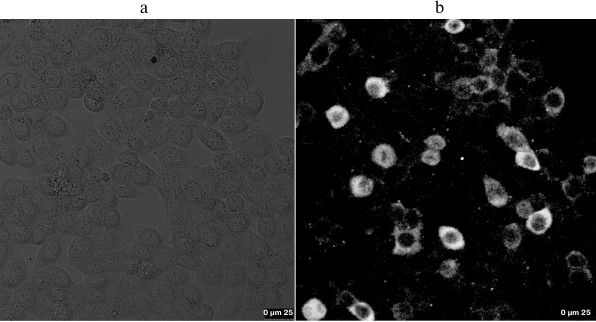
Cellular fluorescence imaging with QD-ALs. The cellular targets of ATGA with QD-ALs were investigated using HEK293-β2AR cells. The cells were pre-treated with ATGA because ATGA can mimic GA with similar distribution behavior on the cell membrane [9]. Under catalysis with Cu(I), ATGA could undergo a Cu(I)-catalyzed [3 + 2] cycloaddition reaction with an alkyne group efficiently. Little fluorescence was observed in the GA-treated control group (Fig. 5a); in contrast, Fig. 5b showed significant fluorescence expressed on the cell membrane after the addition of QD-AL, implying that ATGA reacted with QD-AL and is only distributed on the cell membrane but not in the cytoplasm of the cell, as well as supporting the specificity of the click-chemistry reactions between the azide (ATGA) and alkyne groups (QD-AL).
Fig. 5. Fluorescence images of ATGA with QD-AL through the click reaction on cell membrane of HEK293-β2AR cells. a, b) Cells were incubated with GA (control) (a) or ATGA (b) and then treated with QD-AL (2 µl QD-AL solution, 0.1 mM Tris-triazole amine, 0.1 mM CuSO4, and 1 mM sodium ascorbate in PBS).
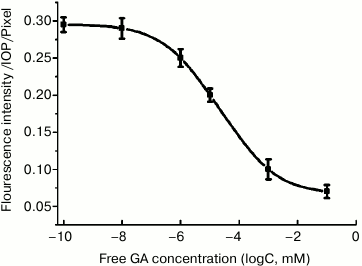
To further identify the targeting specify of the ATGA by QD-AL, a cellular competition assay was carried out in which HEK293-β2AR cells were pretreated with GA at six different concentrations. As shown in Fig. 6, the pretreatment of the cells with GA inhibited the uptake of ATGA significantly, indicating that ATGA and GA compete for the same cellular targets, and the fluorescence intensity decreased with increasing GA concentration. These results indicate that QD-AL can recognize ATGA through the click reaction, and can be applied in study of the interactions between GA and its potential targets, as well as the mechanism of action of GA.
Fig. 6. Fluorescence intensity of cellular membrane treated with free GA as a competitive inhibitor of ATGA.
In conclusion, alkynyl CdTe/ZnS QDs (QD-ALs) were prepared by an aqueous synthetic method followed by modification with alkyne groups, and the QD-ALs was used as a fluorescent labeling reagent for glycyrrhetic acid (GA). TEM, FTIR, and fluorescent spectra were used to characterize the surface properties and fluorescence properties of the nanoparticles. The results revealed that GA is capable of specifically locating on the membrane of HEK293-β2AR cells, which can be visualized after the click reaction between QD-AL and ATGA. The specificity of cellular targeting of QD-AL to ATGA was confirmed by confocal laser-scanning microscopy and further verified by the competitive inhibition of QD-AL with free GA. By combining the convenience of the synthetic route and the high specificity of the targeting ability, this alkynyl fluorescent nanoparticle system can be further explored as a useful tool for investigating the mechanism of action of GA with subunits of G-protein-coupled receptor (GPCR).
This work was supported in part by the National Natural Science Foundation of China (81302793, 81001473, 81273590), the 973 program (2013CB531800), the Natural Science Foundation of Liaoning Province (2013023049), and the General Project of the Liaoning Province Department of Education Science Research (L2013345).
REFERENCES
1.Akamatsu, H., Komura, J., Asada, Y., and Niwa, Y.
(1991) Planta Med., 57, 119-121.
2.Pompei, R., Flore, O., Marccialis, M. A., Pani, A.,
and Loddo, B. (1979) Nature, 281, 689-690.
3.Van Rossum, T. G., Vulto, A. G., Hop, W. C.,
Brouwer, J. T., Niesters, H. G., and Schalm, S. W. (1999) J.
Gastroenterol. Hepatol., 14, 1093-1099.
4.Tamir, S., Eizenberg, M., Somjen, D., Stern, N.,
Shelach, R., Kaye, A., and Vaya, J. (2000) Cancer Res.,
60, 5704-5709.
5.Akao, T., Hattori, M., Kanaoka, M., Yamamoto, K.,
Namba, T., and Kobashi, K. (1991) Biochem. Pharmacol.,
41, 1025-1029.
6.Yamamura, Y., Santa, T., Kotaki, H., Uchino, K.,
Sawada, Y., and Iga, T. (1995) Biol. Pharm. Bull., 18,
337-341.
7.Bai, G., Yang, Y., Shi, Q., Liu, Z., Zhang, Q., and
Zhu, Y. Y. (2008) Acta Pharmacol. Sin., 29,
1187-1194.
8.Qian Shi, Yuanyuan Hou, Yang Yang, and Gang Bai
(2011) Biol. Pharm. Bull., 34, 609-617.
9.Qian Shi, Yuanyuan Hou, Jie Hou, Penwei Pan, Ze
Liu, Min Jiang, Jie Gao, and Gang Bai (2012) Plos One, 7,
e44921.
10.Sibirtsev, V. S. (2007) Biochemistry
(Moscow), 72, 887-900.
11.Chan, W. C. W., and Nie, S. (1998)
Science, 281, 2016-2018.
12.Gao, X., Yang, L., Petros, J. A., Marshall, F.
F., Simons, J. W., and Nie, S. (2005) Curr. Opin. Biotechnol.,
16, 63-72.
13.Michalet, X., Pinaud, F. F., Bentolila, L. A.,
Tsay, J. M., Doose, S., Li, J. J., Sundaresan, G., Wu, A. M., Gambhir,
S. S., and Weiss, S. (2005) Science, 307, 538-544.
14.Resch-Genger, U., Grabolle, M.,
Cavaliere-Jaricot, S., Nitschke, R., and Nann, T. (2011) Nature
Methods, 5, 765-775.
15.Riegler, J., Nick, P., Kielmann, U., and Nann, T.
(2003) J. Nanosci. Nanotechnol., 3, 380-385.
16.Medintz, I. L., Uyeda, H. T., Goldman, E. R., and
Mattoussi, H. (2005) Nat. Mater., 4, 435-446.
17.Burns, A., Ow, H., and Wiesner, U. (2005)
Chem. Soc. Rev., 35, 1028-1042.
18.Alivisatos, A. P. (1996) Science,
271, 933-937.
19.Kucur, E., Boldt, F. M., Cavaliere-Jaricot, S.,
Ziegler, J., and Nann, T. (2007) Anal. Chem., 79,
8987-8993.
20.Maksimov, E. G., Kurashov, V. N., Mamedov, M. D.,
and Paschenko, V. Z. (2012) Biochemistry (Moscow), 77,
624-630.
21.Gaponik, N., Talapin, D. V., Rogach, A. L.,
Hoppe, K., Shevchenko, E. V., Kornowski, A., Eychmuller, A., and
Weller, H. (2002) J. Phys. Chem. B, 106, 7177-7185.
22.Jifang Weng, Xingtao Song, Liang Li, Huifeng
Qian, Keying Chen, Xuemin Xu, Chengxi Cao, and Jicun Ren (2006)
Talanta, 70, 397-402.
23.Clarke, S. J., Hollmann, C. A., Aldaye, F. A.,
and Nadeau, J. L. (2008) Bioconj. Chem., 19, 562-568.
24.Youngseon Choi, Minjung Kim, Yoojin Cho, Eunsuk
Yun, and Rita Song (2013) Nanotechnology, 24, 075101.
Supplementary FIGURE (PDF)