REVIEW: Complex Analysis of Single-Cell RNA Sequencing Data
Anna A. Khozyainova1,a*, Anna A. Valyaeva2,3, Mikhail S. Arbatsky4,5,6, Sergey V. Isaev7, Pavel S. Iamshchikov1,8, Egor V. Volchkov9, Marat S. Sabirov10, Viktoria R. Zainullina1, Vadim I. Chechekhin6, Rostislav S. Vorobev1, Maxim E. Menyailo1, Pyotr A. Tyurin-Kuzmin6, and Evgeny V. Denisov1
1Laboratory of Cancer Progression Biology, Cancer Research Institute, Tomsk National Research Medical Center, Russian Academy of Sciences, 634050 Tomsk, Russia2Faculty of Bioengineering and Bioinformatics, Lomonosov Moscow State University, 119991 Moscow, Russia
3Belozersky Institute of Physico-Chemical Biology, Lomonosov Moscow State University, 119991 Moscow, Russia
4Laboratory of Artificial Intelligence and Bioinformatics, The Russian Clinical Research Center for Gerontology, Pirogov Russian National Medical University, 129226 Moscow, Russia
5School of Public Administration, Lomonosov Moscow State University, 119991 Moscow, Russia
6Faculty of Fundamental Medicine, Lomonosov Moscow State University, 119991 Moscow, Russia
7Research Institute of Personalized Medicine, National Center for Personalized Medicine of Endocrine Diseases, National Medical Research Center for Endocrinology, 117036 Moscow, Russia
8Laboratory of Complex Analysis of Big Bioimage Data, National Research Tomsk State University, 634050 Tomsk, Russia
9Department of Oncohematology, Dmitry Rogachev National Research Center of Pediatric Hematology, Oncology and Immunology, 117198 Moscow, Russia
10Laboratory of Bioinformatics and Molecular Genetics, Koltzov Institute of Developmental Biology of the Russian Academy of Sciences, 119334 Moscow, Russia
* To whom correspondence should be addressed.
Received September 23, 2022; Revised December 13, 2022; Accepted December 13, 2022
Single-cell RNA sequencing (scRNA-seq) is a revolutionary tool for studying the physiology of normal and pathologically altered tissues. This approach provides information about molecular features (gene expression, mutations, chromatin accessibility, etc.) of cells, opens up the possibility to analyze the trajectories/phylogeny of cell differentiation and cell–cell interactions, and helps in discovery of new cell types and previously unexplored processes. From a clinical point of view, scRNA-seq facilitates deeper and more detailed analysis of molecular mechanisms of diseases and serves as a basis for the development of new preventive, diagnostic, and therapeutic strategies. The review describes different approaches to the analysis of scRNA-seq data, discusses the advantages and disadvantages of bioinformatics tools, provides recommendations and examples of their successful use, and suggests potential directions for improvement. We also emphasize the need for creating new protocols, including multiomics ones, for the preparation of DNA/RNA libraries of single cells with the purpose of more complete understanding of individual cells.
KEY WORDS: single-cell RNA sequencing, cell cycle, clustering, differential expression, cell type, trajectory inference, cell–cell interaction, gene regulatory network, copy number variation, single nucleotide variant, phylogenetics, epigenomics, spatial transcriptomicsDOI: 10.1134/S0006297923020074
Abbreviations: bulk RNA-seq, bulk RNA sequencing; CNV, copy number variation; DEG, differentially expressed gene; scRNA-seq, single-cell RNA sequencing; SNV, single-nucleotide variant; WGCNA, weighted gene co-expression network analysis; aCGH, array-based comparative genomic hybridization; MLPA, multiplex ligation-dependent probe amplification; WGS, whole-genome sequencing
INTRODUCTION
Single-cell RNA sequencing (scRNA-seq) is a truly revolutionary technique that has significantly expanded our understanding of the heterogeneity and dynamics of transcriptomes in the cells from various organisms. This method was used for the first time in 2009 to investigate mouse blastomeres at the second division stage [1]. Although it was demonstrated that single-cell sequencing was superior to the microarray technology in the quantitative assessment of gene expression, the main limitation of scRNA-seq at that time was impossibility of multiplexing, as the libraries for individual cells had to be created manually in separate tubes. However, already in 2011, the first protocol for the multiplex scRNA-seq was developed [2], and in 2014, the first commercial platform for automated preparation of single-cell libraries, Fluidigm C1, was introduced to the market [2]. At present, there are several platforms available for scRNA-seq, including Fluidigm C1/Smart-seq, BD Rhapsody (BD Biosciences, USA), Chromium (10x Genomics, USA), etc., that provide the possibility of high-throughput analysis [3, 4].
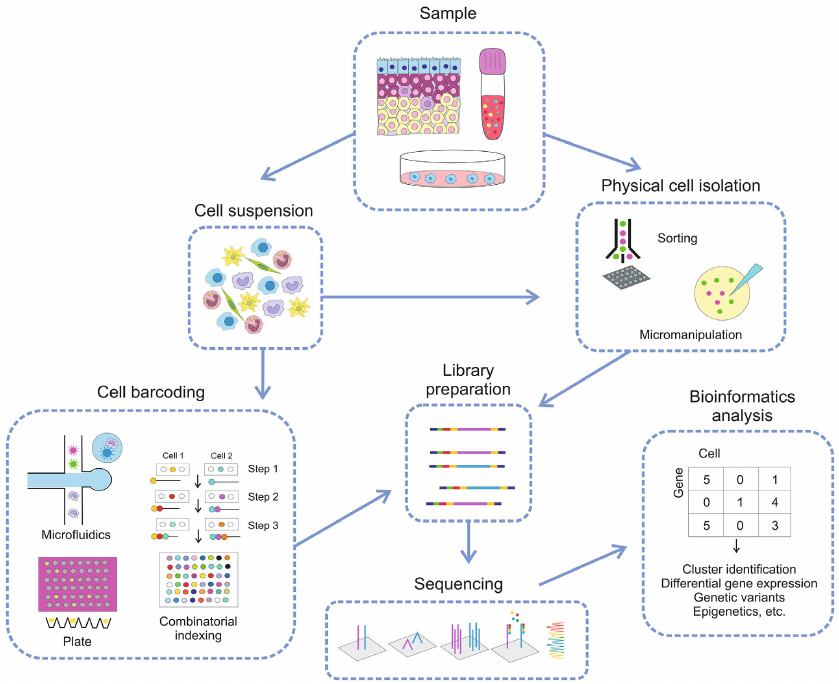
The workflow for scRNA-seq is presented in Fig. 1. The cell suspension is prepared by sample homogenization, and the cells are separated either by physical methods, such as cell sorting or micromanipulation, or via barcoding using plates with oligonucleotides or microfluidics and combinatorics [5, 6]. Blood samples and cell cultures can be subjected to sorting or micromanipulation without preliminary suspension preparation. The obtained cells are used for the preparation of libraries and following sequencing, and the data are processed using bioinformatics techniques.
Fig. 1. Typical workflow for scRNA-seq.
Advances in scRNA-seq technologies have allowed to characterize main cellular and molecular mechanisms involved in the development of cardiovascular [7], neurodegenerative [8, 9], oncological [10], and other diseases, to determine cellular taxonomy of widely used model organisms such as the thale cress (Arabidopsis thaliana) [11], fruit fly (Drosophila) [12], and zebrafish (Danio rerio) [13], and to decipher the heterogeneity of immune system cells in normal and pathological states, in particular, oncological diseases [14, 15].
The studies conducted at the beginning of the single-cell sequencing development had been mainly focused on investigating the cell populations of tested samples, analysis of differential gene expression, cell cycle examination, and identification of cell types [1, 16]. However, it was obvious even at that time that the possibilities of scRNA-seq are much broader, and development of bioinformatics approaches for integrating and transforming nucleotide reads into multimodal information describing different cell states was only a matter of time.
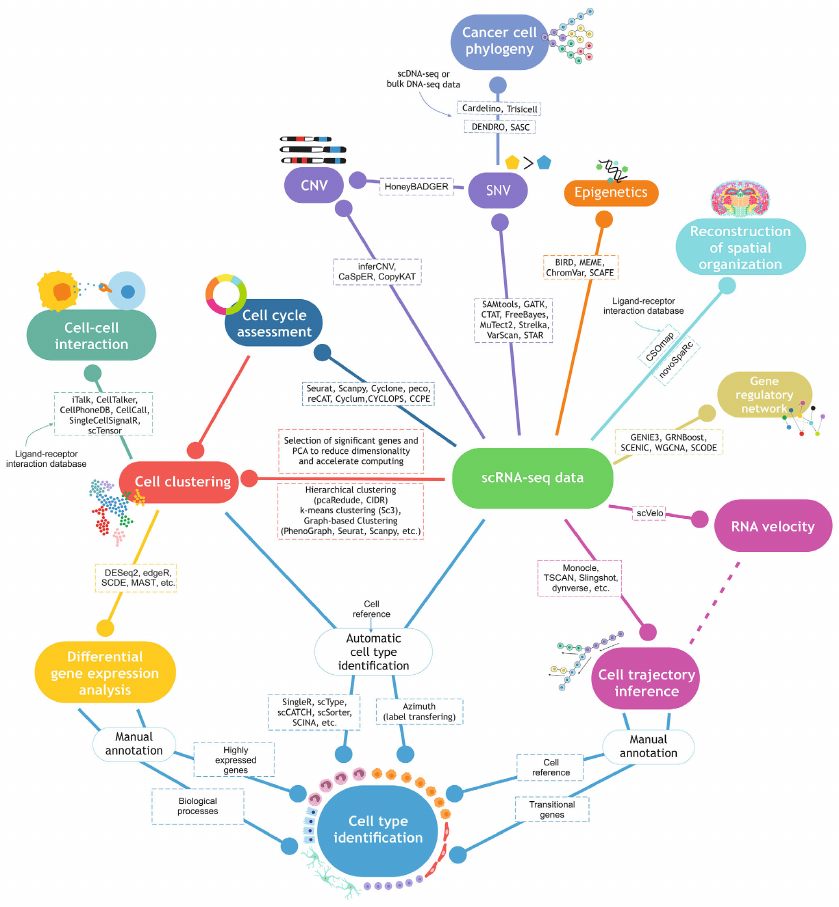
In this article, we reviewed the progress made in the scRNA-seq data processing and analysis used to obtain information on the cell cycle, cell clusters and types, differentially expressed genes (DEGs), cell trajectory inference and RNA velocity, cell–cell interactions, gene variants, including copy number variations (CNVs) and single-nucleotide variants (SNVs), cell phylogeny, chromatin accessibility, and spatial transcriptomics (Fig. 2). The advantages and disadvantages and possible approaches to overcome the limitations of each method, as well as the example of their successful use in the analysis of biological systems are presented.
Fig. 2. Approaches in bioinformatics analysis of scRNA-seq data.
CELL CYCLE EVALUATION
Unlike bulk RNA sequencing (bulk RNA-seq), scRNA-seq provides information on the transcriptional profile of each individual cell in the examined sample. scRNA-seq has made it possible to investigate the cellular diversity of tissues, to discover previously unknown cell populations, and to study biological processes at a single-cell level. However, the increase in the method resolution was accompanied by the increase in the technical and biological noise in the obtained data. The main source of biological noise in scRNA-seq data is cell cycle [17]. Analysis of scRNA-seq data often considers the cell cycle phases as confounders, i.e., variables that can distort the investigated biological effect, for example, the differences between the cell types or changes in the transcriptional programs during disease or therapy. Cells in the investigated samples can be at different phases of cell cycle and, therefore, have different expression profiles even if they belong to the same cell type. A possible solution for this problem is removal of dispersed cell cycle-associated data during preparation of the gene expression template before the analysis. This procedure is especially advisable when no actively proliferating cells are expected in the analyzed samples, as in the studies of apoptosis. Exclusion of cell cycle genes or proliferating cells is also rational when the majority of the most variable genes are represented by the cell cycle genes, which can interfere with the identification of differentially expressed genes. However, in some cases, e.g., upon comparison of subpopulations of dividing and non-dividing cells, the information on the cell cycle stage could be important, and this confounder should not be eliminated.
Popular packages for the analysis of scRNA-seq data, such as Seurat [18] and Scanpy [19], take into consideration two parameters [20] that are based on the averaged expression of the known marker genes of the cell cycle phases S and G2/M [21]. Depending on the calculated parameter value, the cells could be annotated as being in the phase G2/M, G1, or S. The effects associated with cell cycle can be excluded using linear regression with consideration of the calculated parameters. If the following analysis requires to preserve the distinction between the populations of dividing and resting cells and, at the same time, to eliminate the differences associated with the cell cycle phases, it is recommended to use the difference between the G2/M and S parameters instead of the parameters themselves in the linear regression.
The Cyclone method [20] also uses known cell cycle marker genes for evaluation and removal of effects associated with cell division. This algorithm is based on the comparison of expression of pairs of marker genes, because the ratio between their expression can be used for determining the cell cycle phase.
Other methods allow more detailed analysis of cell cycle and reconstruction of the progression of an individual cell through the cell cycle based on scRNA-seq data. Similar to the above-mentioned techniques, some of these methods, such as peco [22] and reCAT [23], use the sets of known genes associated with the cell cycle. Other algorithms (Cyclum [24], CYCLOPS [25], and CCPE [26]) are based on unsupervised learning and use the cyclicity of gene expression for estimating the cell cycle pseudotime. These algorithms can be applied to extract the information on the genes associated with each phase of the cell cycle.
CELL CLUSTERING
Typical analysis of scRNA-seq data starts with determining the cell composition of the tested sample. At this stage, individual cells are combined into transcriptional clusters based on the similarities of their expression profiles, followed by identification of the cell type of each cluster based on the expression levels of specific and differentially expressed marker genes. This task requires the use of data clustering algorithms, as well as the methods of analysis of DEGs. These algorithms and methods are not only applicable for the initial analysis of scRNA-seq data; they can be used as individual tools for solving particular biological problems.
Analysis of DEGs is used for investigating the effects of various pathological or experimental conditions on the transcriptional profiles of studied cell populations. This method can be applied to identify the genes and associated cellular processes that are activated or suppressed in different cell types during development of COVID-19 [27, 28], Alzheimer’s disease [29], autism [30], and many other diseases. Moreover, differential expression analysis is used for identification of genes, whose expression changes during cell differentiation or in other dynamic processes affecting the phenotype of cell populations. This approach can also be also used for selecting the genes, whose expression profiles are required for constructing the cell trajectories.
Application of clustering algorithms is not limited to the initial stages of scRNA-seq data analysis. Clustering of cells as elements of a dataset could be performed several times in bioinformatics analysis, e.g., with the purpose of discovery of rare cell populations [31]. Instead of using an entire initial set of expression profiles, repeated cell clustering in this case could be conducted based on, for example, gene signature (a group of genes with unique expression pattern that can be used for the identification of cells of interest) or any other set of features associated with a particular cell type.
Cell annotation can be carried not only to determine the cell type, but for other purposes as well. For example, cell clusters could be annotated based on the viral load or their features [32].
In this and the two next sections of the review, we discussed various tasks of the bioinformatics analysis, namely, cell clustering, search for DEGs, and identification of cell types.
Identification of cellular or transcriptional clusters in scRNA-seq data using clustering algorithms is one of the popular unsupervised learning tasks. The aim of clustering is to combine cells into groups based on the similarity of their transcriptional profiles. The groups could be characterized further as cluster of cells of the same type, at the same stage of differentiation, or at the same cell cycle phase. It should be mentioned that clusters are mathematically defined groups of cells that indeed could contain cells of same type. However, in actual practice, biology has very little to do with clustering algorithms.
At present, there are numerous methods available for scRNA-seq data clustering, each of them with its own advantages and drawbacks. So far, there is no consensus on which of the methods is most efficient [33]. The methods for scRNA-seq data clustering are based on the commonly used algorithms, such as hierarchical clustering, k-means clustering (SC3), and graph clustering. Cell clustering can be affected not only by the used clustering method and its parameters, but also by the volume of data. An exponential increase in the amount of data leads to the increase in the data dimensionality, causing the so-called ‘curse of dimensionality’. The multidimensional character of data leads to the convergence of individual cells, which creates problems in determining the distance between them. In the multidimensional data, the most distant cells (differing in the expression of multiple genes) are at the same distance as the closest ones (with similar RNA profiles). Due to this problem, standard clustering techniques cannot provide separation of cells differing in the RNA profiles. In order to decrease the dimensionality and accelerate computing, the most significant genes (traits) are selected from the multidimensional scRNA-seq data and used in principal component analysis (PCA). These significant genes are usually highly variable genes (HVGs), the changes in expression of which are associated predominantly with the biological differences in the analyzed cells rather than with the technical noise [34]. There are also other methods for modeling the technical noise and selection of significant genes based, for example, on the constructed M3Drop model [35]. In this case, clustering uses the distance between the cells in the space with a reduced dimensionality.
The hierarchical clustering algorithm combines the cells into growing clusters (bottom-up, or agglomerative approach) or divides clusters into subgroups (top-down, or divisive approach) based on the array of distances between the cells. The programs using this algorithm for the identification of cell subpopulations, such as pcaReduce [36] or CIDR [37], determine the relationships between the clusters using a dendrogram. However, in comparison with other clustering methods, these approaches are slower, which could be critical for processing of high-volume scRNA-seq data.
The SC3 method for the clustering of scRNA-seq data [38] is based on the k-means clustering algorithm, which involves iterative determination of the mass centers (centroids) of a specified number of clusters and clarification of cluster boundaries. A distinctive feature of the methods based on the k-means clustering algorithm is that the obtained clusters are approximately the same size. In this case, large subpopulations of cells are divided into several clusters, while rare cells are combined with other clusters. Moreover, the result of clustering with the k-means clustering algorithm to a large extent depends on the random initiation of centroids and does not necessary represent the global minimum.
In the case of big scRNA-seq data, the more suitable methods for cell clustering are graph-based approaches, such as Louvain and Leiden methods. In these methods, a k nearest neighbor graph (kNN graph) is first constructed by projecting the data to the reduced dimensionality space, followed by the definition of cell clusters as groups of most connected with each other vertices of the graph. The number of identified clusters is not specified directly, but is affected by the resolution and by the specified number of k nearest neighbors used for the graph construction. The graph-based identification of cell subpopulations is realized in the PhenoGraph program [39] and Seurat [18] and Scanpy [19] packages. The advantages and drawbacks of each group of methods have been described in detail in the review by Kiselev et al. [33].
scRNA-seq data clustering allows detection of already known types or states of cells with characteristic high expression of marker genes or identification of previously undescribed cell populations, whose existence can be later validated experimentally, e.g., by immunostaining [40, 41]. Rare or small cell subpopulations can be searched for using more complex approaches for data normalization [41] and reclustering of selected individual or several most interesting clusters [31]. The biological noise in scRNA-seq data caused by contamination of the investigated tissues can be eliminated by removing the cluster of non-target cells followed by data reclustering [40].
ANALYSIS OF DIFFERENTIAL GENE EXPRESSION
Analysis of differential gene expression allows to establish the differences between the clusters, to identify cell types and their markers, and to investigate transcriptional dynamics in the processes of cell differentiation, disease development, or upon exposure to exogenous and/or endogenous factors.
Although the tasks for DEG identification based on the data of bulk RNA-seq and scRNA-seq are formulated in a similar way, the approaches used for solving this problem are very different. The methods of bulk RNA-seq data analysis for differential gene expression, such as DESeq2 [42] and edgeR [43], address the difficulties in the evaluation of the gene expression dispersion based on a small number of replicates (biologically different samples from the same experimental group). This problem is absent in the analysis of scRNA-seq data, because each cell can be considered as a replicate. However, an increase in the number of measurements (cells) could produce false-positive results. For example, if upregulation of a gene in one of the clusters is statistically significant, but is only 1.1-fold, the statistical significance could be fully lost if the number of measurements is low. In this connection, for a gene to be identified as DEGs, its expression should change to a certain level, and the value of this threshold should be different for each particular data set. Nevertheless, the above-mentioned methods are applicable for the analysis of scRNA-seq data. In particular, analysis of scRNA-seq data for DEGs with DESeq2 and edgeR involves weighing of expression values for each cell and each gene, which allows to overcome the problem of sparsity of scRNA-seq data caused by an extremely high fraction of unexpressed genes in each cell. Previously, this problem has been solved by applying the methods specifically developed for the analysis of scRNA-seq data using zero-inflated negative binomial (ZINB) [44]. At present, the model of negative binomial, NB, without zero inflation is recommended for the use with scRNA-seq data [45]. Moreover, comparison of the methods for the DEG analysis revealed that in the case of simple experimental design (comparison of ‘control’ and ‘experimental’ data in the absence of other variables), the non-parametric Mann–Whitney test provides the best results [46].
However, the above-mentioned methods do not take into account some features of scRNA-seq data. In particular, the distribution of gene expression in single cells is characterized by bimodality. The expression values are either positive for the cells where the respective transcript has been detected, or equal to zero for the cells where no transcript expression has been found due to some biological or technical reasons. The absence of expression can be explained by its stochastic nature (biological reason) or loss of transcript at the stage of cDNA library preparation (technical reason). This feature of the single-cell transcriptomics was taken into account in the SCDE [47] and MAST [48] methods. The SCDE method uses a combination of the negative binominal distribution for the positive expression values and Poisson distribution for unexpressed genes, in which case the background signal can be present. The SCDE method can be used only for the identification of DEGs in two groups of cells (control and experiment). Other variables, such as the sample batch or time point, cannot be used in the SCDE method, which limits its application only to the experiments with a simple design. The MAST method uses the hurdle model for the description of gene expression in single cells and can be employed in more complex experimental designs, for example, those with several types of exposure.
The search for DEGs in cell subpopulations depends on the stage of clustering, which uses the same information on gene expression in individual cells. This is why analysis of differential expression after cell clustering reduces the statistical significance of differences (p-value). This problem could be resolved by using the TN (truncated normal) test, which takes into account the levels of gene expression that define the boundaries between the cell clusters [49].
The idea that each individual cell represents an independent sample is a big assumption, because all cells in a sample usually originate from the same predecessor cell or a small number of cells. Hence, comparison of cells subpopulations derived from the same organism estimates the variability of transcriptional profiles at the level of an individual organism but not at the population level. If the dataset represents a sample of cells from several donors, differential expression can be analyzed by calculating the aggregated (pseudo-bulk) expression or using generalized linear mixed model in which the donor is considered as a random factor [50]. The aggregated expression is calculated by summing or averaging gene expression in the cells from each donor, resulting in several pseudo-repeats corresponding to the independent donors. In this way, DEG analysis based on scRNA-seq data is brought down to the task that had been already successfully solved for the bulk RNA-seq data.
However, the results of DEG analysis obtained by bulk RNA-seq and scRNA-seq could differ significantly. In the case of scRNA-seq, differential gene expression is detected predominantly among the highly expressed genes with moderate differences in the expression levels (fold change) [51]. That is why identification of genes whose expression alters significantly in response to various factors is more difficult using the scRNA-seq-based approaches.
Due to properties of the scRNA-seq library preparation, which involves the use of oligo(dT) primers in the vast majority of methods, the transcripts identified in single cells are mostly polyadenylated RNAs, e.g., mRNAs and some long non-coding RNAs (lncRNA). Analysis of expression of other RNA types, in particular, microRNAs (miRNAs), at a single-cell level requires special techniques of sample pretreatment [52]. Nevertheless, the activity of microRNAs in individual cells can be estimated based on the expression levels of miRNA precursors, which could be polyadenylated and capped, and, as a result, included in the sequenced transcriptome.
Analysis of differential expression at the cell level using scRNA-seq allowed to reveal the causes of disruptions of epithelial regeneration in the lung alveoli during COVID-19 [27, 53] and to characterize the properties of cytokine storm and immune response to viral infection mediated by different types of immune cells [54]. This method facilitated identification of markers involved in the drug resistance of Ewing’s sarcoma [55] and helped to estimate the functional heterogeneity of multipotent human and mouse stromal cell based on the profiles of adenylate cyclase expression [56]. Changes in the gene expression in the process of clonal expansion and possible accompanying exhaustion of T cells during antitumor immunotherapy were also investigated at the level of single cells with the help of differential expression analysis [57]. The same methods have been used for identification of gene signatures, i.e., sets of markers that predict the cell response to immunotherapy by immune checkpoint blockade [58].
IDENTIFICATION OF CELL TYPES
Identification of cell types typically involves the use of standard histological methods, most commonly immunostaining, i.e., the binding of antibodies to specific cell markers and their subsequent visualization. An alternative approach is RNA-seq, which detects cell markers at the level of transcripts, followed by cell typing based on the bioinformatics data. However, it is well known that the presence of mRNA in the cell does not always correlate with the biosynthesis of the encoded protein due to multiple posttranscriptional and posttranslational regulatory mechanisms [59, 60]. scRNA-seq-based cell typing could be automated or manual.
Automated cell typing is performed by comparing expression profiles of the investigated cells with the expression of known genetic markers described in numerous databases containing the microarray, bulk RNA-seq, and scRNA-seq data for certain cells types. If the profiles coincide, the program automatically identifies the cell type. This principle is realized in the Single R tool [61], which includes the celldex package providing access to seven cell databases. ScType [62], scCATCH [63], scSorter [64], and SCINA [65] can also been used for automated cell typing. Automated annotators could use the results of clustering conducted prior to the analysis or recalculate the clustering results in accordance with the cell types found in the sample. It must be noted that the automated annotators recognize only a limited number of cell types due to the lack of information on the expression profiles of other numerous cell types.
Another strategy for the automated cell typing is the use of annotated samples from other research groups, a bioinformatics approach called transferring labels [66]. This procedure starts with the identification of cells, whose expression profiles coincide with the reference one. After the anchor cells (same cells in different samples) are found, the information for the reference cell type is applied to the tested sample. The Azimuth web-service operates on this principle [67]. At present, 11 reference datasets are available.
There is also an intermediate variant of automated cell typing involving the construction of a library of annotated samples for the studied cells. This approach allows to select the best open datasets and provides a clear understanding of the design of the experiment in which these samples were obtained.
Manual cell typing. The necessity for manual cell typing is due to the fact that the majority of cells in the sample are in the transient, non-differentiated form. These cells typically lack specific markers and cannot be annotated by automated typing. Moreover, the classical gene marker could be insufficient for identification of differentiated cells. In this case, the cell type could be determined manually based on either less-known genetic markers or genetic markers specified by the researcher [68]. It is our opinion that the cells can also be typed based on the involvement in different biological processes, transitional genes, or cell position with regard to the developmental trajectory.
Cell typing based on less-known markers or markers specified by a researcher is more suitable for determining the type of differentiated cells and is performed by investigating the genes in each cluster obtained by clustering. The researcher assesses the list of highly expressed genes for certain markers and if these markers are present, assign the cell to a known cell type. Another approach is assignment of identified clusters to particular cell types based on the markers specified in Seurat and Scanpy. Genetic markers could be selected based on the published data. For example, the use of the gene panel predetermined in advance allowed to identify cell types by comparative analysis of the same brain regions in higher primates [69]. This typing method was also used for identification of cell subpopulations in the follicular lymphoma during disease recurrence and progression [70].
Cell typing according to the biological processes is based on the identification of groups of genes participating in biochemical processes specific for the cells exposed to certain factors. Biological processes occurring in a given cell cluster can be recognized from DEGs. For this purpose, we recommend the user-friendly web service g:Profiler, which combines the information on DEGs in a cluster and describes all biological processes, signaling pathways, and cellular components associated with the protein products of these genes. This approach allows to determine the type of cells undergoing differentiation based on the markers associated with the changes in the cell phenotype.
Unlike the two above methods of manual cell typing, typing based on the transitional genes uses nonspliced pre-mRNAs in addition to the protein-coding transcripts. The ratio between the spliced and nonspliced forms of mRNA allows to evaluate the state of protein expression (activation or repression) at the moment of examination and to identify the genes essential for the cell development at that particular moment using the corresponding tool, e.g., scVelo [71]. The list of these genes can be manually searched for the those responsible for cell transition to its differentiated form, which gives the opportunity to predict the type of cells that will descend from the investigated group of cells.
Manual cell typing can also be performed based on the cell development trajectory. In the majority of cases, cell clusters lacking specific markers are between the clusters with clearly pronounced markers and, hence, might represent intermediate clusters containing cells in the transitional phase between the initial and final forms.
DEVELOPMENTAL TRAJECTORIES AND RNA VELOCITY
Any type of sequencing provides a snapshot of cell life and information on the modality of interest at the moment of examination. scRNA-seq libraries contain information on the transcriptional profiles of several hundreds and thousands of cells, whose heterogeneity is determined mostly by the dynamic nature of cell development. The methods for the reconstruction of cell developmental trajectory, also called pseudotime analysis, allow to arrange the cells in the investigated sample along the modeled temporal trajectory based on the similarities of their expression profiles. The result of construction of the developmental trajectory in pseudotime is a graphical representation of all cells in the sample arranged in a line, starting with the root (initial) cell and ending with the end (differentiated) cell. Elucidation of the developmental trajectory makes it possible to investigate various biological phenomena, such as differentiation, cell cycle, and immune response in a dynamic context.
The first tool developed for the construction of developmental trajectories was the Monocle R-package. Monocle first identifies DEGs to reduce the number of analyzed genes and then uses the independent component analysis to further reduce the space dimensionality. To construct the developmental trajectory, Monocle builds the minimum spanning tree followed by the search for the longest path through this tree [72]. After Monocle, more than 50 methods have been suggested, TSCAN [73] and Slingshot [74] being the most popular among them. The methods differ in multiple parameters, such as identification of root and end cells, type of graphs (direct, linear pseudotime, cyclic pseudotime, probability of end state, cluster evaluation, orthogonal projection, and cell graph), and type of trajectory (unbound and bound graphs, cyclic and acyclic graphs, and tree-like graph) [75]. So many methods have been developed, so it became necessary to create a unified platform, where the data could be analyzed with serval methods at the same time. One of such platforms is dynverse, which combines 45 methods for the developmental trajectory construction.
In order to improve the quality of constructed trajectories, some methods use supplementary information in addition or instead of the gene expression data. The most popular type of such information is RNA velocity [71]. The concept of RNA velocity was suggested when studying scRNA-seq data obtained using different platforms (Smart-seq2, STRT/C1, inDrop, and 10x Genomics Chromium). It was found that 15 to 25% reads contained nonspliced intron sequences, which could be explained by the presence of poly(A) sequences not only in the poly(A) tails, but also in internal poly(A) sequences [76]. It was suggested that both spliced and nonspliced mRNAs should be used in analysis. In this case, RNA velocity is defined as the time derivative of the gene expression stage. All processing was divided into three stages: transcription, splicing, and degradation. Gene expression is detected when transcription and splicing dominate over degradation and is suppressed, when degradation dominates over transcription and splicing. The value of RNA velocity determines the direction of the vector of each cell in the reduced-dimensionality space. This forms the vector field that indicates the direction of cell development in the sample. Since the vector field is overlaid onto previously obtained cell clusters, the direction of cell differentiation or response to the exposure to the investigated factor can be suggested.
CELL–CELL COMMUNICATIONS
Development, functioning, regeneration, and homeostasis of tissues and organs are mediated by cell–cell communication, or cell–cell signaling, a process occurring through the interaction of ligands (cytokines, chemokines, hormones, growth factors, and neurotransmitters) with cell receptors.
Cell–cell signaling is subdivided into autocrine (ligand secreted by the cell interacts with its receptors on the same cell), paracrine (ligand secreted by the cells interacts with the receptors on cells from the same tissue), and endocrine (ligand secreted by the cells interacts with the receptors in other tissues or organs). Another type is direct cell–cell interactions, i.e., physical contacts between the two cells that participate in the cell–cell communication (in the process of cell recognition) or perform the structural functions.
Studying cell-cell communications helps to elucidate the mechanisms of cell differentiation and morphogenesis, etiology of diseases [77], and properties of the immune response formation [78]. Understanding cell–cell signaling facilitates the development of novel therapeutic strategies [79] and can help in predicting the severity of various diseases [80, 81].
Investigation of cell–cell signaling starts with identification of protein–protein interactions with a help of two-hybrid systems, co-immunoprecipitation, and other techniques [82]. A large number of ligand–receptor interactions have been characterized, although only for a limited number of cell types and tissues. scRNA-seq allows to assess the expression levels of ligand-encoding genes in thousands of cells in one experiment and to investigate the cell composition of tissues, as well as to elucidate the mechanisms of endocrine and paracrine regulation at the systemic level.
The goal of the cell–cell signaling analysis based on scRNA-seq data is to understand whether a pair of cells (A and B) communicates with each other through a specific ligand–receptor (l–r) interaction. Simple methods, such as iTalk [83] and CellTalker, solve this problem using the following strategy: if a gene of the ligand l is differentially activated in type A cells, and the gene of the receptor r is differentially activated in type B cells, these cells are considered interacting. Although these methods are intuitively straightforward and their results are easy to interpret, they fail to detect communications typical for a large number of cell types in tissues.
More sophisticated techniques introduce a notion of interaction score S, which is defined as a function of the average expression of l in A (lA) and r in B (rB) of either their sum (CellPhoneDB method [84]) or their product (SingleCellSignalR [85]). To estimate the interaction score between the cells A and B, the CellCall algorithm [86] uses information on the expression of the RegB regulon (a set of target genes activated by a certain transcription factor co-expressed with this transcription factor), which is regulated by the transcription factor activated upon the r receptor interaction with the ligand. If the receptor consists of several subunits encoded by different genes, r represents either the minimal expression value for all receptor subunits (CellPhoneDB) or the geometric mean of the expression value of all subunits (CellCall).
However, not all cells expressing the ligand–receptor pairs communicate. The emergence of false-positive results can be avoided by using the permutation test (realized in CellPhoneDB). In this test, cell markers are randomly mixed multiple times, and the interaction score S is calculated each time, yielding the null distribution used for the calculation of the p-value for the initial S. The disadvantages of this approach are similar to the disadvantages of methods based on differential gene expression: communications highly represented in a dataset can be statistically insignificant. An alternative solution to this problem is realized in SingleCellSignalR. The authors of this algorithm considered all communications with the strength above a certain pre-set threshold as significant. The CellCall algorithm assumes that a communication is significant if the expected false discovery rate in the gene set enrichment analysis (FDR GSEA) of RegB is below 0.05.
We should also mention the scTensor algorithm [87]. In this algorithm, a third-order tensor is formed with the dimensions A × A × L, where A is the number of cell types, L is the number of investigated ligand–receptor pairs, and the (a, b, l) element is the strength of communication via the ligand–receptor pair (l–r) in the A and B pair of cells. Hence, the tensor consists of all commination strength values for all communications between all ligand–receptor pairs. The strength of communication in this method is calculated by a simple multiplication of lA and rB. The constructed tensor is transformed into the product of two arrays and a novel tensor via nonnegative Tucker decomposition. As a result, the information on the cell–cell signaling is described simultaneously for the entire data set, which allows to reveal more complex processes, e.g., entire communication networks. Despite its advantages, this method is not very popular mainly due to the complexity of result interpretation.
The above-described approaches to the evaluation of cell–cell signaling are fundamentally different, primarily in the hypothesis they are testing. CellTalker, iTalk, and CellPhoneDB allow to identify signalling pathways that are unique for particular cell types in the investigated dataset. SingleCellSignalR, CellCall, and scTensor allow to detect a large number of communications, including non-specific ones, but they might miss low-strength communications [88]. Moreover, all the described methods provide information on putative signaling pathways, which should be then validated experimentally. The results obtained with these tools significantly depend on the databases of ligand–receptor interactions used. The existence of communications between the cells can be confirmed more reliably with the help of the actively developing methods of spatial transcriptomics [89]. These new methods will be able to provide answers to the questions on how architecture of various tissues is formed and maintained.
GENE REGULATORY NETWORKS
Gene expression is regulated through the coupling and interaction of processes of RNA synthesis and splicing, as well as mature mRNA degradation. In general, the level of gene expression is strongly associated with the activity of mRNA transcription. In its turn, transcription is regulated by multiple signals. For example, hormones bind to their cognitive receptors and trigger signaling cascades located mainly in the cell cytoplasm. Signalling cascades activate transcriptional factors, which interact with their binding sites in the target genes. These interactions take place in the cell nucleus and have been named gene regulatory networks. Gene regulatory networks participate in the maintenance of cellular homeostasis and formation of cell heterogeneity; their disruption can result in the development of various pathological states and aggravate the course of diseases [90, 91]. Investigating gene regulatory networks might improve our understanding of various biological processes in live organisms and facilitate the development of novel therapeutic strategies for disease treatment.
Gene regulatory networks can be constructed based on scRNA-seq data using regression models, co-regulatory interactions, and reconstruction of developmental trajectory.
The regression-based approaches use gene lists to evaluate connections between the target genes and their regulators, as well as to estimate the strength of these interactions. GENIE3 was the original method developed for the regression-based construction of gene regulatory networks [92] and is still widely used for the construction of gene regulatory networks from the bulk RNA-seq and scRNA-seq data. However, in the case of scRNA-seq data, GENIE3 cannot be used if the number of investigated cells is within several thousands. This issue was successfully resolved using gradient boosting in the GRNBoost2 [93], although this method has a serious drawback, namely, a large number of false-positive connections identified by regression analysis of single cells in comparison with the analysis of bulk RNA-seq data. The use of SCENIC tool [94] helped to overcome this disadvantage by selecting connections between the regulators and target genes containing putative binding sites for the respective transcription factors. A combination of transcription factor with the activated target genes is called a regulon.
Construction of gene networks based on co-regulatory interactions involves calculation of correlation between the expression of individual genes in single cells using the weighted gene co-expression network analysis (WGCNA) method that employs the Pearson coefficient and Spearman’s rank correlation coefficient [95]. Co-expression modules are correlated with the gene functions using the GSEA method [96] and databases (e.g., STRING [97] and HumanNet [98]). The use of WGCNA with scRNA-seq data allows to identify functional modules and their key genes for each cell type, which could be associated with particular physiological or pathological states [99]. The key genes have the highest number of correlations in terms of co-expression and define to a great degree the functions of the modules. Identification of these genes helps to reveal, for example, the factors associated with chemotherapy resistance [100] or prognostic markers [101].
Analysis of developmental trajectories considers single-cell sequencing data as a dynamic system that provides an opportunity to go beyond the statistical nature of transcriptome and to obtain the pseudotime for subsequent construction of gene networks using common differential equations. Such networks reflect the dynamics of gene interactions, i.e., changes in the gene expression over continuous pseudotime are characterized by the functions that include the activating and suppressing effects of other genes as variables [102]. This approach most accurately describes gene interactions in continuous processes, e.g., differentiation, and is realized in the SCODE tool [103].
ANALYSIS OF CNVs
CNVs provide an important contribution to the genetic variability of live organisms and define predisposition to various diseases. The main criteria for the assignment of a structural variant to the copy number variants are repeatability, numerical variability, and ‘significant’ length. Despite the predetermined criteria, the boundaries between the types of structural variants are defined differently in different studies, and that is why some CNVs have been simultaneously assigned to several different categories [104]. At present, many researchers define CNVs as unbalanced chromosome rearrangements – deletions and insertions of DNA sequences, whose sizes varies from several kilobases (focal) to entire chromosomes (chromosomal). CNVs can contain mobile genetic elements and non-coding sequences [105]. Chromosomal CNVs are generated by aneuploid cells with an abnormal number of chromosomes and alter the transcription levels of a large number of genes. CNVs could be neutral or pathogenic; the pathogenicity of CNV is determined by its direct effect on the gene expression and/or formation of new protein products [106].
The classic methods used for CNV identification are array-based comparative genomic hybridization (aCGH), multiplex ligation-dependent probe amplification (MLPA), and new-generation sequencing (NGS), mainly whole-genome sequencing (WGS). However, aCGH and MLPA are limited by the microarray resolution determined by the coverage and density of fluorescent probes and unable to detect the copy-neutral loss of heterozygosity. CNV analysis in WGS is complicated by the costs, duration of data processing, and high computation requirements [107].
There are only few methods for the CNV identification from scRNA-seq data. All of them are based on the assumption that differential gene expression correlates with the CNVs [108]. The inferCNV method uses the averaging of gene expression levels and compares the CNV profile of investigated sample with the reference. Despite the fact that this method reveals with a high accuracy the clonal changes at the level of chromosome arms, identification of subclonal differences using inferCNV is problematic. The results obtained with inferCNV are also very sensitive to the selection of reference cells. Therefore, independent normalization of different cell types using respective reference cells is required [109]. The results are also affected by the absence of data on the B-allele frequency (BAF), a normalized measure of the allelic intensity ratio of two alleles (A and B), leading to a high false-positive rate.
Other tools developed for the CNV analysis combine genetic and transcriptional information. In particular, HoneyBADGER (hidden Markov model integrated Bayesian approach) [109] calculates the deviation of the fraction of alleles of heterozygous variants from the expected value and identifies the CNV regions. To prevent the emergence of false positives, the posterior probability of belonging of predicted CNV regions to the specified states is estimated. In HoneyBADGER, it is necessary to first identify the SNVs, because this tool confirms the presence of CNVs in the candidate regions based on the monoallelic expression of SNVs in them. Another method, Casper [110], uses multiscale decomposition for smoothing the signals of expression and allelic shift to removes most of the noise. Because this tool generates the profile of allelic shift from the aligned reads, no SNV identification is required. However, because the signal of the alternative allele frequency shift is calculated by combining all reads, the cells with a larger number of reads could dominate in the shift signal, which could lead to the distortion of results. Although the described methods were developed for the analysis of full-length transcripts, they have been also validated for the transcript end sequencing [109, 110]. The CopyKAT tool with the integrative Bayesian approach and hierarchic clustering was developed specifically for working with the transcript end scRNA-seq data [111]. This method is more suitable for the analysis of tumor cells, which are often aneuploid. Thus, it was shown to be effective for the identification of tumor and hybrids cells among the circulating epithelial cell in breast cancer patients [112].
While the tools for CNV identification used in WGS are based on the uniform genome coverage, in the case of scRNA-seq, the signal is concentrated only in exons. In this regard, it is recommended to conduct analysis of the allelic imbalance in order to understand the correlation between the genome and transcriptome. However, distinguishing between the true gene variants and technical artefacts can be difficult due to the allelic dropout, heterogeneity, and low sequencing depth [113]. Hence, at present, analysis of DNA ploidy and identification of aneuploidy using scRNA-seq data provides more accurate results than identification of focal CNVs.
IDENTIFICATION OF SINGLE-NUCLEOTIDE VARIANTS
Similar to CNVs, SNVs contribute to the genetic variability of living organisms, affect the course of biological processes, and could play a role of genetic factors determining predisposition to diseases. Identification of SNVs is possible with various molecular-genetic techniques including the most popular ones, such as polymerase chain reaction, microarrays, Sanger sequencing, and NGS. Identification of SNVs at a single-cell level is typically done by DNA sequencing. The most informative and conceptually correct approach is scDNA-seq in the Tapestri platform (Mission Bio). However, analysis of SNVs could be performed based on scRNA-seq data that also provide information on the gene expression. The main limitation in this case is that SNV analysis is applied only to the protein-coding sequences (exons), because the most common source for scRNA-seq is mRNA. Moreover, different patterns of gene expression and alternative splicing significantly limit the number of protein-encoding genomic regions available for analysis. Another important issue is that the 5′ or 3′ scRNA-seq most often used for the gene expression analysis excludes a significant portion of nucleotide sequences from analysis. This problem is especially significant in the case of 3′ sequencing, when reads cover only a small part of the poly(A) tail of mRNA, while a large portion of exon sequences, which are most interesting for the SNV analysis, is lost. This problem can be partially resolved in the case of 5′ sequencing, if the analyzed exome sequence is sufficiently expressed and the process of sample preparation involves random fragmentation of mRNA captured via the poly(A)-tail and conversion of the formed fragments into cDNA to be used as a template for the library preparation. Another limitation in the SNV analysis of scRNA-seq data could be allelic dropout, in particular, when the droplet-in-oil technology is used for the isolation of single cells prior to the barcoding and amplification of target molecules, which hinders identification of subpopulations of heterozygous cells. The above limitations should be taken into consideration while planning the analysis of SNVs based on scRNA-seq data. If possible, the pair-end sequencing should be used followed by verification by the classic approaches of molecular genetics.
In the majority of cases, identification of SNVs based on scRNA-seq data is performed by the methods developed for the analysis of DNA sequencing data, such as SAMtools, GATK, CTAT, FreeBayes, MuTect2, Strelka2, VarScan2, and others. The general workflow of these algorithms involves four stages: mapping to the reference genome, data preprocessing, variant calling, and filtering out false positives. The algorithm used most often for mapping is STAR, as the one recommended by the GATK Best Practices [114]. To analyze scRNA-seq data, the GSNAP tool can be used that works with short and difficult-to-map sequences [115]. Data preprocessing is used for the removal of duplicates, repeated alignment, and basic evaluation of the read quality. Identification of genetic variants is carried out based on the deviation of nucleotide sequences from the reference ones and removal of variants with a low quality or insufficient coverage. Although MuTect2, Strelka2, and VarScan2 are used mainly for DNA sequencing as well as bulk RNA-seq, the variants identified with the help of these algorithms could be correlated with the single-cell clusters revealed with other tools, for example, VarTrix, in order to elucidate the genotype–phenotype associations. It should be mentioned that the majority of described algorithms, with the exception of SAMtools [116], operate to a certain degree on the basis of GATK. More detailed comparison of these pipelines could be found in the review by Liu et al. [117]. The use of the Pysam tool based on the SAMtools for the detection of variants in the mitochondrial DNA from scRNA-seq data was described in [118].
The throughput capacity (the number of cells that could be analyzed in one experiment, which in turn determines the number of reads per cell) is important when selecting the platform for the library preparation in scRNA-seq. In particular, in the Fluidigm C1 platform (1000 per run), the sequencing depth could reach 1 million per cell, while in the 10x Genomics Chromium (up to 10,000 cells per run), the sequencing depth in rarely is above 10-20 thousand, meaning that weakly expressed variants and subclonal SNVs might not be detected. Further increase in the number of reads can be ineffective in the case of low library complexity and high sequencing saturation rate. In part, this is associated with the fact that the vast majority of reads would be mapped to a limited group of highly enriched transcripts, and detection of weakly expressed genes and variants would require a significant increase of the sequencing depth. Such situation, for example, has been described for 10x Genomics scRNA-seq of mononuclear cells in the peripheral blood with the sequencing saturation over 90%. The probability of SNV detection can be increased by the analysis of PCR duplicates formed as a result of multiple amplification of a small number of original molecules. In standard bioinformatics algorithms, such duplicates are removed from the following analysis as a source of false positives. However, Wilson et al. [119] described the scSNV pipeline that allows to analyze such duplicates with a low false-positive rate of SNV detection. This method involves the ‘fusion’ of the duplicate sequences into long molecules after alignment to a reference followed by their analysis. In the process, the reads with a low complexity and artifacts from incorrectly mapped reads, which are the main source of false positives, are removed.
CANCER PHYLOGENETICS
One of the main features of oncological diseases is genomic instability [120]. Genetic alterations, such as single-nucleotide variants and copy number aberrations, are the drivers of clonal evolution of tumor cells leading to the formation of clones and subclones resistant to antitumor therapy and having a high capacity to metastasis and recurrence. Investigation of the tumor clonal composition, especially its dynamics in the course of treatment, allows not only to understand the mechanisms behind the emergence and progression of malignant neoplasms, but also to develop effective treatment strategies, including those adapted to individual patients.
As a rule, investigation of genetic heterogeneity and clonal evolution of tumors involves bulk DNA-seq. However, the information on rare events is often lost when DNA from several thousands or millions of cells is mixed. Application of scDNA-seq could resolve the problems of searching for rare variants and analysis of tumor clonal structure via barcoding of each cell. However, the application of this method is significantly limited at present. The only commercially available scDNA-seq technology Tapestri allows to evaluate the structure of a gene panel selected by the user or provided by the manufacturer. The approaches based on the whole-genome amplification have a number of disadvantages, including insufficient genome coverage or systemic amplification error, which results in very noisy data [121]. That is why analysis of clonal evolution based on scRNA-seq data seems very suitable due to the possibility of simultaneous evaluation of genetic and transcriptional heterogeneity. However, this approach to the tumor phylogeny elucidation has several limitations including, in particular, impossibility of searching for genetic variants in non-transcribed regions, existence of allele-specific expression, low depth of scRNA-seq, and high level of noise in the obtained data [117, 122, 123]. Therefore, bioinformatics analysis of scRNA-seq data with the purpose of examining the clonal structure of tumors is challenging and so far has been implemented only in few tools (DENDRO, Cardelino, Trisicell, and SASC).
DENDRO takes into account the transcriptional bursting, SNV drop-outs, and sequencing errors [124]. It was used for estimating the mutational load and identification of neoantigens in each tumor subclone, as well as establishing association between the transcriptome changes and genetic divergence of tumor cells [124].
The Bayesian method Cardelino allows to integrate information on the phylogeny constructed based on bulk DNA-seq or scDNA-seq data with the data on allele variants obtained by scRNA-seq [125]. This approach considers stochastic SNV dropout in the transcriptome data and systemic allelic imbalance caused by monoallelic expression or effects of regulatory factors. In addition, Cardelino can provide information on the subclonal hierarchy of tumor cells based on scRNA-seq data only.
The majority of tools used for establishing the phylogeny are based on the infinite site assumption, according to which each mutation emerges only once and is not eliminated in the process of phylogenies. This model significantly simplifies computing and can be used for building phylogenetic trees of normal cells, but not of malignant cells because of the high rate of accumulation of mutations, as well as their elimination due to the emergence of CNVs. The developers of the SASC tool for the analysis of intra-tumor progression moved away from the perfect phylogeny model and used phylogenetic Dollo-k model, which considers mutation elimination during tumor evolution [126]. The use of this model brings in silico constructed phylogenetic trees closer to the real ones. Moreover, this tool considers differences in the rate of false-negative results for each mutation due to the difference in the levels of gene expression.
The Trisicell tool has been developed for clarification the results, increasing the throughput of existing phylogeny-building tools, and comparing the trees built with different tools and/or different datasets [127]. Trisicell includes three computational methods: Trisicell-Boost, Trisicell-PartF, and Trisicell-Cons. Trisicell-Boost increases the throughput and accuracy of other tools by using multiple selection of random subsets of mutations and building a tree for each phylogenetic mutation. After that, Trisicell-Boost compares different trees for the same sample and builds a resulting tree based on the consensus. Next, Trisicell-PartF calculates the probability of the presence of each node of the consensus tree in the investigated cells. Trisicell-Cons is designed for building consensus phylogenetic trees from the trees obtained with different tools and/or from scDNA-seq and scRNA-seq data. Trisicell-Cons minimizes the number of branches of two of more trees, resulting in a more reliable history of tumor progression.
The above-described tools are more applicable for processing the data of the full-length transcript sequencing (Smart-seq, NuGen Solo, and others) that provides the most uniform coverage and a relatively low level of noise [128]. Analysis of data of transcript end sequencing (10x Genomics Chromium, BD Rhapsody, and others) could lead to the errors in the identification of gene variants due to the low sequencing depth and, as a consequence, construction of incorrect phylogenetic trees. In this regard, it is advisable to combine transcript end sequencing with bulk DNA-seq or scDNA-seq and to conduct joint bioinformatics analysis with the help of, for example, Cardelino or Trisicell.
EPIGENOMICS: CHROMATIN ACCESSIBILITY, IDENTIFICATION OF
TRANSCRIPTION FACTOR-BINDING SITES
The spatiotemporal dynamics of gene expression is ensured by the functioning of numerous transcription factors and is regulated by multiple epigenetic mechanisms. Chromatin accessibility and transcriptional activity at the genome regulatory sites are among the key factors of the gene expression regulation. Regulatory elements, such as promoters and enhancers, are DNA sequences of several hundreds to thousands base pairs in length that contain unique binding sites for transcription factors [129]. Comparative analysis of binding motifs in the regulatory elements in combination with the information on the expression of transcription factors facilitates elucidation of the mechanisms of normal cellular processes and development of diseases.
The cell-specific activity of promoters is usually mediated by enhancers, which are responsible for the precise control of gene expression in a multicellular organism [130]. Hence, changes in the expression of the same gene in different types of cells or in the same type of cells but at different stages can be explained by changes in these cis-regulatory elements [131].
At present, accessible DNA regions are identified mostly by the assay for transposase-accessible chromatin using sequencing (ATAC-seq). This approach has become very popular due to the relative simplicity of the experimental procedure, as well as a small size of the initial sample required – from a single cell to several hundred of cells [132]. However, chromatin accessibility alone is insufficient for determining the type of regulatory element, which also requires information on the transcription factors binding to the open sites on chromatin and the profile of post-translational modification of histones flanking accessible DNA in nucleosomes. The method of chromatin immunoprecipitation followed by sequencing (ChIP-seq), which uses antibodies against transcription factors or against specific post-translational modification of histones, has allowed to map different regulatory elements in their active or repressed states [131]. Recently, the single-cell CUT&TAG method was developed for investigating the whole-genome distribution of different histone modifications at a single-cell level [133]. Although efficient mapping of genome regulatory elements can be achieved via combined application of the abovementioned techniques, it has serious limitations associated with the cost and requirements for large-size biological samples, as is impossible to conduct these analyses in the same cell samples. Moreover, the data of scATAC-seq and single-cell CUT&TAG are discrete by nature because each genome locus has only two chromatin copies that could be analyzed within a cell. The data obtained with these methods are limited (~104 reads per cell) and, therefore, have a narrow dynamic range, which distinguishes them from the information obtained by scRNA-seq, which is more continuous because a gene could have several analyzed transcripts in the cell.
Another feature of functionally active promoters and enhancers is transcription. Promoters ensure transcription of RNAs of the respective genes, while enhancer RNAs (eRNAs) are transcribed from the enhancers. Studying the activity of regulatory elements revealed that the eRNA is transcribed when the enhancer is in contact with the corresponding promoter; this process correlates with histone modifications in active enhancers and is associated with transcription activation [129].
A large amount of accumulated RNA-seq and ATAC-seq data reveal the correlation between the chromatin accessibility and transcription. Modern methods of data analysis use machine learning techniques to predict the chromatin landscape based on the RNA-seq data. The BIRD tool (big data regression for predicting DNase I hypersensitivity) based on the regression models uses RNA-seq data for predicting open chromatin region. The method had been initially developed as a training set for the DNase-seq method but has been then successfully used with the ATAC-seq data. BIRD can predict open chromatin regions using both bulk RNA-seq and scRNA-seq data [134]. The obtained results could be used for the analysis of chromatin enrichment with the binding motifs for specific transcription factors in the promoters of DEGs with the widely used set of MEME tools based on hidden Markov model [135] and ChromVAR R-package [136]. However, this approach cannot be applied for the analysis of enhancers, as not all open chromatin regions located at a distance from the genes are enhancers. One of the latest tools developed for the analysis of regulatory elements based on scRNA-seq data, SCAFE (single cell analysis of five-prime ends), provides solution for this problem based on the fact of transcription from active regulatory elements. The use of 5′ scRNA-seq allows identification of the transcription start sites (TSSs) in both promoters (for estimation of gene transcription) and enhancers (for estimation of eRNA transcription). To search for the transcribed cis-regulatory elements, SCAFE uses a reference gene package, which contains information on existing open chromatin regions revealed by ATAC-seq. After identification of TSSs, this tool identifies the regulatory elements. Beside analysis of transcription factor-binding motifs, SCAFE can be used for evaluating the changes in the dynamics of transcription of active regulatory elements in different states and identification of co-transcribed enhancers and promoters for the prediction of their physical interactions [137]. This analysis could be performed with the Cicero R-package developed for predicting interactions between the cis-regulatory DNA elements based on the chromatin accessibility data [138].
It is now possible to obtain information on the nature of DEGs by examining the activity of regulatory elements of all genes under investigation using one type of experimental data. A significant limitation of this approach is that it requires ATAC-seq data as a part of the training set, thus making challenging the use BIRD and SCAFE in the studies of non-model organisms. Unlike in the classic experimental approaches, the information on the accessible chromatin sites based on scRNA-seq data is formed only for the genes whose transcripts are detected. Hence, it is impossible to obtain complete epigenomic status of each cell. However, the obtained data are sufficient to evaluate the differences between the cells in the investigated sample. Further development of experimental approaches aimed to extend the sequencing depth for each single cell, as well as the improvement of computational procedures will increase the efficiency of prediction of the chromatin accessibility dynamics and activity of regulatory elements based on scRNA-seq data.
RECONSTRUCTION OF SPATIAL TRANSCRIPTOMICS
The spatial arrangement of cells in organs and tissues is closely associated with their biological functions. Although all cells have the same genome, their morphology and gene expression patterns differ significantly depending on the tissue type and location. Such cellular heterogeneity is associated with both intracellular regulatory mechanisms and effects of extracellular environment. The latter are most pronounced in various malignant neoplasms, where the cells of tumor microenvironment significantly contribute to the disease course and response to the antitumor therapy [139-141].
scRNA-seq allows to determine the cellular composition of investigated samples, transcriptional features of cells, cell differentiation trajectories, and other properties (see above). However, the information on the spatial cell arrangement in a tissue is lost due to the disintegration of samples during the cDNA library preparation and can be predicted only approximately. The algorithm for the reconstruction of the cell spatial arrangement, novoSpaRc, is based on the concept that cells located in a close vicinity of each other have more similar transcriptional profiles [142] than cells located at a distance from each other. However, for the reconstruction of spatial organization, novoSpaRc uses pre-determined geometric shapes as a reference, so that all calculations are based on the features of the selected space. Moreover, the similarity of expression profiles in the cells can indeed be the consequence of their close location, but cannot determine it. Another tool, CSOmap, predicts coordinates of each cell in the three-dimensional pseudospace not limited by a specified shape [143]. CSOmap is based on the assumption that the spatial arrangement of cells is determined by their ligand–receptor interactions. In particular, this tool combines the gene expression profiles of single cells with the widely available information on the ligand–receptor interactions [144, 145] in order to create an affinity matrix that is transferred into a three-dimensional space. This approach allows not only to reconstruct the spatial organization de novo, but also to estimate the statistical significance of the cell–cell interactions and contribution of individual ligand–receptor pairs to the formation of such communications. One of the drawbacks of this tool is a variability of the results: information on the ligand–receptor interactions obtained from different sources can differ, which might affect the results.
Neither immunohistochemical staining, nor variants of in situ hybridization and laser microdissection-assisted gene expression profiling are ideal methods for investigation of spatial transcriptomics. The first two are characterized by a large analysis area, but low transcript coverage. On the contrary, the third approach provides a wide spectrum of analyzed genes, but small investigated area. In recent years, numerous experimental methods have been developed that allow to analyze a large number of transcripts in large tissue samples [146]. Among those, Visium (10x Genomics), GeoMx (NanoString Technologies), Molecular Cartography (Resolve Biosciences), Stereo-seq (BGI STOmics), and other methods of spatial transcriptomics are commercially available. However, at the moment, Visium and GeoMx do not provide a resolution at a single-cell level. The size of a spot with the spatial barcode on the Visium slide is 55 µm, which implies the presence of several cells in this spot. Although GeoMx is theoretically able of capturing data with a single-cell resolution, this ability is limited by a high noise/signal ratio. The use of these methods is also restricted by their high cost. In 2021, the company 10x Genomics announced the release of Visium HD, a spatial transcriptomics technology with the resolution 400 times higher than the classic Visium and, respectively, with the ability to perform analysis at a single-cell level.
CONCLUSIONS AND FUTURE PROSPECTS
The progress in the multiplexing of single-cell cDNA libraries and development of bioinformatics computational techniques has significantly expanded the spectrum of information that could be derived from scRNA-seq data. In addition to classic applications of scRNA-seq, such as determination of cell cycle phases, identification of cell clusters, analysis of differential expression and signaling pathways, and cell typing, it has became possible to investigate various genetic and epigenetic cell features (CNVs, SNVs, state of chromatin) that determine cell phenotype, predict the direction of cell differentiation, obtain information on the cell–cell interactions and phylogeny, including in the context of spatial organization of tissues and organs.
However, obtaining information on CNVs, SNVs, phylogeny, and chromatin accessibility depends to a large extent on the sequencing quality and depth. In this regard, the most adequate solutions are commercially available, but labor-intensive Smart-seq approach based on the capture of full-length transcripts or integrative analysis of scRNA-seq, bulk DNA-seq, and scDNA-seq data. Another potential solution could be improvement of procedures for the preparation of full-length transcript libraries. The FLASH-seq protocol presented in 2022 is faster and more sensitive in comparison with any previously existing scRNA-seq protocols [147]. This method is based on the Smart-seq 2 protocol, but in order to reduce the time of analysis and to increase the resolution, the authors introduced several key modifications. They combined reverse transcription and cDNA preamplification, replaced Superscript II reverse transcriptase with more processive Superscript IV (SSRTIV), increased the amount of deoxycytidine triphosphate to enhance the C-tailing activity of SSRTIV and to boost the template-switching reaction, and replaced the 3′-terminal locked nucleic acid guanidine in the template-switching oligonucleotide (prone to cause strand invasion) with riboguanosine. The platforms for the multiomics analysis of single cells also are very promising. These protocols have been developed already to combine evaluation of chromatin accessibility and single-cell transcriptome (sci-CAR [148] and SNARE-seq [149]) with simultaneous WGS and gene expression profiling (DNTR-seq) [150]. However, these methods are very labor-consuming, expensive, and produce high percent of false-positive results.
We should also mention some important details in the identification of cell–cell interactions based on the analysis of ligand–receptor pairs. The tools using scRNA-seq data are based on the information on the ligand–receptor interactions derived from different sources, so the use of reference data from these sources might lead to different results. For example, the CSOmap tool uses information on the ligand–receptor interactions for the de novo reconstruction of spatial organization. Because of the potential variability of results, such methods can yield only a set of hypotheses that should be validated in other experiments, for example, by the methods of spatial transcriptomics.
In general, we expect that rapid development of bioinformatics analysis tools, improvement of protocols for the preparation of single-cell RNA/DNA libraries, and development of platforms for the multiomics analysis will significantly enhance the quality of biomedical research. The progress in the area of single-cell technologies will help to decipher the cell heterogeneity emerging due to a combination of constitutive and functional features, which, in turn, will expand our understanding of biological processes in the normal and pathological conditions and allow to create fundamentally novel approaches to personalized therapy.
Contributions. A. A. Khozyainova, E. V. Denisov developed the review concept; A. A. Khozyainova, A. A. Valyaeva, M. S. Arbatsky, S. V. Isaev, P. S. Iamshchikov, E. V. Volchkov, M. S. Sabirov, V. R. Zainullina, V. I. Chechekhin, R. S. Vorobev, M. E. Menyailo, P. A. Tyurin-Kuzmin, and E. V. Denisov collected and analyzed information, wrote and edited the manuscript.
Funding. This work was supported by the Russian Science Foundation (project no. 19-75-30016).
Acknowledgments. The authors are grateful to A. A. Shchegoleva for the preparation of figures.
Ethics declarations. The authors declare no conflicts of interest in financial or any other sphere. This article does not contain description of studies with human participants or animals performed by any of the authors.
REFERENCES
1.Tang, F., Barbacioru, C., Wang, Y., Nordman, E.,
Lee, C., Xu, N., Wang, X., Bodeau, J., Tuch, B. B., Siddiqui, A., Lao,
K., and Surani, M. A. (2009) mRNA-Seq whole-transcriptome analysis of a
single cell, Nat. Methods, 6, 377-382, doi:
10.1038/nmeth.1315.
2.Islam, S., Kjällquist, U., Moliner, A., Zajac,
P., Fan, J. B., Lönnerberg, P., and Linnarsson, S. (2011)
Characterization of the single-cell transcriptional landscape by highly
multiplex RNA-seq, Genome Res., 21, 1160-1167, doi:
10.1101/gr.110882.110.
3.Ke, M., Elshenawy, B., Sheldon, H., Arora, A., and
Buffa, F. M. (2022) Single cell RNA‐sequencing: A powerful yet
still challenging technology to study cellular heterogeneity,
BioEssays, 44, 2200084, doi: 10.1002/bies.202200084.
4.Luo, G., Gao, Q., Zhang, S., and Yan, B. (2020)
Probing infectious disease by single-cell RNA sequencing: progresses
and perspectives, Comput. Struct. Biotechnol. J., 18,
2962-2971, doi: 10.1016/j.csbj.2020.10.016.
5.Yifan, C., Fan, Y., and Jun, P. (2020)
Visualization of cardiovascular development, physiology and disease at
the single-cell level: opportunities and future challenges, J. Mol.
Cell. Cardiol., 142, 80-92, doi:
10.1016/j.yjmcc.2020.03.005.
6.Pan, Y., Cao, W., Mu, Y., and Zhu, Q. (2022)
Microfluidics facilitates the development of single-cell RNA
sequencing, Biosensors, 12, 450, doi:
10.3390/bios12070450.
7.Wehrens, M., de Leeuw, A. E., Wright-Clark, M.,
Eding, J. E., Boogerd, C. J., Molenaar, B., van der Kraak, P. H.,
Kuster, D. W., van der Velden, J., and Michels, M. (2022) Single-cell
transcriptomics provides insights into hypertrophic cardiomyopathy,
Cell Rep., 39, 110809, doi:
10.1016/j.celrep.2022.110809.
8.Olah, M., Menon, V., Habib, N., Taga, M. F., Ma,
Y., Yung, C. J., Cimpean, M., Khairallah, A., Coronas-Samano, G., and
Sankowski, R. (2020) Single cell RNA sequencing of human microglia
uncovers a subset associated with Alzheimer’s disease, Nat.
Commun., 11, 6129, doi: 10.1038/s41467-020-19737-2.
9.Kamath, T., Abdulraouf, A., Burris, S., Langlieb,
J., Gazestani, V., Nadaf, N. M., Balderrama, K., Vanderburg, C., and
Macosko, E. Z. (2022) Single-cell genomic profiling of human dopamine
neurons identifies a population that selectively degenerates in
Parkinson’s disease, Nat. Neurosci., 25, 588-595,
doi: 10.1038/s41593-022-01061-1.
10.Zhou, S., Huang, Y.-E., Liu, H., Zhou, X., Yuan,
M., Hou, F., Wang, L., and Jiang, W. (2021) Single-cell RNA-seq
dissects the intratumoral heterogeneity of triple-negative breast
cancer based on gene regulatory networks, Mol. Ther. Nucleic
Acids, 23, 682-690, doi: 10.1016/j.omtn.2020.12.018.
11.Zhang, T.-Q., Chen, Y., and Wang, J.-W. (2021) A
single-cell analysis of the Arabidopsis vegetative shoot apex, Dev.
Cell, 56, 1056-1074.e1058, doi:
10.1016/j.devcel.2021.02.021.
12.Fu, Y., Huang, X., Zhang, P., van de Leemput, J.,
and Han, Z. (2020) Single-cell RNA sequencing identifies novel cell
types in Drosophila blood, J. Genet. Genomics, 47,
175-186, doi: 10.1016/j.jgg.2020.02.004.
13.Jiang, M., Xiao, Y., Weigao, E., Ma, L., Wang,
J., Chen, H., Gao, C., Liao, Y., Guo, Q., and Peng, J. (2021)
Characterization of the zebrafish cell landscape at single-cell
resolution, Front. Cell Dev. Biol., 9, 743421, doi:
10.3389/fcell.2021.743421.
14.Ho, D. W.-H., Tsui, Y.-M., Chan, L.-K., Sze, K.
M.-F., Zhang, X., Cheu, J. W.-S., Chiu, Y.-T., Lee, J. M.-F., Chan, A.
C.-Y., and Cheung, E. T.-Y. (2021) Single-cell RNA sequencing shows the
immunosuppressive landscape and tumor heterogeneity of HBV-associated
hepatocellular carcinoma, Nat. Commun., 12, 3684, doi:
10.1038/s41467-021-24010-1.
15.Zhao, J., Zhang, S., Liu, Y., He, X., Qu, M., Xu,
G., Wang, H., Huang, M., Pan, J., and Liu, Z. (2020) Single-cell RNA
sequencing reveals the heterogeneity of liver-resident immune cells in
human, Cell Discov., 6, 22, doi:
10.1038/s41421-020-0157-z.
16.Macosko, E. Z., Basu, A., Satija, R., Nemesh, J.,
Shekhar, K., Goldman, M., Tirosh, I., Bialas, A. R., Kamitaki, N., and
Martersteck, E. M. (2015) Highly parallel genome-wide expression
profiling of individual cells using nanoliter droplets, Cell,
161, 1202-1214, doi: 10.1016/j.cell.2015.05.002.
17.Kowalczyk, M. S., Tirosh, I., Heckl, D., Rao, T.
N., Dixit, A., Haas, B. J., Schneider, R. K., Wagers, A. J., Ebert, B.
L., and Regev, A. (2015) Single-cell RNA-seq reveals changes in cell
cycle and differentiation programs upon aging of hematopoietic stem
cells, Genome Res., 25, 1860-1872, doi:
10.1101/gr.192237.115.
18.Butler, A., Hoffman, P., Smibert, P., Papalexi,
E., and Satija, R. (2018) Integrating single-cell transcriptomic data
across different conditions, technologies, and species, Nat.
Biotechnol., 36, 411-420, doi: 10.1038/nbt.4096.
19.Wolf, F. A., Angerer, P., and Theis, F. J. (2018)
SCANPY: large-scale single-cell gene expression data analysis,
Genome Biol., 19, 15, doi: 10.1186/s13059-017-1382-0.
20.Scialdone, A., Tanaka, Y., Jawaid, W., Moignard,
V., Wilson, N. K., Macaulay, I. C., Marioni, J. C., and Göttgens,
B. (2016) Resolving early mesoderm diversification through single-cell
expression profiling, Nature, 535, 289-293, doi:
10.1038/nature18633.
21.Tirosh, I., Izar, B., Prakadan, S. M., Wadsworth,
M. H., Treacy, D., Trombetta, J. J., Rotem, A., Rodman, C., Lian, C.,
and Murphy, G. (2016) Dissecting the multicellular ecosystem of
metastatic melanoma by single-cell RNA-seq, Science, 352,
189-196, doi: 10.1126/science.aad0501.
22.Hsiao, C. J., Tung, P., Blischak, J. D., Burnett,
J. E., Barr, K. A., Dey, K. K., Stephens, M., and Gilad, Y. (2020)
Characterizing and inferring quantitative cell cycle phase in
single-cell RNA-seq data analysis, Genome Res., 30,
611-621, doi: 10.1101/gr.247759.118.
23.Liu, Z., Lou, H., Xie, K., Wang, H., Chen, N.,
Aparicio, O. M., Zhang, M. Q., Jiang, R., and Chen, T. (2017)
Reconstructing cell cycle pseudo time-series via single-cell
transcriptome data, Nat. Commun., 8, 22, doi:
10.1038/s41467-017-00039-z.
24.Liang, S., Wang, F., Han, J., and Chen, K. (2020)
Latent periodic process inference from single-cell RNA-seq data,
Nat. Commun., 11, 1441, doi:
10.1038/s41467-020-15295-9.
25.Anafi, R. C., Francey, L. J., Hogenesch, J. B.,
and Kim, J. (2017) CYCLOPS reveals human transcriptional rhythms in
health and disease, Proc. Natl. Acad. Sci. USA, 114,
5312-5317, doi: 10.1073/pnas.1619320114.
26.Liu, J., Yang, M., Zhao, W., and Zhou, X. (2022)
CCPE: cell cycle pseudotime estimation for single cell RNA-seq data,
Nucleic Acids Res., 50, 704-716, doi:
10.1093/nar/gkab1236.
27.Melms, J. C., Biermann, J., Huang, H., Wang, Y.,
Nair, A., Tagore, S., Katsyv, I., Rendeiro, A. F., Amin, A. D.,
Schapiro, D., et al. (2021) A molecular single-cell lung atlas of
lethal COVID-19, Nature, 595, 114-119, doi:
10.1038/s41586-021-03569-1.
28.Delorey, T. M., Ziegler, C. G., Heimberg, G.,
Normand, R., Yang, Y., Segerstolpe, Å., Abbondanza, D., Fleming,
S. J., Subramanian, A., Montoro, D. T., et al. (2021) COVID-19 tissue
atlases reveal SARS-CoV-2 pathology and cellular targets,
Nature, 595, 107-113, doi:
10.1038/s41586-021-03570-8.
29.Mathys, H., Davila-Velderrain, J., Peng, Z., Gao,
F., Mohammadi, S., Young, J. Z., Menon, M., He, L., Abdurrob, F.,
Jiang, X., et al. (2019) Single-cell transcriptomic analysis of
Alzheimer’s disease, Nature, 570, 332-337, doi:
10.1038/s41586-019-1195-2.
30.Velmeshev, D., Schirmer, L., Jung, D., Haeussler,
M., Perez, Y., Mayer, S., Bhaduri, A., Goyal, N., Rowitch, D. H., and
Kriegstein, A. R. (2019) Single-cell genomics identifies cell
type-specific molecular changes in autism, Science, 364,
685-689, doi: 10.1126/science.aav8130.
31.Kathiriya, J. J., Brumwell, A. N., Jackson, J.
R., Tang, X., and Chapman, H. A. (2020) Distinct airway epithelial stem
cells hide among club cells but mobilize to promote alveolar
regeneration, Cell Stem Cell, 26, 346-358.e344, doi:
10.1016/j.stem.2019.12.014.
32.Steuerman, Y., Cohen, M., Peshes-Yaloz, N.,
Valadarsky, L., Cohn, O., David, E., Frishberg, A., Mayo, L.,
Bacharach, E., Amit, I., and Gat-Viks, I. (2018) Dissection of
influenza infection in vivo by single-cell RNA sequencing, Cell
Systems, 6, 679-691.e674, doi:
10.1016/j.cels.2018.05.008.
33.Kiselev, V. Y., Andrews, T. S., and Hemberg, M.
(2019) Challenges in unsupervised clustering of single-cell RNA-seq
data, Nat. Rev. Genet., 20, 273-282, doi:
10.1038/s41576-018-0088-9.
34.Brennecke, P., Anders, S., Kim, J. K.,
Kołodziejczyk, A. A., Zhang, X., Proserpio, V., Baying, B.,
Benes, V., Teichmann, S. A., Marioni, J. C., and Heisler, M. G. (2013)
Accounting for technical noise in single-cell RNA-seq experiments,
Nat. Methods, 10, 1093-1095, doi: 10.1038/nmeth.2645.
35.Andrews, T. S., and Hemberg, M. (2019) M3Drop:
dropout-based feature selection for scRNASeq, Bioinformatics,
35, 2865-2867, doi: 10.1093/bioinformatics/bty1044.
36.Yau, C. (2016) pcaReduce: hierarchical clustering
of single cell transcriptional profiles, BMC Bioinformatics,
17, 140, doi: 10.1186/s12859-016-0984-y.
37.Lin, P., Troup, M., and Ho, J. W. (2017) CIDR:
Ultrafast and accurate clustering through imputation for single-cell
RNA-seq data, Genome Biol., 18, 59, doi:
10.1186/s13059-017-1188-0.
38.Kiselev, V. Y., Kirschner, K., Schaub, M. T.,
Andrews, T., Yiu, A., Chandra, T., Natarajan, K. N., Reik, W.,
Barahona, M., Green, A. R., and Hemberg, M. (2017) SC3: consensus
clustering of single-cell RNA-seq data, Nat. Methods, 14,
483-486, doi: 10.1038/nmeth.4236.
39.Levine, J. H., Simonds, E. F., Bendall, S. C.,
Davis, K. L., El-ad, D. A., Tadmor, M. D., Litvin, O., Fienberg, H. G.,
Jager, A., Zunder, E. R., et al. (2015) Data-driven phenotypic
dissection of AML reveals progenitor-like cells that correlate with
prognosis, Cell, 162, 184-197, doi:
10.1016/j.cell.2015.05.047.
40.Montoro, D. T., Haber, A. L., Biton, M.,
Vinarsky, V., Lin, B., Birket, S. E., Yuan, F., Chen, S., Leung, H. M.,
and Villoria, J. (2018) A revised airway epithelial hierarchy includes
CFTR-expressing ionocytes, Nature, 560, 319-324, doi:
10.1038/s41586-018-0393-7.
41.Plasschaert, L. W., Žilionis, R.,
Choo-Wing, R., Savova, V., Knehr, J., Roma, G., Klein, A. M., and
Jaffe, A. B. (2018) A single-cell atlas of the airway epithelium
reveals the CFTR-rich pulmonary ionocyte, Nature, 560,
377-381, doi: 10.1038/s41586-018-0394-6.
42.Love, M. I., Huber, W., and Anders, S. (2014)
Moderated estimation of fold change and dispersion for RNA-seq data
with DESeq2, Genome Biol., 15, 550, doi:
10.1186/s13059-014-0550-8.
43.Robinson, M. D., McCarthy, D. J., and Smyth, G.
K. (2010) edgeR: a Bioconductor package for differential expression
analysis of digital gene expression data, Bioinformatics,
26, 139-140, doi: 10.1093/bioinformatics/btp616.
44.Van den Berge, K., Perraudeau, F., Soneson, C.,
Love, M. I., Risso, D., Vert, J.-P., Robinson, M. D., Dudoit, S., and
Clement, L. (2018) Observation weights unlock bulk RNA-seq tools for
zero inflation and single-cell applications, Genome Biol.,
19, 24, doi: 10.1186/s13059-018-1406-4.
45.Tang, W., Bertaux, F., Thomas, P., Stefanelli,
C., Saint, M., Marguerat, S., and Shahrezaei, V. (2020) bayNorm:
Bayesian gene expression recovery, imputation and normalization for
single-cell RNA-sequencing data, Bioinformatics, 36,
1174-1181, doi: 10.1093/bioinformatics/btz726.
46.Soneson, C., and Robinson, M. D. (2018) Bias,
robustness and scalability in single-cell differential expression
analysis, Nat. Methods, 15, 255-261, doi:
10.1038/nmeth.4612.
47.Kharchenko, P. V., Silberstein, L., and Scadden,
D. T. (2014) Bayesian approach to single-cell differential expression
analysis, Nat. Methods, 11, 740-742, doi:
10.1038/nmeth.2967.
48.Finak, G., McDavid, A., Yajima, M., Deng, J.,
Gersuk, V., Shalek, A. K., Slichter, C. K., Miller, H. W., McElrath, M.
J., Prlic, M., et al. (2015) MAST: a flexible statistical framework for
assessing transcriptional changes and characterizing heterogeneity in
single-cell RNA sequencing data, Genome Biol., 16, 278,
doi: 10.1186/s13059-015-0844-5.
49.Zhang, J. M., Kamath, G. M., and David, N. T.
(2019) Valid post-clustering differential analysis for single-cell
RNA-Seq, Cell Systems, 9, 383-392.e386, doi:
10.1016/j.cels.2019.07.012.
50.Zimmerman, K. D., Espeland, M. A., and Langefeld,
C. D. (2021) A practical solution to pseudoreplication bias in
single-cell studies, Nat. Commun., 12, 738, doi:
10.1038/s41467-021-21038-1.
51.Denninger, J. K., Walker, L. A., Chen, X.,
Turkoglu, A., Pan, A., Tapp, Z., Senthilvelan, S., Rindani, R.,
Kokiko-Cochran, O. N., and Bundschuh, R. (2022) Robust transcriptional
profiling and identification of differentially expressed genes with low
input RNA sequencing of adult hippocampal neural stem and progenitor
populations, Front. Mol. Neurosci., 15, 810722, doi:
10.3389/fnmol.2022.810722.
52.Hücker, S. M., Fehlmann, T., Werno, C.,
Weidele, K., Lüke, F., Schlenska-Lange, A., Klein, C. A., Keller,
A., and Kirsch, S. (2021) Single-cell microRNA sequencing method
comparison and application to cell lines and circulating lung tumor
cells, Nat. Commun., 12, 4316, doi:
10.1038/s41467-021-24611-w.
53.Valyaeva, A. A., Zharikova, A. A., Kasianov, A.
S., Vassetzky, Y. S., and Sheval, E. V. (2020) Expression of SARS-CoV-2
entry factors in lung epithelial stem cells and its potential
implications for COVID-19, Sci. Rep., 10, 17772, doi:
10.1038/s41598-020-74598-5.
54.Liao, M., Liu, Y., Yuan, J., Wen, Y., Xu, G.,
Zhao, J., Cheng, L., Li, J., Wang, X., Wang, F., et al. (2020)
Single-cell landscape of bronchoalveolar immune cells in patients with
COVID-19, Nat. Med., 26, 842-844, doi:
10.1038/s41591-020-0901-9.
55.Yakushov, S., Menyailo, M., Denisov, E., Karlina,
I., Zainullina, V., Kirgizov, K., Romantsova, O., Timashev, P., and
Ulasov, I. (2022) Identification of factors driving
doxorubicin-resistant ewing tumor cells to survival, Cancers,
14, 5498, doi: 10.3390/cancers14225498.
56.Tyurin-Kuzmin, P. A., Karagyaur, M. N.,
Kulebyakin, K. Y., Dyikanov, D. T., Chechekhin, V. I., Ivanova, A. M.,
Skryabina, M. N., Arbatskiy, M. S., Sysoeva, V. Y., Kalinina, N. I.,
and Tkachuk, V. A. (2020) Functional heterogeneity of protein kinase a
activation in multipotent stromal cells, Int. J. Mol. Sci.,
21, 4442, doi: 10.3390/ijms21124442.
57.Bassez, A., Vos, H., Van Dyck, L., Floris, G.,
Arijs, I., Desmedt, C., Boeckx, B., Vanden Bempt, M., Nevelsteen, I.,
Lambein, K., et al. (2021) A single-cell map of intratumoral changes
during anti-PD1 treatment of patients with breast cancer, Nat.
Med., 27, 820-832, doi: 10.1038/s41591-021-01323-8.
58.Bi, K., He, M. X., Bakouny, Z., Kanodia, A.,
Napolitano, S., Wu, J., Grimaldi, G., Braun, D. A., Cuoco, M. S.,
Mayorga, A., et al. (2021) Tumor and immune reprogramming during
immunotherapy in advanced renal cell carcinoma, Cancer Cell,
39, 649-661.e645, doi: 10.1016/j.ccell.2021.02.015.
59.Hoernes, T. P., Hüttenhofer, A., and
Erlacher, M. D. (2016) mRNA modifications: Dynamic regulators of gene
expression? RNA Biol., 13, 760-765, doi:
10.1080/15476286.2016.1203504.
60.Maier, T., Güell, M., and Serrano, L. (2009)
Correlation of mRNA and protein in complex biological samples, FEBS
Lett., 583, 3966-3973, doi:
10.1016/j.febslet.2009.10.036.
61.Aran, D., Looney, A. P., Liu, L., Wu, E., Fong,
V., Hsu, A., Chak, S., Naikawadi, R. P., Wolters, P. J., Abate, A. R.,
et al. (2019) Reference-based analysis of lung single-cell sequencing
reveals a transitional profibrotic macrophage, Nat. Immunol.,
20, 163-172, doi: 10.1038/s41590-018-0276-y.
62.Ianevski, A., Giri, A. K., and Aittokallio, T.
(2022) Fully-automated and ultra-fast cell-type identification using
specific marker combinations from single-cell transcriptomic data,
Nat. Commun., 13, 1246, doi:
10.1038/s41467-022-28803-w.
63.Shao, X., Liao, J., Lu, X., Xue, R., Ai, N., and
Fan, X. (2020) scCATCH: automatic annotation on cell types of clusters
from single-cell RNA sequencing data, iScience, 23,
100882, doi: 10.1016/j.isci.2020.100882.
64.Guo, H., and Li, J. (2021) scSorter: assigning
cells to known cell types according to marker genes, Genome
Biol., 22, 69, doi: 10.1186/s13059-021-02281-7.
65.Zhang, Z., Luo, D., Zhong, X., Choi, J. H., Ma,
Y., Wang, S., Mahrt, E., Guo, W., Stawiski, E. W., Modrusan, Z.,
Seshagiri, S., Kapur, P., Hon, G. C., Brugarolas, J., and Wang, T.
(2019) SCINA: a semi-supervised subtyping algorithm of single cells and
bulk samples, Genes, 10, 531, doi:
10.3390/genes10070531.
66.Xu, C., Lopez, R., Mehlman, E., Regier, J.,
Jordan, M. I., and Yosef, N. (2021) Probabilistic harmonization and
annotation of single-cell transcriptomics data with deep generative
models, Mol. Syst. Biol., e9620, doi:
10.15252/msb.20209620.
67.Hao, Y., Hao, S., Andersen-Nissen, E., Mauck III,
W. M., Zheng, S., Butler, A., Lee, M. J., Wilk, A. J., Darby, C.,
Zager, M., et al. (2021) Integrated analysis of multimodal single-cell
data, Cell, 184, 3573-3587.e3529, doi:
10.1016/j.cell.2021.04.048.
68.Pasquini, G., Arias, J. E. R., Schäfer, P.,
and Busskamp, V. (2021) Automated methods for cell type annotation on
scRNA-seq data, Computat. Struct. Biotechnol. J., 19,
961-969, doi: 10.1016/j.csbj.2021.01.015.
69.Khrameeva, E., Kurochkin, I., Han, D., Guijarro,
P., Kanton, S., Santel, M., Qian, Z., Rong, S., Mazin, P., Sabirov, M.,
et al. (2020) Single-cell-resolution transcriptome map of human,
chimpanzee, bonobo, and macaque brains, Genome Res., 30,
776-789, doi: 10.1101/gr.256958.119.
70.Han, G., Deng, Q., Marques-Piubelli, M. L., Dai,
E., Dang, M., Ma, M. C. J., Li, X., Yang, H., Henderson, J.,
Kudryashova, O., et al. (2022) Follicular lymphoma microenvironment
characteristics associated with tumor cell mutations and MHC class II
expression, Blood Cancer Discov., 3, 428-443, doi:
10.1158/2643-3230.BCD-21-0075.
71.La Manno, G., Soldatov, R., Zeisel, A., Braun,
E., Hochgerner, H., Petukhov, V., Lidschreiber, K., Kastriti, M. E.,
Lönnerberg, P., Furlan, A., et al. (2018) RNA velocity of single
cells, Nature, 560, 494-498, doi:
10.1038/s41586-018-0414-6.
72.Trapnell, C., Cacchiarelli, D., Grimsby, J.,
Pokharel, P., Li, S., Morse, M., Lennon, N. J., Livak, K. J.,
Mikkelsen, T. S., and Rinn, J. L. (2014) The dynamics and regulators of
cell fate decisions are revealed by pseudotemporal ordering of single
cells, Nat. Biotechnol., 32, 381-386, doi:
10.1038/nbt.2859.
73.Ji, Z., and Ji, H. (2016) TSCAN: Pseudo-time
reconstruction and evaluation in single-cell RNA-seq analysis,
Nucleic Acids Res., 44, e117, doi:
10.1093/nar/gkw430.
74.Street, K., Risso, D., Fletcher, R. B., Das, D.,
Ngai, J., Yosef, N., Purdom, E., and Dudoit, S. (2018) Slingshot: cell
lineage and pseudotime inference for single-cell transcriptomics,
BMC Genomics, 19, 477, doi:
10.1186/s12864-018-4772-0.
75.Saelens, W., Cannoodt, R., Todorov, H., and
Saeys, Y. (2019) A comparison of single-cell trajectory inference
methods, Nat. Biotechnol., 37, 547-554, doi:
10.1038/s41587-019-0071-9.
76.Nam, D. K., Lee, S., Zhou, G., Cao, X., Wang, C.,
Clark, T., Chen, J., Rowley, J. D., and Wang, S. M. (2002) Oligo (dT)
primer generates a high frequency of truncated cDNAs through internal
poly (A) priming during reverse transcription, Proc. Natl. Acad.
Sci. USA, 99, 6152-6156, doi: 10.1073/pnas.092140899.
77.Perrimon, N., Pitsouli, C., and Shilo, B. Z.
(2012) Signaling mechanisms controlling cell fate and embryonic
patterning, Cold Spring Harb. Perspect. Biol., 4,
a005975, doi: 10.1101/cshperspect.a005975.
78.Gaud, G., Lesourne, R., and Love, P. E. (2018)
Regulatory mechanisms in T cell receptor signalling, Nat. Rev.
Immunol., 18, 485-497, doi: 10.1038/s41577-018-0020-8.
79.Yeung, T. L., Sheng, J., Leung, C. S., Li, F.,
Kim, J., Ho, S. Y., Matzuk, M. M., Lu, K. H., Wong, S. T. C., and Mok,
S. C. (2019) Systematic identification of druggable epithelial-stromal
crosstalk signaling networks in ovarian cancer, J. Natl. Cancer
Institute, 111, 272-282, doi: 10.1093/jnci/djy097.
80.Chua, R. L., Lukassen, S., Trump, S., Hennig, B.
P., Wendisch, D., Pott, F., Debnath, O., Thürmann, L., Kurth, F.,
Völker, M. T., Kazmierski, J., Timmermann, B., Twardziok, S.,
Schneider, S., Machleidt, F., Müller-Redetzky, H., Maier, M.,
Krannich, A., Schmidt, S., Balzer, F., et al. (2020) COVID-19 severity
correlates with airway epithelium-immune cell interactions identified
by single-cell analysis, Nat. Biotechnol., 38, 970-979,
doi: 10.1038/s41587-020-0602-4.
81.Yuan, D., Tao, Y., Chen, G., and Shi, T. (2019)
Systematic expression analysis of ligand-receptor pairs reveals
important cell-to-cell interactions inside glioma, Cell Commun.
Signal., 17, 48, doi: 10.1186/s12964-019-0363-1.
82.Rao, V. S., Srinivas, K., Sujini, G. N., and
Kumar, G. N. (2014) Protein-protein interaction detection: methods and
analysis, Int. J. Proteomics, 2014, 147648, doi:
10.1155/2014/147648.
83.Wang, Y., Wang, R., Zhang, S., Song, S., Jiang,
C., Han, G., Wang, M., Ajani, J., Futreal, A., and Wang, L. (2019)
iTALK: an R package to characterize and illustrate intercellular
communication, bioRxiv, 507871, doi: 10.1101/507871.
84.Efremova, M., Vento-Tormo, M., Teichmann, S. A.,
and Vento-Tormo, R. (2020) CellPhoneDB: inferring cell-cell
communication from combined expression of multi-subunit ligand-receptor
complexes, Nat. Protocols, 15, 1484-1506, doi:
10.1038/s41596-020-0292-x.
85.Cabello-Aguilar, S., Alame, M., Kon-Sun-Tack, F.,
Fau, C., Lacroix, M., and Colinge, J. (2020) SingleCellSignalR:
inference of intercellular networks from single-cell transcriptomics,
Nucleic Acids Res., 48, e55, doi:
10.1093/nar/gkaa183.
86.Zhang, Y., Liu, T., Hu, X., Wang, M., Wang, J.,
Zou, B., Tan, P., Cui, T., Dou, Y., Ning, L., Huang, Y., Rao, S., Wang,
D., and Zhao, X. (2021) CellCall: integrating paired ligand-receptor
and transcription factor activities for cell-cell communication,
Nucleic Acids Res., 49, 8520-8534, doi:
10.1093/nar/gkab638.
87.Tsuyuzaki, K., Ishii, M., and Nikaido, I. (2019)
Uncovering hypergraphs of cell-cell interaction from single cell
RNA-sequencing data, bioRxiv, 566182, doi: 10.1101/566182.
88.Armingol, E., Officer, A., Harismendy, O., and
Lewis, N. E. (2021) Deciphering cell-cell interactions and
communication from gene expression, Nat. Rev. Genet., 22,
71-88, doi: 10.1038/s41576-020-00292-x.
89.Fischer, D. S., Schaar, A. C., and Theis, F. J.
(2021) Learning cell communication from spatial graphs of cells,
bioRxiv, doi: 10.1101/2021.07.11.451750.
90.Van Dam, S., Võsa, U., van der Graaf, A.,
Franke, L., and de Magalhães, J. P. (2018) Gene co-expression
analysis for functional classification and gene-disease predictions,
Brief. Bioinform., 19, 575-592, doi:
10.1093/bib/bbw139.
91.Rambow, F., Rogiers, A., Marin-Bejar, O., Aibar,
S., Femel, J., Dewaele, M., Karras, P., Brown, D., Chang, Y. H.,
Debiec-Rychter, M., Adriaens, C., Radaelli, E., Wolter, P., Bechter,
O., Dummer, R., Levesque, M., Piris, A., Frederick, D. T., Boland, G.,
Flaherty, K. T., et al. (2018) Toward minimal residual disease-directed
therapy in melanoma, Cell, 174, 843-855.e819, doi:
10.1016/j.cell.2018.06.025.
92.Huynh-Thu, V. A., Irrthum, A., Wehenkel, L., and
Geurts, P. (2010) Inferring regulatory networks from expression data
using tree-based methods, PLoS One, 5, e12776, doi:
10.1371/journal.pone.0012776.
93.Moerman, T., Aibar Santos, S., Bravo
González-Blas, C., Simm, J., Moreau, Y., Aerts, J., and Aerts,
S. (2019) GRNBoost2 and Arboreto: efficient and scalable inference of
gene regulatory networks, Bioinformatics, 35, 2159-2161,
doi: 10.1093/bioinformatics/bty916.
94.Aibar, S., González-Blas, C. B., Moerman,
T., Huynh-Thu, V. A., Imrichova, H., Hulselmans, G., Rambow, F.,
Marine, J.-C., Geurts, P., and Aerts, J. (2017) SCENIC: single-cell
regulatory network inference and clustering, Nat. Methods,
14, 1083-1086, doi: 10.1038/nmeth.4463.
95.Langfelder, P., and Horvath, S. (2008) WGCNA: an
R package for weighted correlation network analysis, BMC
Bioinformatics, 9, 559, doi: 10.1186/1471-2105-9-559.
96.Subramanian, A., Tamayo, P., Mootha, V. K.,
Mukherjee, S., Ebert, B. L., Gillette, M. A., Paulovich, A., Pomeroy,
S. L., Golub, T. R., Lander, E. S., and Mesirov, J. P. (2005) Gene set
enrichment analysis: a knowledge-based approach for interpreting
genome-wide expression profiles, Proc. Natl. Acad. Sci. USA,
102, 15545-15550, doi: 10.1073/pnas.0506580102.
97.Szklarczyk, D., Gable, A. L., Lyon, D., Junge,
A., Wyder, S., Huerta-Cepas, J., Simonovic, M., Doncheva, N. T.,
Morris, J. H., Bork, P., et al. (2019) STRING v11:
protein–protein association networks with increased coverage,
supporting functional discovery in genome-wide experimental datasets,
Nucleic Acids Res., 47, D607-D613, doi:
10.1093/nar/gky1131.
98.Kim, C. Y., Baek, S., Cha, J., Yang, S., Kim, E.,
Marcotte, E. M., Hart, T., and Lee, I. (2022) HumanNet v3: an improved
database of human gene networks for disease research, Nucleic acids
Res., 50, D632-D639, doi: 10.1093/nar/gkab1048.
99.Xue, Z., Huang, K., Cai, C., Cai, L., Jiang,
C.-y., Feng, Y., Liu, Z., Zeng, Q., Cheng, L., Sun, Y. E., et al.
(2013) Genetic programs in human and mouse early embryos revealed by
single-cell RNA sequencing, Nature, 500, 593-597, doi:
10.1038/nature12364.
100.Wu, H., Chen, S., Yu, J., Li, Y., Zhang, X.-y.,
Yang, L., Zhang, H., Jiang, M., Brunicardi, F. C., Wang, C., and Wu, S.
(2018) Single-cell transcriptome analyses reveal molecular signals to
intrinsic and acquired paclitaxel resistance in esophageal squamous
cancer cells, Cancer Lett., 420, 156-167, doi:
10.1016/j.canlet.2018.01.059.
101.Lu, J., Chen, Y., Zhang, X., Guo, J., Xu, K.,
and Li, L. (2022) A novel prognostic model based on single-cell RNA
sequencing data for hepatocellular carcinoma, Cancer Cell Int.,
22, 38, doi: 10.1186/s12935-022-02469-2.
102.Lee, W.-P., and Tzou, W.-S. (2009)
Computational methods for discovering gene networks from expression
data, Brief. Bioinform., 10, 408-423, doi:
10.1093/bib/bbp028.
103.Matsumoto, H., Kiryu, H., Furusawa, C., Ko, M.
S., Ko, S. B., Gouda, N., Hayashi, T., and Nikaido, I. (2017) SCODE: an
efficient regulatory network inference algorithm from single-cell
RNA-Seq during differentiation, Bioinformatics, 33,
2314-2321, doi: 10.1093/bioinformatics/btx194.
104.Pös, O., Radvanszky, J., Buglyó,
G., Pös, Z., Rusnakova, D., Nagy, B., and Szemes, T. (2021) DNA
copy number variation: Main characteristics, evolutionary significance,
and pathological aspects, Biomed. J., 44, 548-559, doi:
10.1016/j.bj.2021.02.003.
105.Lye, Z. N., and Purugganan, M. D. (2019) Copy
number variation in domestication, Trends Plant Sci., 24,
352-365, doi: 10.1016/j.tplants.2019.01.003.
106.Zhao, Y., Carter, R., Natarajan, S., Varn, F.
S., Compton, D. A., Gawad, C., Cheng, C., and Godek, K. M. (2019)
Single-cell RNA sequencing reveals the impact of chromosomal
instability on glioblastoma cancer stem cells, BMC Med. Genom.,
12, 79, doi: 10.1186/s12920-019-0532-5.
107.Zhou, B., Ho, S. S., Zhang, X., Pattni, R.,
Haraksingh, R. R., and Urban, A. E. (2018) Whole-genome sequencing
analysis of CNV using low-coverage and paired-end strategies is
efficient and outperforms array-based CNV analysis, J. Med.
Genet., 55, 735-743, doi: 10.1136/jmedgenet-2018-105272.
108.Shao, X., Lv, N., Liao, J., Long, J., Xue, R.,
Ai, N., Xu, D., and Fan, X. (2019) Copy number variation is highly
correlated with differential gene expression: a pan-cancer study,
BMC Med. Genet., 20, 175, doi:
10.1186/s12881-019-0909-5.
109.Fan, J., Lee, H.-O., Lee, S., Ryu, D.-E., Lee,
S., Xue, C., Kim, S. J., Kim, K., Barkas, N., Park, P. J., et al.
(2018) Linking transcriptional and genetic tumor heterogeneity through
allele analysis of single-cell RNA-seq data, Gen. Res.,
28, 1217-1227, doi: 10.1101/gr.228080.117.
110.Serin Harmanci, A., Harmanci, A. O., and Zhou,
X. (2020) CaSpER identifies and visualizes CNV events by integrative
analysis of single-cell or bulk RNA-sequencing data, Nat.
Commun., 11, 89, doi: 10.1038/s41467-019-13779-x.
111.Gao, R., Bai, S., Henderson, Y. C., Lin, Y.,
Schalck, A., Yan, Y., Kumar, T., Hu, M., Sei, E., Davis, A., et al.
(2021) Delineating copy number and clonal substructure in human tumors
from single-cell transcriptomes, Nat. Biotechnol., 39,
599-608, doi: 10.1038/s41587-020-00795-2.
112.Menyailo, M. E., Zainullina, V. R., Tashireva,
L. A., Zolotareva, S. Y., Gerashchenko, T. S., Alifanov, V. V.,
Savelieva, O. E., Grigoryeva, E. S., Tarabanovskaya, N. A., Popova, N.
O., Khozyainova, A. A., Choinzonov, E. L., Cherdyntseva, N. V.,
Perelmuter, V. M., and Denisov, E. V. (2022) Heterogeneity of
circulating epithelial cells in breast cancer at single-cell
resolution: identifying tumor and hybrid cells, bioRxiv, doi:
10.1101/2021.11.24.469962.
113.Müller, S., Liu, S. J., Di Lullo, E.,
Malatesta, M., Pollen, A. A., Nowakowski, T. J., Kohanbash, G., Aghi,
M., Kriegstein, A. R., Lim, D. A., and Diaz, A. (2016)
Single‐cell sequencing maps gene expression to mutational
phylogenies in PDGF‐and EGF‐driven gliomas, Mol. Syst.
Biol., 12, 889, doi: 10.15252/msb.20166969.
114.McKenna, A., Hanna, M., Banks, E., Sivachenko,
A., Cibulskis, K., Kernytsky, A., Garimella, K., Altshuler, D.,
Gabriel, S., Daly, M., and DePristo, M. A. (2010) The Genome Analysis
Toolkit: a MapReduce framework for analyzing next-generation DNA
sequencing data, Gen. Res., 20, 1297-1303, doi:
10.1101/gr.107524.110.
115.Wu, T. D., Reeder, J., Lawrence, M., Becker,
G., and Brauer, M. J. (2016) GMAP and GSNAP for Genomic Sequence
Alignment: Enhancements to Speed, Accuracy, and Functionality, in
Statistical Genomics, Springer, pp. 283-334, doi:
10.1007/978-1-4939-3578-9_15.
116.Li, H., Handsaker, B., Wysoker, A., Fennell,
T., Ruan, J., Homer, N., Marth, G., Abecasis, G., and Durbin, R. (2009)
The sequence alignment/map format and SAMtools, Bioinformatics,
25, 2078-2079, doi: 10.1093/bioinformatics/btp352.
117.Liu, F., Zhang, Y., Zhang, L., Li, Z., Fang,
Q., Gao, R., and Zhang, Z. (2019) Systematic comparative analysis of
single-nucleotide variant detection methods from single-cell RNA
sequencing data, Gen. Biol., 20, 242, doi:
10.1186/s13059-019-1863-4.
118.Ludwig, L. S., Lareau, C. A., Ulirsch, J. C.,
Christian, E., Muus, C., Li, L. H., Pelka, K., Ge, W., Oren, Y., Brack,
A., et al. (2019) Lineage tracing in humans enabled by mitochondrial
mutations and single-cell genomics, Cell, 176,
1325-1339.e1322, doi: 10.1016/j.cell.2019.01.022.
119.Wilson, G. W., Derouet, M., Darling, G. E., and
Yeung, J. C. (2021) scSNV: accurate dscRNA-seq SNV co-expression
analysis using duplicate tag collapsing, Gen. Biol., 22,
144, doi: 10.1186/s13059-021-02364-5.
120.Yao, Y., and Dai, W. (2014) Genomic instability
and cancer, J. Carcinog. Mutagen., 5, 1000163, doi:
10.4172/2157-2518.1000165.
121.Fu, Y., Zhang, F., Zhang, X., Yin, J., Du, M.,
Jiang, M., Liu, L., Li, J., Huang, Y., and Wang, J. (2019)
High-throughput single-cell whole-genome amplification through
centrifugal emulsification and eMDA, Commun. Biol., 2,
147, doi: 10.1038/s42003-019-0401-y.
122.Schnepp, P. M., Chen, M., Keller, E. T., and
Zhou, X. (2019) SNV identification from single-cell RNA sequencing
data, Hum. Mol. Genet., 28, 3569-3583, doi:
10.1093/hmg/ddz207.
123.Ramazzotti, D., Angaroni, F., Maspero, D.,
Ascolani, G., Castiglioni, I., Piazza, R., Antoniotti, M., and
Graudenzi, A. (2022) Variant calling from scRNA-seq data allows the
assessment of cellular identity in patient-derived cell lines, Nat.
Commun., 13, 2718, doi: 10.1038/s41467-022-30230-w.
124.Zhou, Z., Xu, B., Minn, A., and Zhang, N. R.
(2020) DENDRO: genetic heterogeneity profiling and subclone detection
by single-cell RNA sequencing, Genome Biol., 21, 10, doi:
10.1186/s13059-019-1922-x.
125.McCarthy, D. J., Rostom, R., Huang, Y., Kunz,
D. J., Danecek, P., Bonder, M. J., Hagai, T., Lyu, R., Wang, W.,
Gaffney, D. J., Simons, B. D., Stegle, O., and Teichmann, S. A. (2020)
Cardelino: computational integration of somatic clonal substructure and
single-cell transcriptomes, Nat. Methods, 17, 414-421,
doi: 10.1038/s41592-020-0766-3.
126.Ciccolella, S., Ricketts, C., Soto Gomez, M.,
Patterson, M., Silverbush, D., Bonizzoni, P., Hajirasouliha, I., and
Della Vedova, G. (2020) Inferring cancer progression from Single-Cell
Sequencing while allowing mutation losses, Bioinformatics,
37, 326-333, doi: 10.1093/bioinformatics/btaa722.
127.Mehrabadi, F. R., Marie, K. L.,
Pérez-Guijarro, E., Malikić, S., Azer, E. S., Yang, H.
H., Kızılkale, C., Gruen, C., Robinson, W., Liu, H., et al.
(2021) Profiles of expressed mutations in single cells reveal subclonal
expansion patterns and therapeutic impact of intratumor heterogeneity,
bioRxiv, doi: 10.1101/2021.03.26.437185.
128.Ziegenhain, C., Vieth, B., Parekh, S., Reinius,
B., Guillaumet-Adkins, A., Smets, M., Leonhardt, H., Heyn, H.,
Hellmann, I., and Enard, W. (2017) Comparative analysis of single-cell
RNA sequencing methods, Mol. Cell, 65, 631-643.e634, doi:
10.1016/j.molcel.2017.01.023.
129.Kim, T.-K., and Shiekhattar, R. (2015)
Architectural and functional commonalities between enhancers and
promoters, Cell, 162, 948-959, doi:
10.1016/j.cell.2015.08.008.
130.Shlyueva, D., Stampfel, G., and Stark, A.
(2014) Transcriptional enhancers: from properties to genome-wide
predictions, Nat. Rev. Genet., 15, 272-286, doi:
10.1038/nrg3682.
131.Wray, G. A. (2007) The evolutionary
significance of cis-regulatory mutations, Nat. Rev. Genet.,
8, 206-216, doi: 10.1038/nrg2063.
132.Buenrostro, J. D., Giresi, P. G., Zaba, L. C.,
Chang, H. Y., and Greenleaf, W. J. (2013) Transposition of native
chromatin for multimodal regulatory analysis and personal epigenomics,
Nat. Methods, 10, 1213, doi: 10.1038/nmeth.2688.
133.Wu, S. J., Furlan, S. N., Mihalas, A. B.,
Kaya-Okur, H. S., Feroze, A. H., Emerson, S. N., Zheng, Y., Carson, K.,
Cimino, P. J., and Keene, C. D. (2021) Single-cell CUT&Tag analysis
of chromatin modifications in differentiation and tumor progression,
Nat. Biotechnol., 39, 819-824, doi:
10.1038/s41587-021-00865-z.
134.Zhou, W., Ji, Z., Fang, W., and Ji, H. (2019)
Global prediction of chromatin accessibility using small-cell-number
and single-cell RNA-seq, Nucleic Acids Res., 47, e121,
doi: 10.1093/nar/gkz716.
135.Bailey, T. L., Johnson, J., Grant, C. E., and
Noble, W. S. (2015) The MEME suite, Nucleic Acids Res.,
43, W39-W49, doi: 10.1093/nar/gkv416.
136.Schep, A. N., Wu, B., Buenrostro, J. D., and
Greenleaf, W. J. (2017) chromVAR: inferring
transcription-factor-associated accessibility from single-cell
epigenomic data, Nat. Methods, 14, 975-978, doi:
10.1038/nmeth.4401.
137.Moody, J., Kouno, T., Suzuki, A., Shibayama,
Y., Terao, C., Chang, J.-C., López-Redondo, F., Yip, C. W.,
Ando, Y., Yamamoto, K., Carninci, P., Shin, J. W., and Hon, C.-C.
(2021) Profiling of transcribed cis-regulatory elements in
single cells, bioRxiv, doi: 10.1101/2021.04.04.438388.
138.Pliner, H. A., Packer, J. S.,
McFaline-Figueroa, J. L., Cusanovich, D. A., Daza, R. M., Aghamirzaie,
D., Srivatsan, S., Qiu, X., Jackson, D., and Minkina, A. (2018) Cicero
predicts cis-regulatory DNA interactions from single-cell chromatin
accessibility data, Mol. Cell, 71, 858-871.e858, doi:
10.1016/j.molcel.2018.06.044.
139.Oczko-Wojciechowska, M., Pfeifer, A., Jarzab,
M., Swierniak, M., Rusinek, D., Tyszkiewicz, T., Kowalska, M.,
Chmielik, E., Zembala-Nozynska, E., Czarniecka, A., et al. (2020)
Impact of the tumor microenvironment on the gene expression profile in
papillary thyroid cancer, Pathobiology, 87, 143-154, doi:
10.1159/000507223.
140.Pape, J., Magdeldin, T., Stamati, K., Nyga, A.,
Loizidou, M., Emberton, M., and Cheema, U. (2020) Cancer-associated
fibroblasts mediate cancer progression and remodel the tumouroid
stroma, Br. J. Cancer, 123, 1178-1190, doi:
10.1038/s41416-020-0973-9.
141.Liu, J., Li, P., Wang, L., Li, M., Ge, Z.,
Noordam, L., Lieshout, R., Verstegen, M. M., Ma, B., and Su, J. (2021)
Cancer-associated fibroblasts provide a stromal niche for liver cancer
organoids that confers trophic effects and therapy resistance, Cell.
Mol. Gastroenterol. Hepatol., 11, 407-431, doi:
10.1016/j.jcmgh.2020.09.003.
142.Moriel, N., Senel, E., Friedman, N., Rajewsky,
N., Karaiskos, N., and Nitzan, M. (2021) NovoSpaRc: flexible spatial
reconstruction of single-cell gene expression with optimal transport,
Nat. Protocols, 16, 4177-4200, doi:
10.1038/s41596-021-00573-7.
143.Ren, X., Zhong, G., Zhang, Q., Zhang, L., Sun,
Y., and Zhang, Z. (2020) Reconstruction of cell spatial organization
from single-cell RNA sequencing data based on ligand-receptor mediated
self-assembly, Cell Res., 30, 763-778, doi:
10.1038/s41422-020-0353-2.
144.Chen, L., and Flies, D. B. (2013) Molecular
mechanisms of T cell co-stimulation and co-inhibition, Nat. Rev.
Immunol., 13, 227-242, doi: 10.1038/nri3405.
145.Ramilowski, J. A., Goldberg, T., Harshbarger,
J., Kloppmann, E., Lizio, M., Satagopam, V. P., Itoh, M., Kawaji, H.,
Carninci, P., Rost, B., and Forrest, A. R. (2015) A draft network of
ligand-receptor-mediated multicellular signalling in human, Nat.
Commun., 6, 7866, doi: 10.1038/ncomms8866.
146.Moses, L., and Pachter, L. (2022) Museum of
spatial transcriptomics, Nat. Methods, 19, 534-546, doi:
10.1038/s41592-022-01409-2.
147.Hahaut, V., Pavlinic, D., Carbone, W.,
Schuierer, S., Balmer, P., Quinodoz, M., Renner, M., Roma, G., Cowan,
C. S., and Picelli, S. (2022) Fast and highly sensitive full-length
single-cell RNA sequencing using FLASH-seq, Nat. Biotechnol.,
40, 1447-1451, doi: 10.1038/s41587-022-01312-3.
148.Cao, J., Cusanovich, D. A., Ramani, V.,
Aghamirzaie, D., Pliner, H. A., Hill, A. J., Daza, R. M.,
McFaline-Figueroa, J. L., Packer, J. S., Christiansen, L., et al.
(2018) Joint profiling of chromatin accessibility and gene expression
in thousands of single cells, Science, 361, 1380-1385,
doi: 10.1126/science.aau0730.
149.Chen, S., Lake, B. B., and Zhang, K. (2019)
High-throughput sequencing of the transcriptome and chromatin
accessibility in the same cell, Nat. Biotechnol., 37,
1452-1457, doi: 10.1038/s41587-019-0290-0.
150.Zachariadis, V., Cheng, H., Andrews, N., and
Enge, M. (2020) A highly scalable method for joint whole-genome
sequencing and gene-expression profiling of single cells, Mol.
Cell, 80, 541-553.e545, doi:
10.1016/j.molcel.2020.09.025.